On the afternoon of 12 October 2014, the eye of Cyclone Hudhud passed over Visakhapatnam. For a few hours the city that calls itself the “City of Destiny” lost almost everything that stood above the ground: around seven in ten of its trees, its power lines, its airport roof, the green slopes of Kailasagiri. People who lived through it still date their memories as “before Hudhud” and “after Hudhud”.
Twelve years later, as this is written on 24 October 2026, a depression is sitting over the east-central Bay of Bengal. The India Meteorological Department (IMD) expects it to become a deep depression tomorrow, a cyclonic storm on 26 October and a very severe cyclonic storm by 28 October, when it is forecast to cross the Andhra Pradesh coast between Bapatla and Visakhapatnam. If it reaches cyclone strength it will be called Arnab.
Those two sentences already use half a dozen technical words: low pressure area, depression, deep depression, cyclonic storm, coast, landfall. Weather bulletins use them with precise meanings, and most news reports blur them. This guide is an attempt to un-blur them. It explains every stage from a harmless patch of low pressure to a super cyclone, what “landfall” really means, why the Bay of Bengal and the Arabian Sea behave so differently, how forecasters watch a storm with satellites and radar, and what the words in an IMD warning should make you do. Then it walks through the big cyclones of the last twelve years, from Hudhud in October 2014 to the depression now over the Bay of Bengal in October 2026, and uses each one to teach a concept.
There are maps drawn from the international best-track archive, real satellite photographs from NASA and NOAA, photographs taken on the ground in Visakhapatnam, Puri and Kolkata, and a simulated radar picture of a storm approaching Visakhapatnam that shows what a Doppler radar actually measures. Every image says where it came from.
You do not need any background in meteorology. If you remember from school that warm air rises, you have enough.
How to read this guide
The guide has eleven parts. Parts 1 to 7 build the vocabulary and the science: what the categories mean, how a cyclone forms and is structured, why India’s two seas differ, the life of a storm, landfall and storm surge, how storms are watched and forecast, and how warnings and names work. Part 8 is the long one: twelve years of cyclones, year by year. Part 9 looks at what a warming ocean is changing. Part 10 is practical: what to do at each warning stage and the myths that get people hurt. Part 11 is a glossary of more than fifty terms you will meet in bulletins and news reports, followed by a one-minute recap table and the references.
If you are in a hurry and a storm is coming, jump to Part 10 first and come back for the rest later.
Part 1: The vocabulary of a storm
Pressure, wind and why air spins
Air has weight. At sea level the column of air above every square metre presses down with a force we measure in hectopascals (hPa). An ordinary day over the Indian coast reads about 1,005 to 1,012 hPa. A weather map joins places of equal pressure with lines called isobars, the same way a contour map joins places of equal height.
Where the pressure is lower than its surroundings, air flows in from all sides to fill the gap. On a planet that did not rotate it would flow straight in. On Earth, the rotation deflects moving air to the right in the northern hemisphere, an effect called the Coriolis force. Air heading into a low therefore curves, and the inflow becomes a spin. North of the equator, that spin around a low is anticlockwise when seen from above. Every cyclone that has ever hit India has turned anticlockwise.
The Coriolis effect is almost zero at the equator and grows towards the poles. This is why tropical cyclones almost never form within about 5° of the equator. It is also why the southern tip of Sri Lanka and the Maldives see very few cyclones, while the waters off Odisha see many.
Real world: when Cyclone Fani formed in late April 2019 it started unusually close to the equator, just a few degrees north of it, west of Sumatra. It spent days drifting slowly northwards, gathering strength over warm water, partly because the spin needed latitude before it could organise. That long slow start is one reason it became so powerful by the time it reached Puri.
The ladder: from low pressure to super cyclone
IMD, which is also the World Meteorological Organization’s Regional Specialised Meteorological Centre (RSMC) for the North Indian Ocean, classifies every system by its maximum sustained surface wind. That means the strongest wind averaged over three minutes at a height of 10 metres. Gusts can be 30 to 50 per cent stronger, but the class is set by the sustained wind.
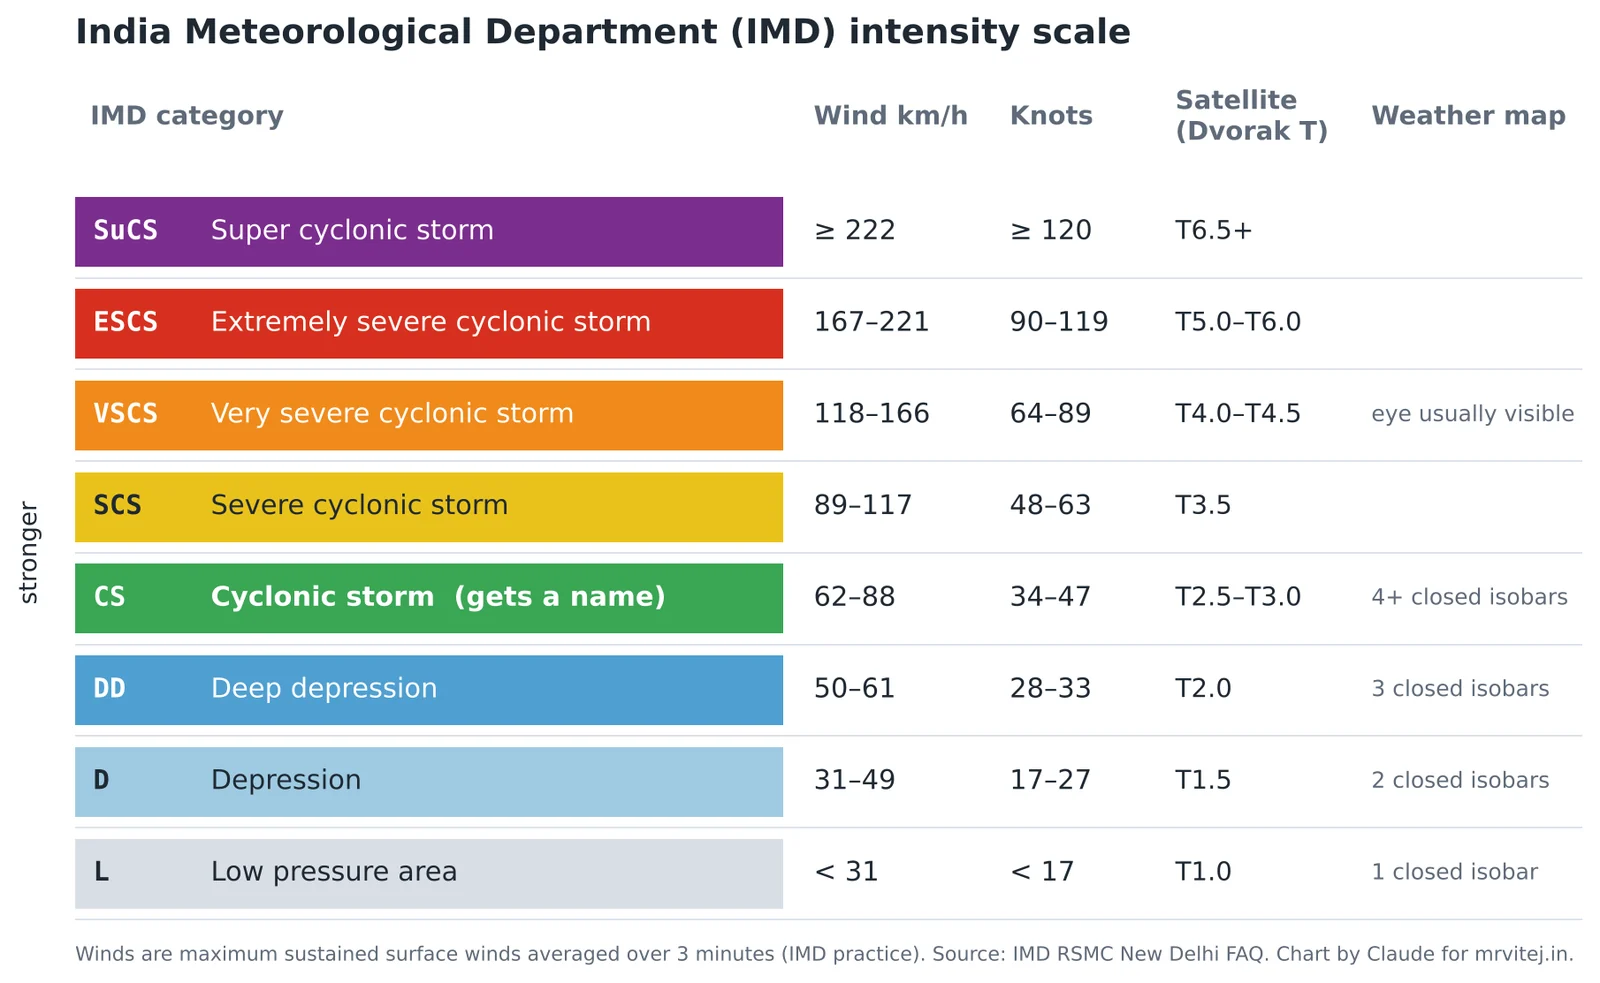
Here is the ladder in plain words.
Low pressure area (L or LPA). A region where pressure is lower than its surroundings and one closed isobar can be drawn around it, with winds under 31 km/h. India sees dozens a year, especially during the monsoon. Most bring a day or two of rain and nothing more. Bulletins often mention an upper air cyclonic circulation first: a spin that exists a few kilometres up, before any low shows at the surface. Our current system began exactly that way, as a circulation aloft that produced a low at the surface on the morning of 23 October 2026.
Well-marked low pressure area (WML). A low that has deepened enough to be clearly visible on the map, usually with two closed isobars at the 2 hPa interval but winds still below depression strength. It is the step where forecasters start to watch closely.
Depression (D). Sustained winds of 31 to 49 km/h (17 to 27 knots). The system now has a defined centre that forecasters can track. IMD gives it a number such as BOB 03 (the third depression of the year in the Bay of Bengal) or ARB 01 (the first in the Arabian Sea). Systems that form over land get a LAND number.
Deep depression (DD). Winds of 50 to 61 km/h (28 to 33 knots). Heavy rain is now likely over a wide area, and fishermen are told to stay in harbour.
Cyclonic storm (CS). Winds of 62 to 88 km/h (34 to 47 knots). This is the threshold of a true tropical cyclone, the point where a storm gets a name from the regional list. A cyclonic storm can uproot weak trees and damage thatched and tin roofs.
Severe cyclonic storm (SCS). Winds of 89 to 117 km/h (48 to 63 knots). Damage to houses, power lines and crops becomes widespread.
Very severe cyclonic storm (VSCS). Winds of 118 to 166 km/h (64 to 89 knots). This is roughly the strength of a Category 1 or 2 hurricane in the Atlantic. An eye usually appears on satellite pictures at this stage.
Extremely severe cyclonic storm (ESCS). Winds of 167 to 221 km/h (90 to 119 knots). Large-scale destruction near the track, and storm surge that can flood several kilometres inland on flat coasts. Hudhud, Fani, Tauktae and Mocha all reached this level.
Super cyclonic storm (SuCS). Winds of 222 km/h (120 knots) or more. The top of the scale. Only a handful have been recorded in the North Indian Ocean: the 1999 Odisha super cyclone, Gonu in 2007, and in our twelve-year window, Kyarr in 2019 and Amphan in 2020.
Real world: the deep depression that crossed Tamil Nadu near Puducherry in November 2015 never got a name, yet its rain helped set off the floods that devastated Chennai that winter. In late July 2026, a deep depression over the Bay of Bengal (BOB 03) moved inland across central India and was linked to 31 deaths in several states, from building collapses to lightning. The ladder measures wind, not danger. Keep that in mind; we will come back to it.
Why a closed isobar matters
You will sometimes read that a depression “has two closed isobars” or a cyclonic storm “four or more”. The IMD definitions use this because over land, where wind measurements are distorted by buildings and terrain, the pressure pattern is a more reliable test. Over the sea, satellites and ships measure wind directly, and wind sets the class. Each additional closed isobar at 2 hPa intervals means the centre is at least 2 hPa deeper than its surroundings, and a deeper centre pulls air in faster.
Three minutes, one minute, ten minutes: why agencies disagree
If you follow a storm on several websites, you will see different wind speeds for the same moment. Fani, for example, peaked at 215 km/h by IMD’s estimate and 280 km/h by the American Joint Typhoon Warning Center (JTWC). Neither is wrong. They measure different things:
| Agency | Averaging period | Scale used |
|---|---|---|
| IMD (India, RSMC New Delhi) | 3 minutes | Depression to Super cyclonic storm |
| JTWC (US military) | 1 minute | Saffir-Simpson Category 1 to 5 |
| Japan, Australia, most WMO centres | 10 minutes | Their own regional scales |
A one-minute average catches the peak of a gust cycle and so comes out higher than a three-minute average of the same wind. The difference is a few per cent for the averaging alone, but agencies also analyse satellite data with different methods, and for intense storms the gap can grow much larger, as Fani showed. When you compare numbers, compare like with like. When you make decisions in India, use IMD: its warnings are the ones that set evacuations, port signals and school closures.
A rough translation helps when you read foreign reports. A very severe cyclonic storm is roughly a Category 1 to 2 hurricane. An extremely severe cyclonic storm overlaps Categories 3 and 4. A super cyclonic storm is a strong Category 4 or a Category 5.
The name: when and why storms get one
A storm gets its name when IMD upgrades it to a cyclonic storm, never before. The name comes from a list drawn up by the thirteen countries of the WMO/ESCAP Panel on Tropical Cyclones: Bangladesh, India, Iran, Maldives, Myanmar, Oman, Pakistan, Qatar, Saudi Arabia, Sri Lanka, Thailand, the United Arab Emirates and Yemen. Each country contributed thirteen names, and the 169 names are used strictly in order. A name is never reused. If the current system becomes a cyclonic storm it will be Arnab, Bangladesh’s word for the sea, and it will be the 27th name used from the list published in 2020. The next name after that is Murasu, from India.
A name is not decoration. In a region where warnings go out in a dozen languages over radio, television, SMS and loudspeakers, a short distinct name reduces confusion when two storms are active at once, as happened with Kyarr and Maha in 2019 and with Tej and Hamoon in 2023.
Part 2: How a cyclone is born and what is inside it
The engine: warm water
A tropical cyclone is a heat engine. Its fuel is water vapour evaporated from a warm sea. When moist air rises and cools, the vapour condenses into cloud droplets and releases the heat that was used to evaporate it, the latent heat. That heat warms the rising column, which makes it lighter, which makes it rise faster, which draws in more moist air at the surface. As long as warm water keeps supplying vapour and nothing disrupts the column, the loop strengthens itself.
Meteorologists list six ingredients. A storm needs most of them at once.
- Warm sea surface. Usually 26.5 °C or warmer. The Bay of Bengal and the Arabian Sea are above this for most of the year outside the peak monsoon.
- Warm water at depth. A storm stirs the ocean and brings up water from below. If the warm layer is thin, the storm churns up cold water and starves itself. Scientists measure this with tropical cyclone heat potential, the heat stored in the water warmer than 26 °C.
- Moist air in the middle of the atmosphere, at 3 to 6 km. Dry air there gets pulled into the storm, evaporates cloud droplets, cools, sinks, and chokes the updrafts.
- Low vertical wind shear. Shear is the change of wind speed or direction with height. If the wind at 12 km is very different from the wind near the surface, it tilts the storm and tears the top away from the bottom.
- Enough distance from the equator, at least about 5°, for the Coriolis effect to organise a spin.
- A pre-existing disturbance: a low, a trough, the leftover of an old storm, or an upper air circulation. Cyclones do not start from calm air.
Real world: in October 2014, Cyclone Nilofar became an extremely severe cyclonic storm over the open Arabian Sea and was forecast to reach Gujarat. Instead, wind shear rose, and dry, cooler air flowed in from the north-west, off the deserts of Pakistan and Arabia. Within about two days the eye vanished and Nilofar fell apart into a remnant low before reaching the coast. Two ingredients disappeared, and a very strong storm died at sea.
Where the starting disturbances come from
Over the Bay of Bengal, many cyclones begin as a low that drifts in from the east. Some are leftovers of storms from the western Pacific and the South China Sea that crossed Vietnam, Thailand or Myanmar and found warm water again in the Andaman Sea. Cyclone Bulbul in November 2019 was exactly that: the remains of Tropical Storm Matmo, which had hit Vietnam a week earlier.
Others form along the monsoon trough or in the Inter-Tropical Convergence Zone (ITCZ), the belt of rising air near the equator where the trade winds of the two hemispheres meet. In May and in October to December this belt sits over the southern Bay of Bengal and the southern Arabian Sea, which is exactly where most pre-monsoon and post-monsoon cyclones form.
Global patterns also help or hinder. The Madden-Julian Oscillation (MJO), a pulse of cloud and rain that travels eastward around the tropics every 30 to 60 days, raises the chances of cyclone formation when its wet phase passes over the Indian Ocean. Forecasters often say a storm is “likely in the second week” because the MJO is due. The El Niño-Southern Oscillation (ENSO) and the Indian Ocean Dipole (IOD) shift where the warmest water sits and so shift the odds between the Bay and the Arabian Sea from year to year.
Inside a mature cyclone
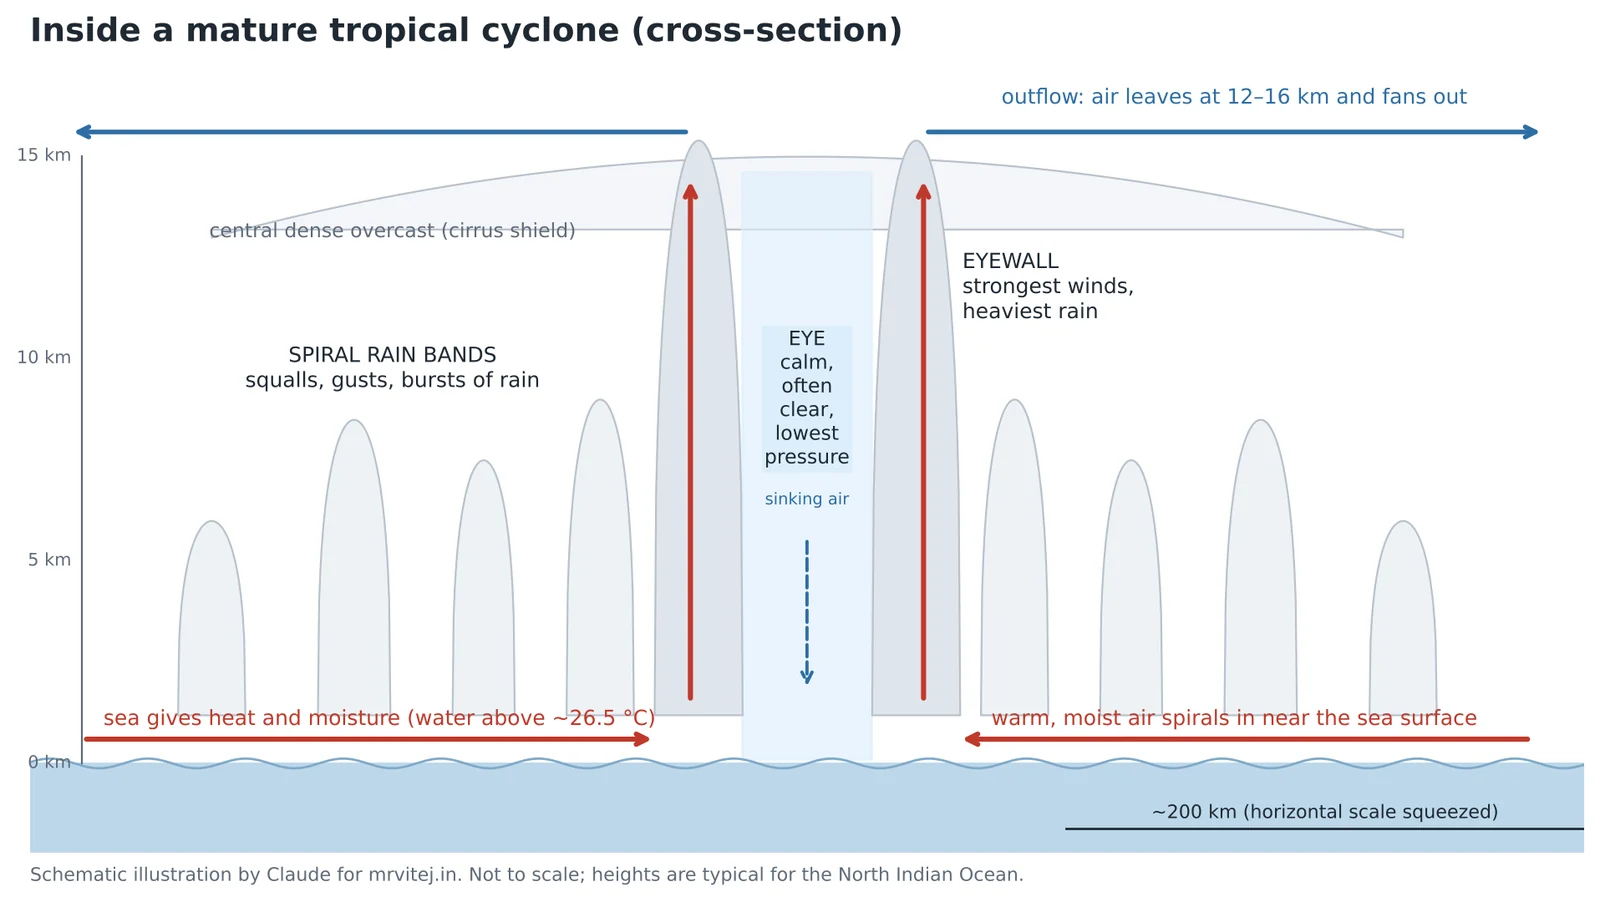
Seen from above, a mature cyclone is a disc of cloud 500 to 1,000 km across. Seen from the side, it has five parts.
The eye. A calm, often clear centre, typically 30 to 60 km across in strong storms, though it ranges from under 10 km to over 100 km. Air in the eye sinks slowly and warms as it sinks, which is why the eye is clear and why the centre of a cyclone is warmer than its surroundings (a warm core). The lowest pressure is here. Amphan’s centre fell to 920 hPa, almost 9 per cent below normal sea-level pressure.
The eyewall. A ring of towering thunderstorms around the eye, reaching 15 km or more, where the strongest winds and heaviest rain are. The distance from the centre to the strongest winds is called the radius of maximum wind. When people say a place “took a direct hit”, they mean the eyewall passed over it.
Spiral rain bands. Long curved bands of thunderstorms that wind in towards the centre. Between them, the weather can be surprisingly calm. Inside them come bursts of torrential rain and squalls. The first rain band to reach a coast is often a day ahead of the eye.
The central dense overcast (CDO). The solid shield of high cirrus cloud spread out by the eyewall and the inner bands. It is what you see as a white disc on visible satellite images.
Outflow. At the top, 12 to 16 km up, air flows outward and away. Good outflow acts like a chimney draft. When forecasters say “the upper-level environment is favourable” they usually mean the outflow has a clear path.
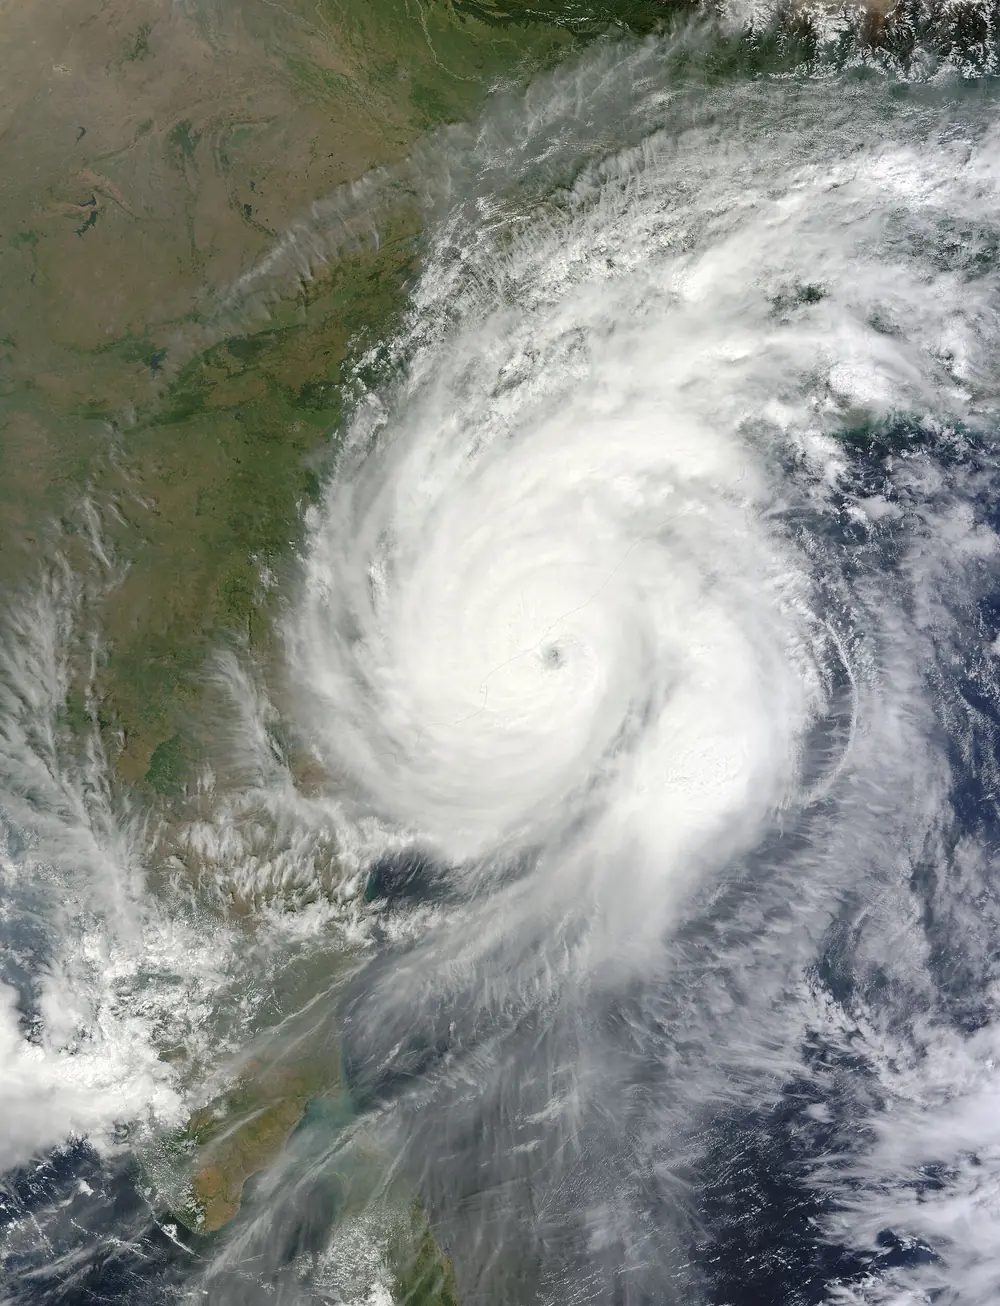
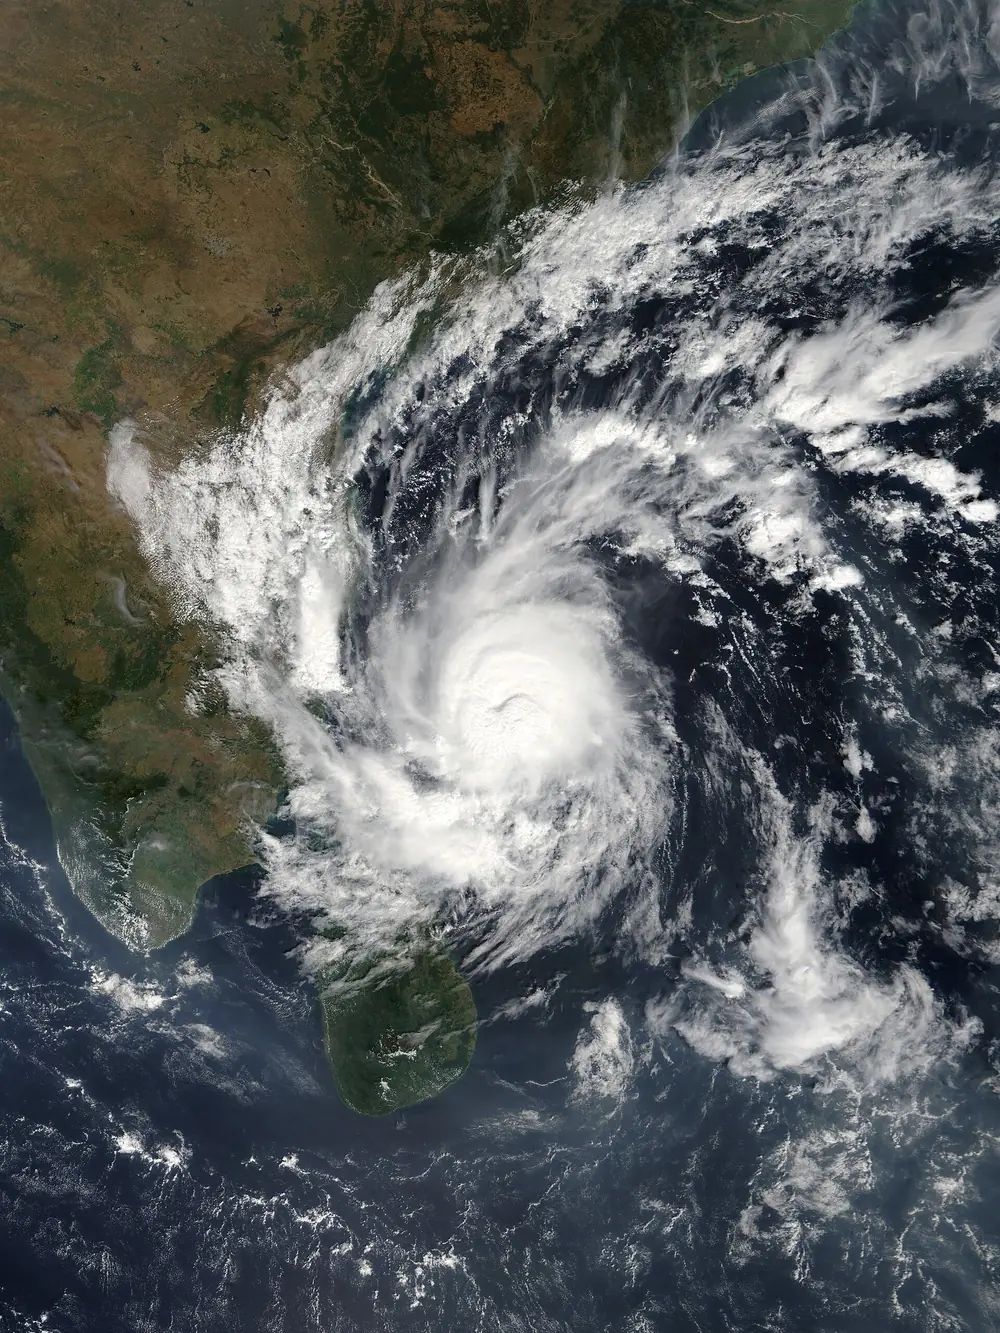
Real world: compare the satellite pictures of Hudhud and Gaja. Hudhud on the morning of its landfall shows a small, perfectly round eye and a tight CDO, the signature of an extremely severe storm. Gaja three days before its landfall shows a broader, ragged pattern with a less defined centre, typical of a storm that is strong but not intensifying fast.


Eyewall replacement
Very strong cyclones sometimes grow a second eyewall outside the first. The outer ring starves the inner one of moist air, the inner eyewall collapses, and the outer ring contracts to take its place. During this eyewall replacement cycle the peak wind usually drops for a while, but the area of strong winds grows. A storm can then re-intensify. Amphan went through such a cycle on 18 and 19 May 2020, which is part of why it reached the coast weaker than its peak but with a very wide wind field.
What makes a storm stop
A cyclone weakens when any part of the engine fails:
- Landfall. Over land there is no warm sea, so the fuel supply stops, and land surfaces add friction. Most Indian cyclones fall from their landfall category to a depression within 12 to 24 hours.
- Cold water. Moving over cooler sea, or stalling and churning up cold water from below.
- Dry air and shear, as Nilofar showed.
- Interaction with another system, such as a westerly trough that pulls the storm north and shears it apart.
The remnants of a dead cyclone still carry enormous amounts of water vapour. Hudhud’s remnant moved north across India into the Himalaya, where it brought a freak snowstorm to Nepal that killed 43 people on mountain trails. Montha’s leftovers in October 2025 drenched Telangana days after the winds had died.
Part 3: India’s two seas, and why they behave so differently
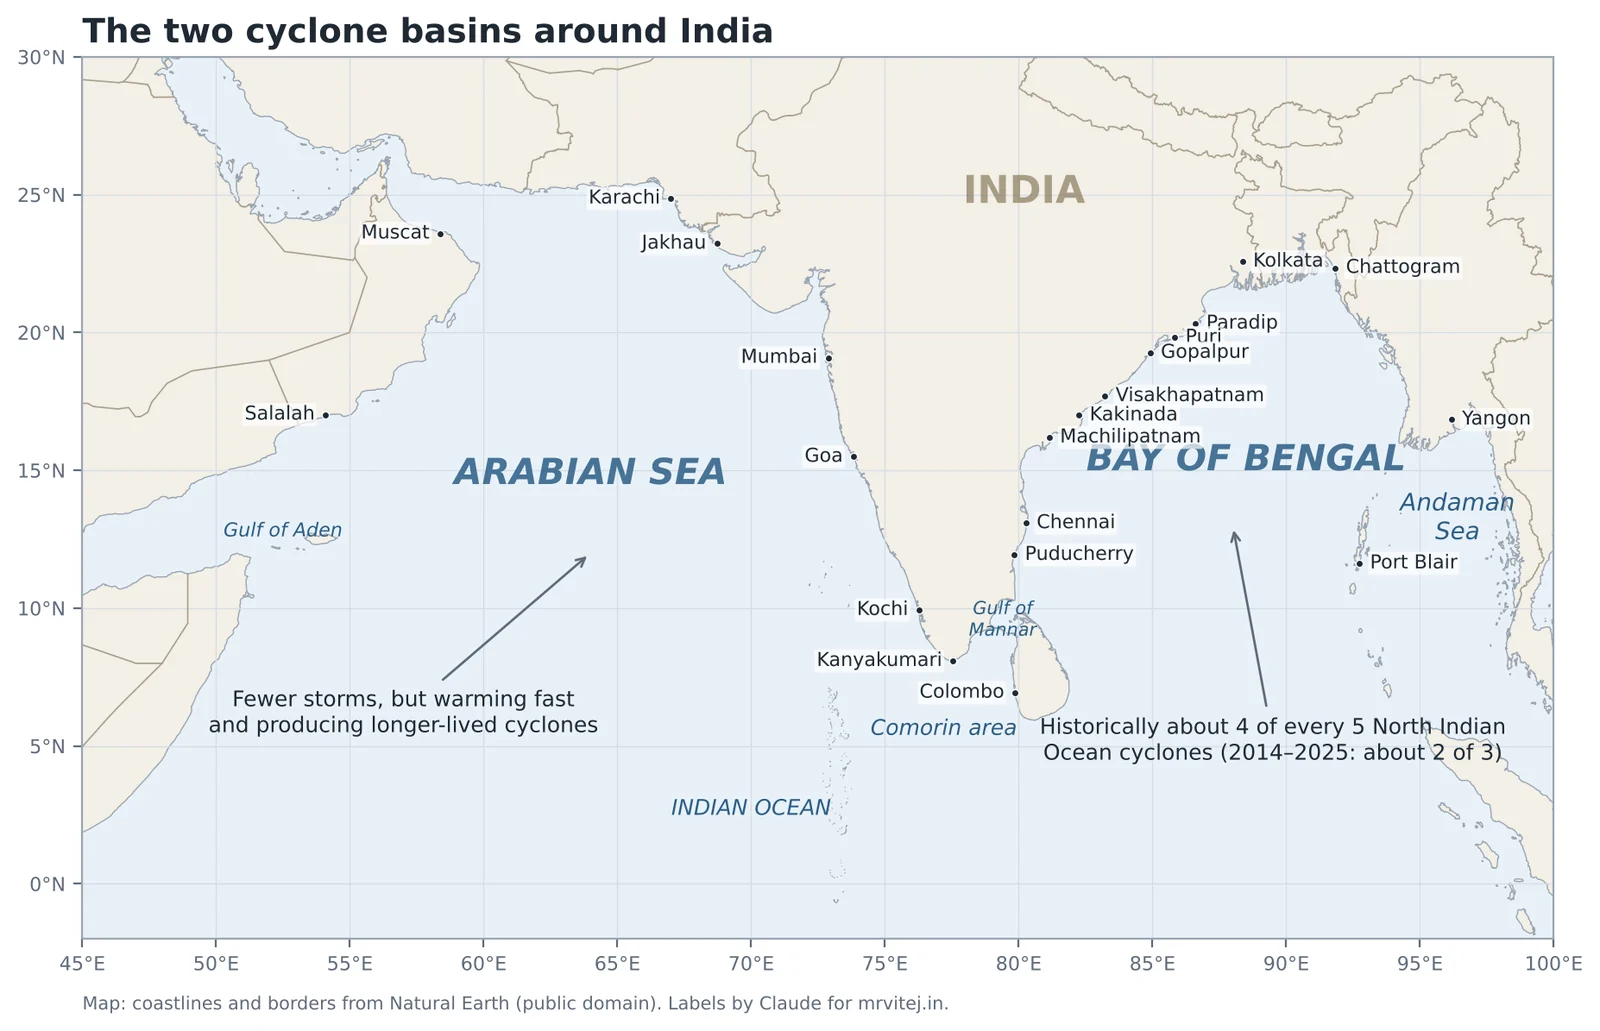
India sits between two cyclone basins that share the same latitude and the same monsoon, yet produce very different storms. Understanding the difference explains most of what you will read about Indian cyclones.
The Bay of Bengal: the busier, deadlier basin
Over the long record, roughly four out of every five North Indian Ocean cyclones form in the Bay of Bengal. Several things favour it.
- Warmth. The Bay is among the warmest seas on Earth, often 29 to 31 °C in May and October.
- A freshwater lid. The Ganga, Brahmaputra, Meghna, Irrawaddy, Mahanadi, Godavari and Krishna pour enormous volumes of fresh water into the Bay. Fresh water is lighter than salt water, so it forms a layer on top that resists mixing. A storm passing over the Bay has a harder time stirring up cold water from below, so it keeps its fuel supply. Oceanographers call the stable layer a barrier layer.
- Seed disturbances from the east. Lows and old storms drifting in from the South China Sea and the Andaman Sea give the Bay a steady supply of starting points.
- Moist air. The air over the Bay is humid through most of the year, unlike the Arabian Sea, which borders deserts.
The Bay is also far more dangerous to people. Its northern end is a funnel: the coast curves round from Odisha through West Bengal to Bangladesh and Myanmar, so water pushed north by a storm has nowhere to go but up and inland. The continental shelf in the north is wide and shallow, and the Ganga-Brahmaputra delta is flat and only a few metres above sea level for a hundred kilometres inland. Together these make the northern Bay the most surge-prone coast in the world. The 1970 Bhola cyclone in what is now Bangladesh, and the 1999 super cyclone that killed about 10,000 people in Odisha, both did most of their killing through the sea, not the wind.
The Arabian Sea: fewer storms, changing fast
The Arabian Sea historically produces about one cyclone a year, and many of them turn away from India towards Oman, Yemen or Somalia. The reasons:
- Monsoon cooling. From June to September the strong south-westerly monsoon wind, the Somali jet, drives upwelling along the coasts of Somalia and Oman: cold water rises from depth and cools much of the western Arabian Sea.
- Dry air. Hot, dry air from Arabia, Iran and Pakistan flows over the northern Arabian Sea and, as Nilofar showed, kills storms that draw it in.
- Steering. Storms in the Arabian Sea often move north-west or west, away from India, along the southern edge of the subtropical high pressure over Arabia.
But the Arabian Sea is warming faster than most of the world’s oceans, and its storms are changing. Research at the Indian Institute of Tropical Meteorology found that from 1982 to 2019 the number of cyclonic storms in the Arabian Sea rose by about half, their lifetimes grew by about 80 per cent, and the total energy they released roughly tripled, while the Bay of Bengal showed no significant change. Our own count for 2014 to 2025 fits that picture: 20 of the 55 named storms, more than a third, formed in the Arabian Sea, far above the historical one in five. Part 9 looks at this in detail.
| Bay of Bengal | Arabian Sea | |
|---|---|---|
| Share of cyclones (long-term) | About 4 in 5 | About 1 in 5 |
| Share in 2014–2025 (this guide’s count) | 35 of 55 | 20 of 55 |
| Sea surface temperature | Very warm all year outside winter | Cooled by upwelling in the monsoon |
| Ocean structure | Freshwater lid from big rivers resists mixing | Saltier, mixes more easily |
| Typical seed | Lows and old storms from the east, monsoon trough | ITCZ, lows off Kerala and Lakshadweep |
| Biggest hazard | Storm surge on flat deltas | Wind and rain; long-lived storms at sea |
| Where storms go | Odisha, Andhra, Tamil Nadu, West Bengal, Bangladesh, Myanmar | Gujarat, Maharashtra, Oman, Yemen, Pakistan, Somalia |
Real world: in the same week of October 2023, two storms ran at once: Tej in the Arabian Sea and Hamoon in the Bay of Bengal. Tej became an extremely severe cyclonic storm and went west to Yemen. Hamoon became a very severe cyclonic storm and went north-east to Bangladesh. Neither touched India, but both were tracked by IMD as RSMC for the whole region.
Two seasons, not one
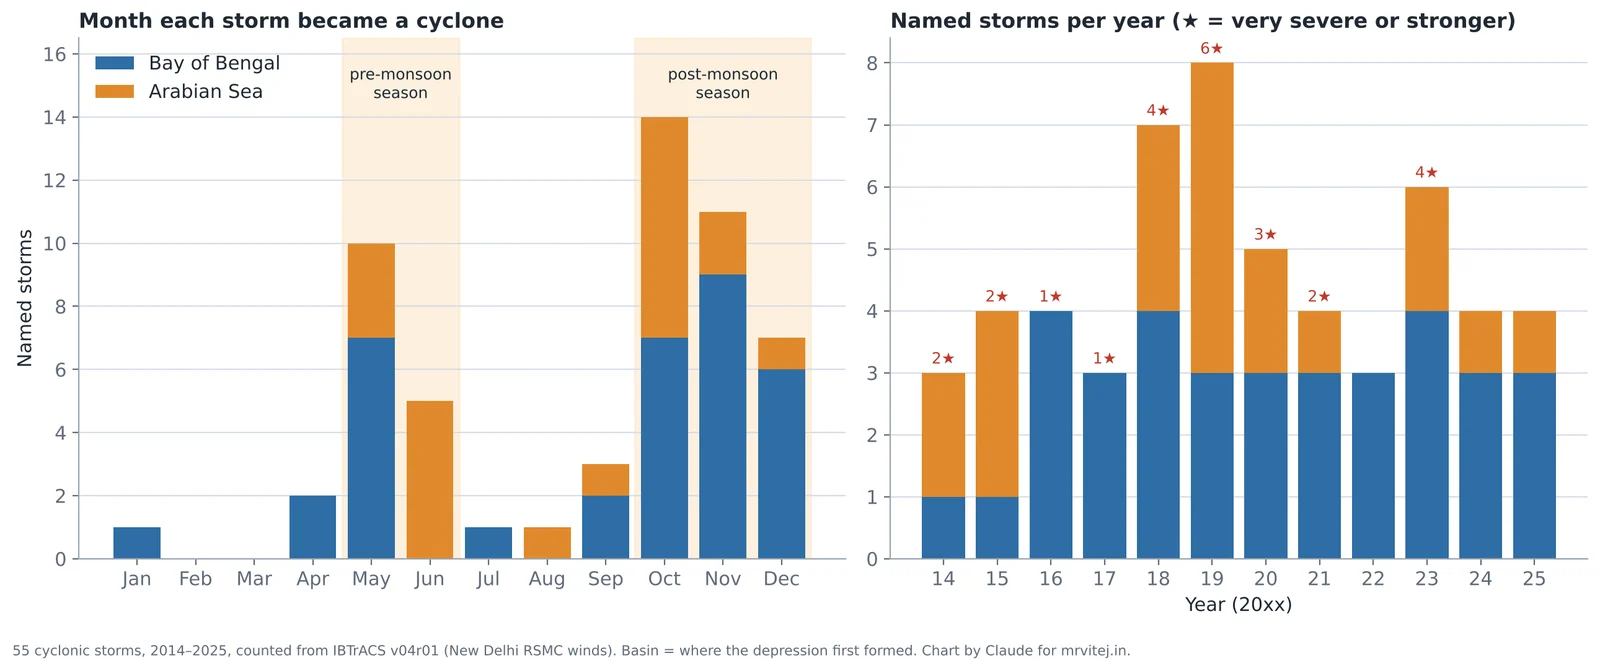
India’s cyclone calendar has two peaks.
Pre-monsoon (April to early June). The sea is at its warmest and the upper winds are light. Storms in May are fewer but can be very intense: Fani (2019), Amphan (2020), Tauktae and Yaas (2021), Mocha (2023), Remal (2024). In the Arabian Sea, early June storms such as Nisarga (2020) and Biparjoy (2023) form just as the monsoon arrives, and they can disturb its progress. Vayu in June 2019 delayed the monsoon’s advance into north India by about a week.
Post-monsoon (October to December). The main season. The monsoon trough retreats south, the ITCZ sits over the southern Bay, and storms march west or north-west into Andhra Pradesh, Tamil Nadu and Odisha. October and November produced 25 of the 55 named storms in our window. Hudhud, Titli, Gaja, Nivar, Michaung, Dana, Fengal and Montha are all post-monsoon storms.
During the monsoon (July to September) cyclones are rare. The upper atmosphere carries a strong easterly jet at around 12 to 15 km over south Asia, which creates strong vertical shear. The Bay instead produces monsoon depressions: broad lows that form at its head and move west-north-west along the monsoon trough into central India. They do not get names, but they are the main rain-makers of the monsoon and can cause severe floods, as BOB 03 did in July 2026.
January to March is almost empty. In our window only Pabuk, a storm that came in from the South China Sea in January 2019, reached cyclone strength in that period.
Part 4: The life of a cyclone, from first spin to last rain
One storm, start to finish
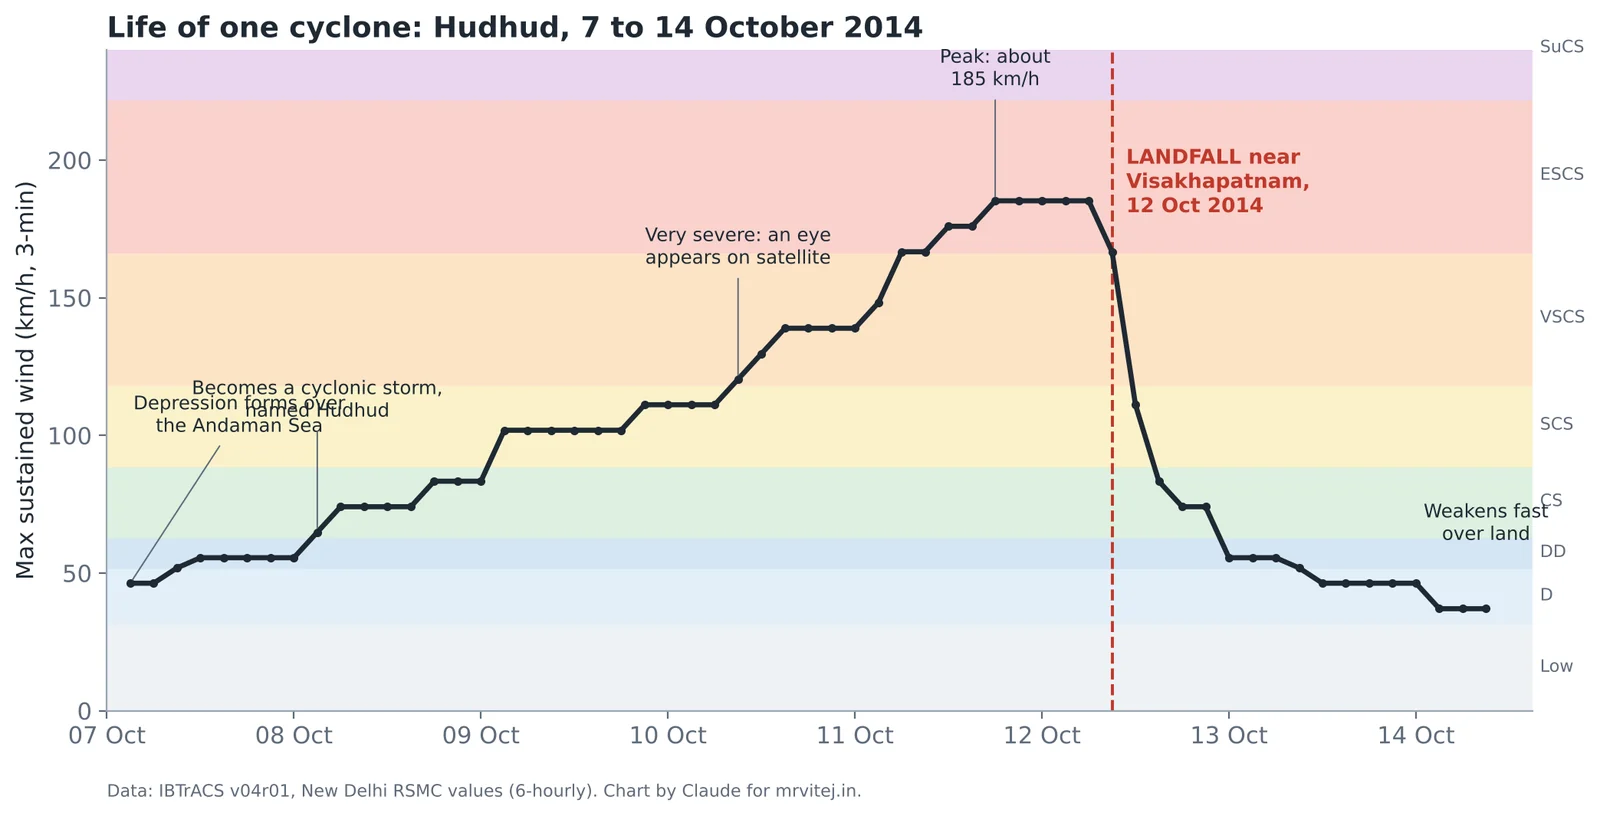
Hudhud is a textbook example, and the chart above shows its whole life as measured six-hourly by RSMC New Delhi.
- Genesis (6 to 7 October). A low over the Andaman Sea deepened into a depression. Satellite pictures showed loosely curved bands of cloud with no clear centre.
- Organisation (8 October). The depression became a deep depression and then a cyclonic storm, and got its name, Hudhud, a bird suggested by Oman.
- Steady growth (8 to 10 October). It moved west-north-west across the open Bay of Bengal, steered by high pressure to its north, strengthening by roughly one category a day. By the evening of 10 October it was a very severe cyclonic storm and an eye had formed.
- Rapid intensification (11 October). In about a day it jumped from around 140 km/h to about 185 km/h, becoming an extremely severe cyclonic storm with a small, sharp eye.
- Landfall (12 October). The eye crossed the coast near Visakhapatnam around midday and early afternoon, at or near peak strength.
- Decay (12 to 14 October). Over land, cut off from the warm sea, it fell from extremely severe to a depression in under a day, then drifted north as a low, carrying its moisture towards Uttar Pradesh and the Himalaya.
Almost every cyclone in this guide follows a version of this path. What changes from storm to storm is how fast each step happens, where the storm is when it peaks, and what lies at the end of its track.
Rapid intensification: the forecaster’s nightmare
Forecasters define rapid intensification as an increase of at least 30 knots (about 55 km/h) in the maximum sustained wind within 24 hours. It happens when every ingredient lines up at once: very warm deep water, moist air, very low shear and a compact, well-organised core. It is the hardest thing in cyclone forecasting to predict, and the most dangerous, because a storm can go from “severe” to “extremely severe” between the evening news and the next morning.
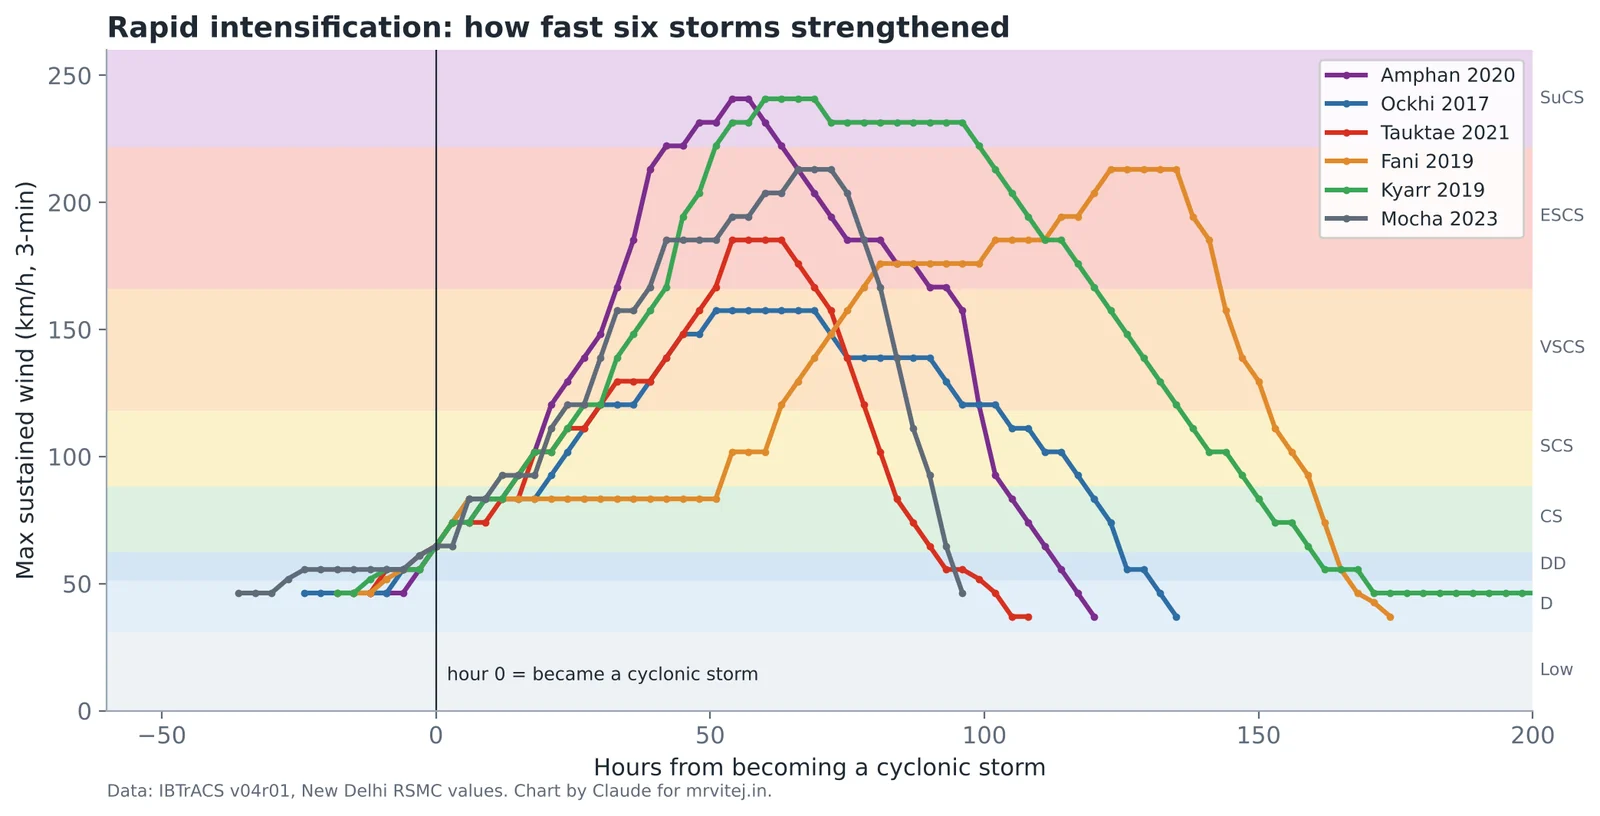
From RSMC New Delhi’s own six-hourly values in the international archive:
- Amphan (May 2020) gained about 120 km/h in the 24 hours to the morning of 18 May (Indian time), going from a severe cyclonic storm to the brink of super cyclone strength, which it reached a few hours later.
- Kyarr (October 2019) gained about 110 km/h in 24 hours on 26 and 27 October, becoming the first super cyclonic storm in the Arabian Sea since Gonu in 2007.
- Mocha (May 2023) gained over 90 km/h in a day on 11 and 12 May.
- Fani (April 2019) sat for two days at cyclonic storm strength, then strengthened by about 75 km/h in a day once it moved over deeper warm water.
- Tauktae (May 2021) gained about 65 km/h in a day while running north just off the Konkan coast.
- Ockhi (November 2017) never looked dramatic on this chart, but its timing was cruel: it went from deep depression to cyclonic storm in about six hours while passing just south of Kanyakumari, leaving fishermen already at sea no time to get back.
Rapid intensification close to the coast is the scenario emergency planners fear most, because evacuation decisions have to be made on the forecast, not on the storm’s current strength.
What steers a cyclone
A cyclone does not move under its own power. It is carried by the large-scale winds around it, mostly the average wind through the middle of the atmosphere, called the steering current. Over the Bay of Bengal and Arabian Sea in the cyclone seasons, the biggest influence is the subtropical ridge, a belt of high pressure to the north. Storms on the ridge’s southern side move west or west-north-west. When the ridge weakens or a trough of westerly winds dips south from the Himalaya, the storm turns north and then north-east. This turn is called recurvature.
Recurvature decides who gets hit. Titli in October 2018 crossed the coast near Palasa in Srikakulam and then recurved sharply north-east through Odisha, dumping extreme rain on the Gajapati hills, where a landslide killed 12 people who had sheltered in a cave. Bulbul, Amphan, Yaas, Remal and Dana all recurved towards Odisha, West Bengal or Bangladesh. In the Arabian Sea, Vayu in June 2019 was forecast to hit Gujarat, turned west at the last moment, wandered at sea for days, and then looped back to the Kutch coast as a weak low.
Speed matters as much as direction. A storm moving at 20 km/h passes in a few hours. A storm moving at 5 km/h, like Fengal near Puducherry in November 2024 or Ditwah over Sri Lanka in November 2025, can rain on the same place for two days.
Weakening, remnants and rebirth
After landfall a cyclone usually weakens to a deep depression within 12 hours and to a depression within a day, then to a well-marked low and finally a remnant low. Those remnants still matter. Gulab in September 2021 crossed the north Andhra coast near Kalingapatnam as a cyclonic storm, weakened, travelled the whole width of India as a low, emerged over the Arabian Sea near Gujarat, and regenerated into a new storm called Shaheen, which went on to strike Oman. Gaja in 2018 crossed Tamil Nadu and Kerala and re-emerged as a depression in the Arabian Sea.
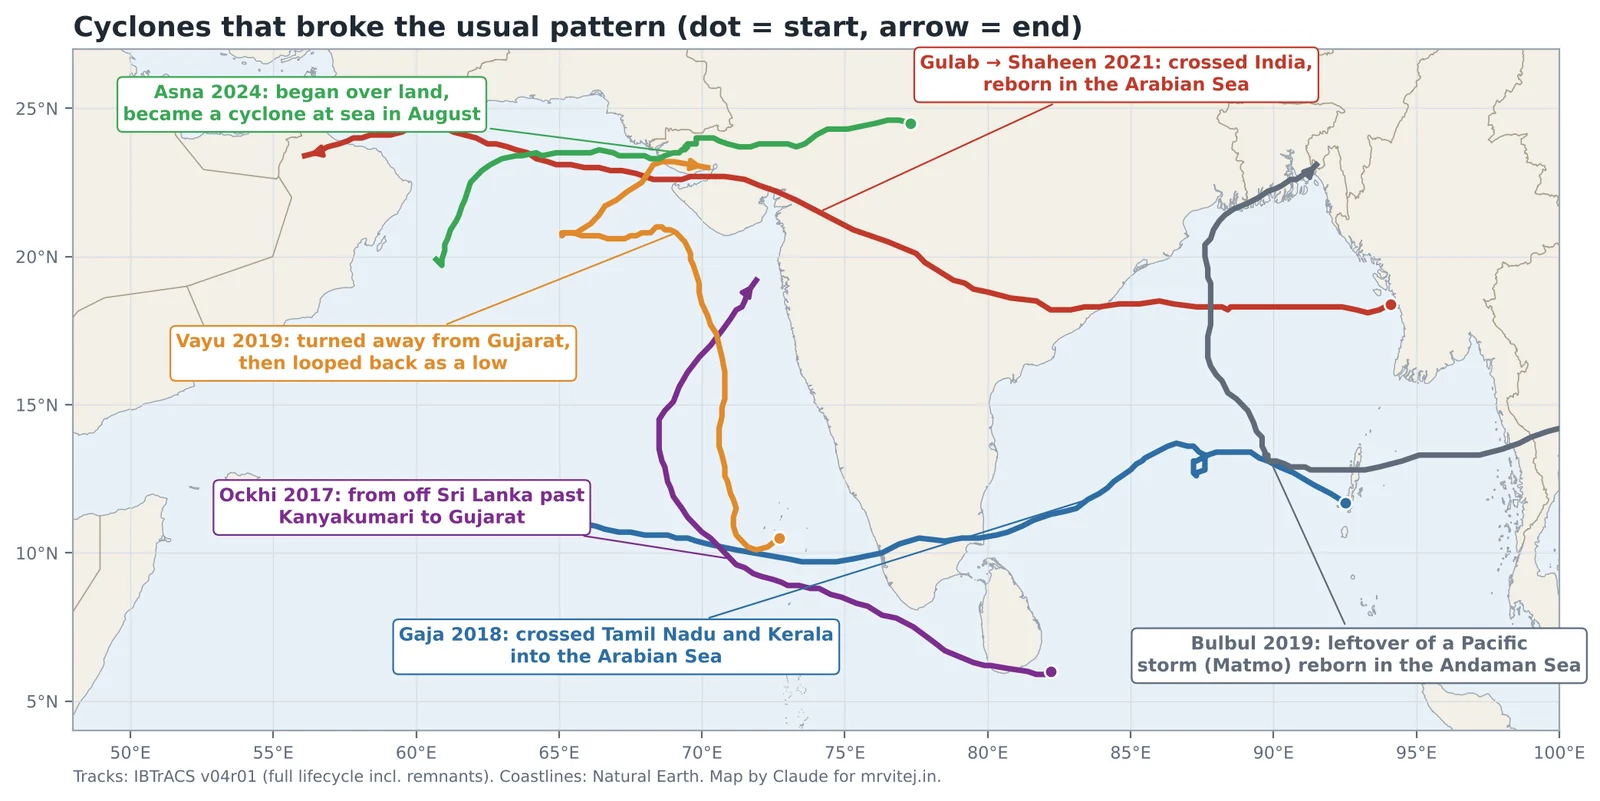
The opposite also happens. Cyclone Asna in August 2024 began as a depression over land in Rajasthan and Gujarat, drifted south-west over the Rann of Kutch, reached the sea and only then became a cyclonic storm. A land-born depression turning into a cyclone over the Arabian Sea in August has been recorded only a few times since the 1890s.
Every named storm of the last twelve years
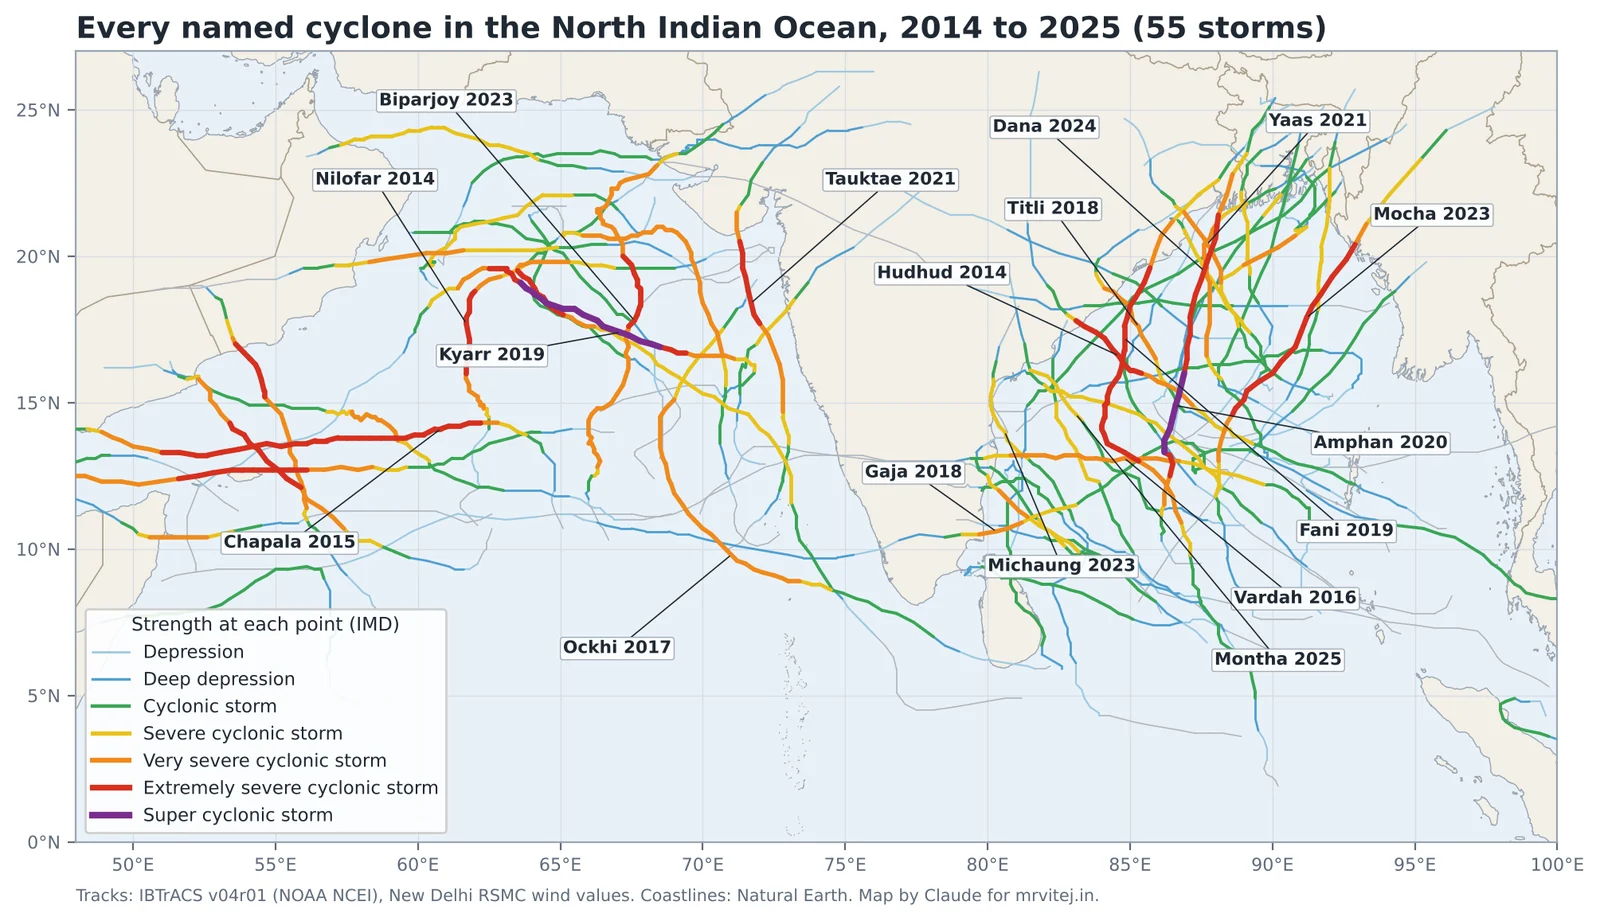
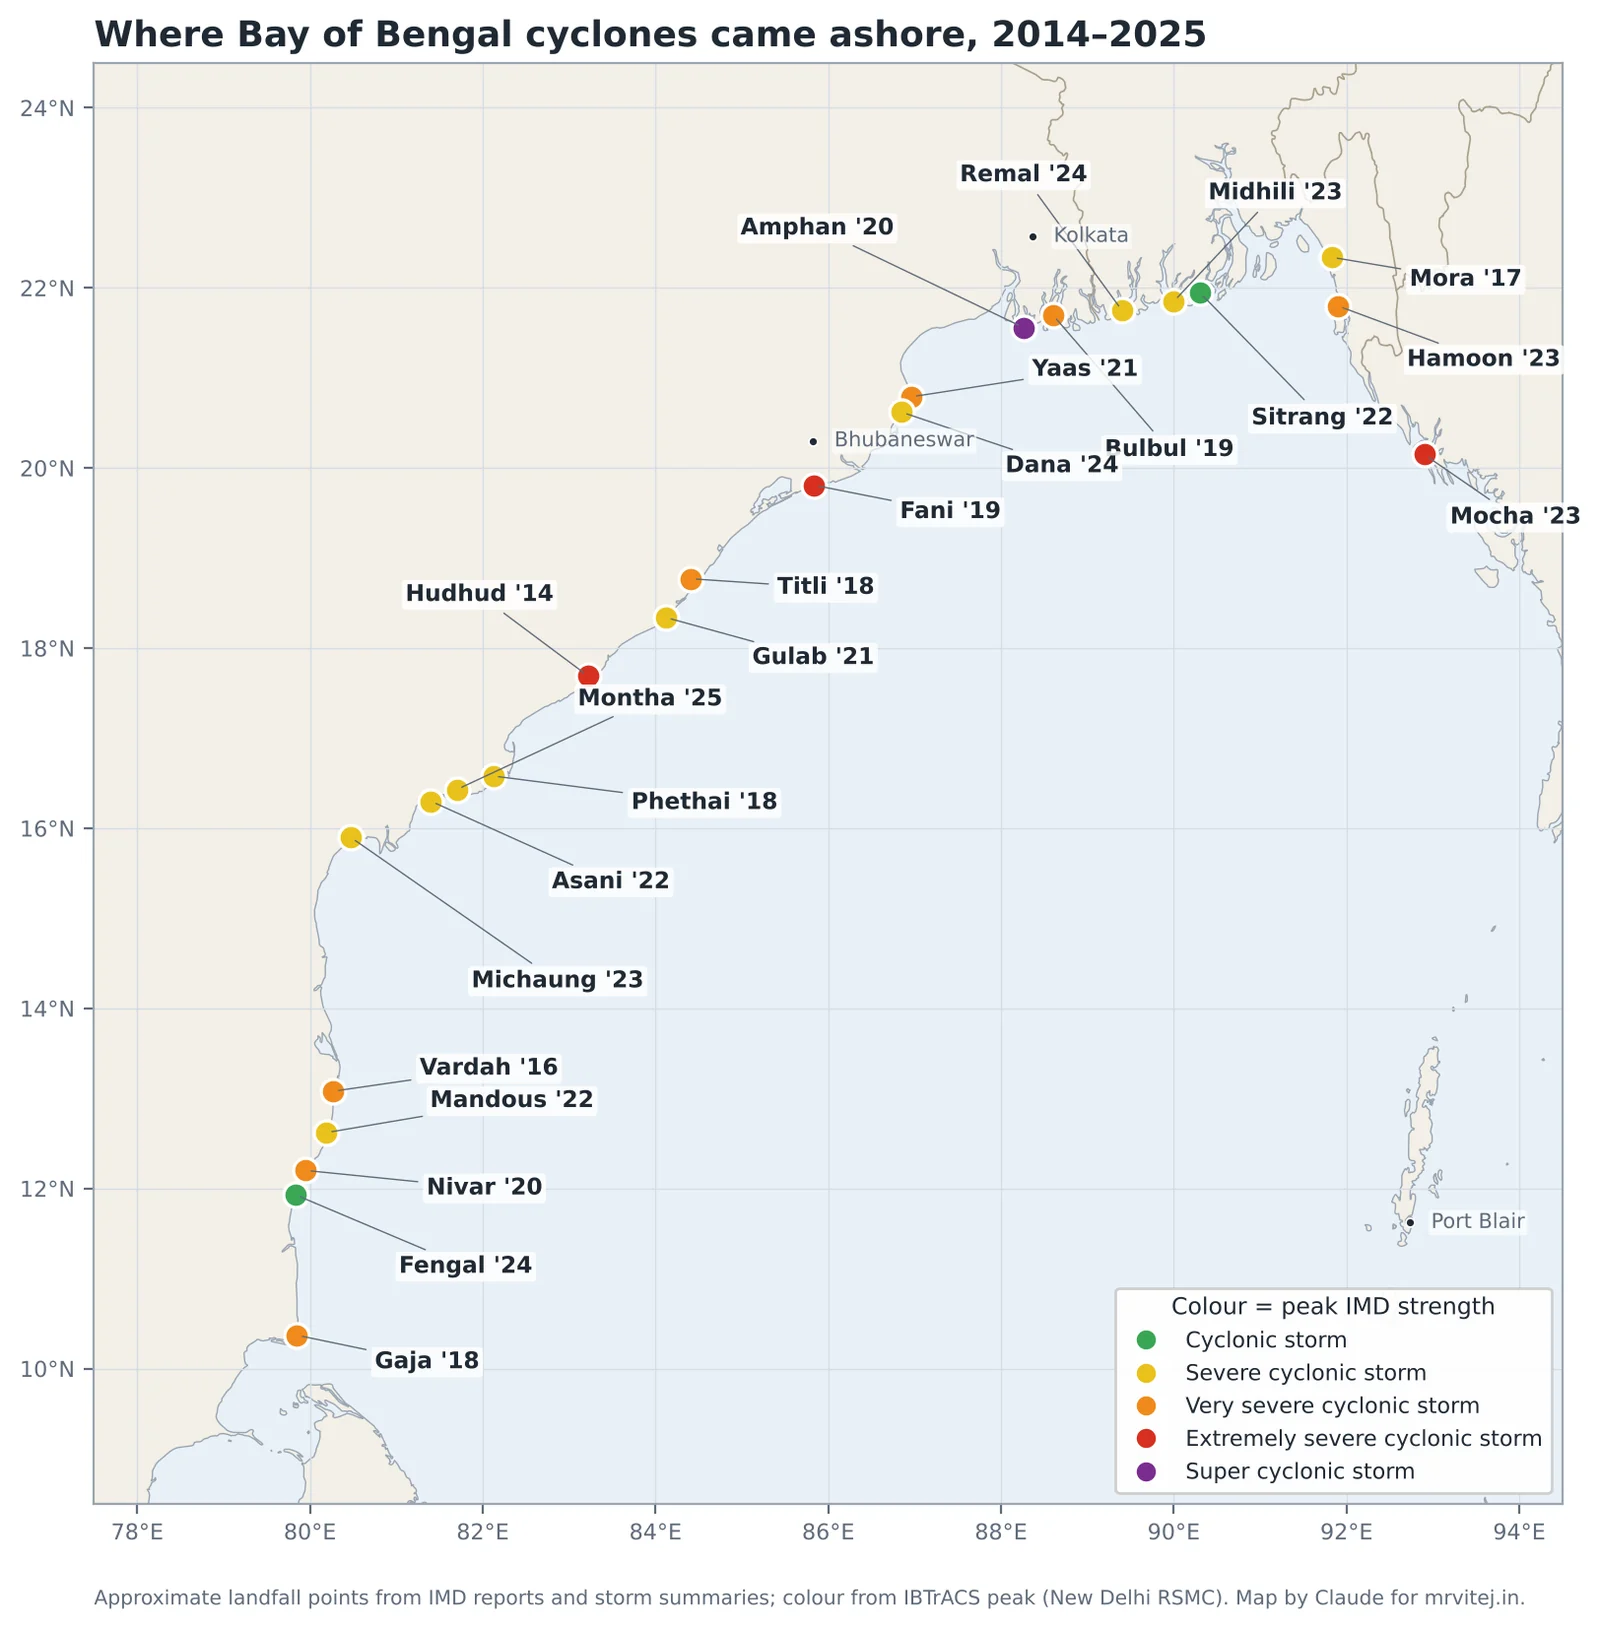
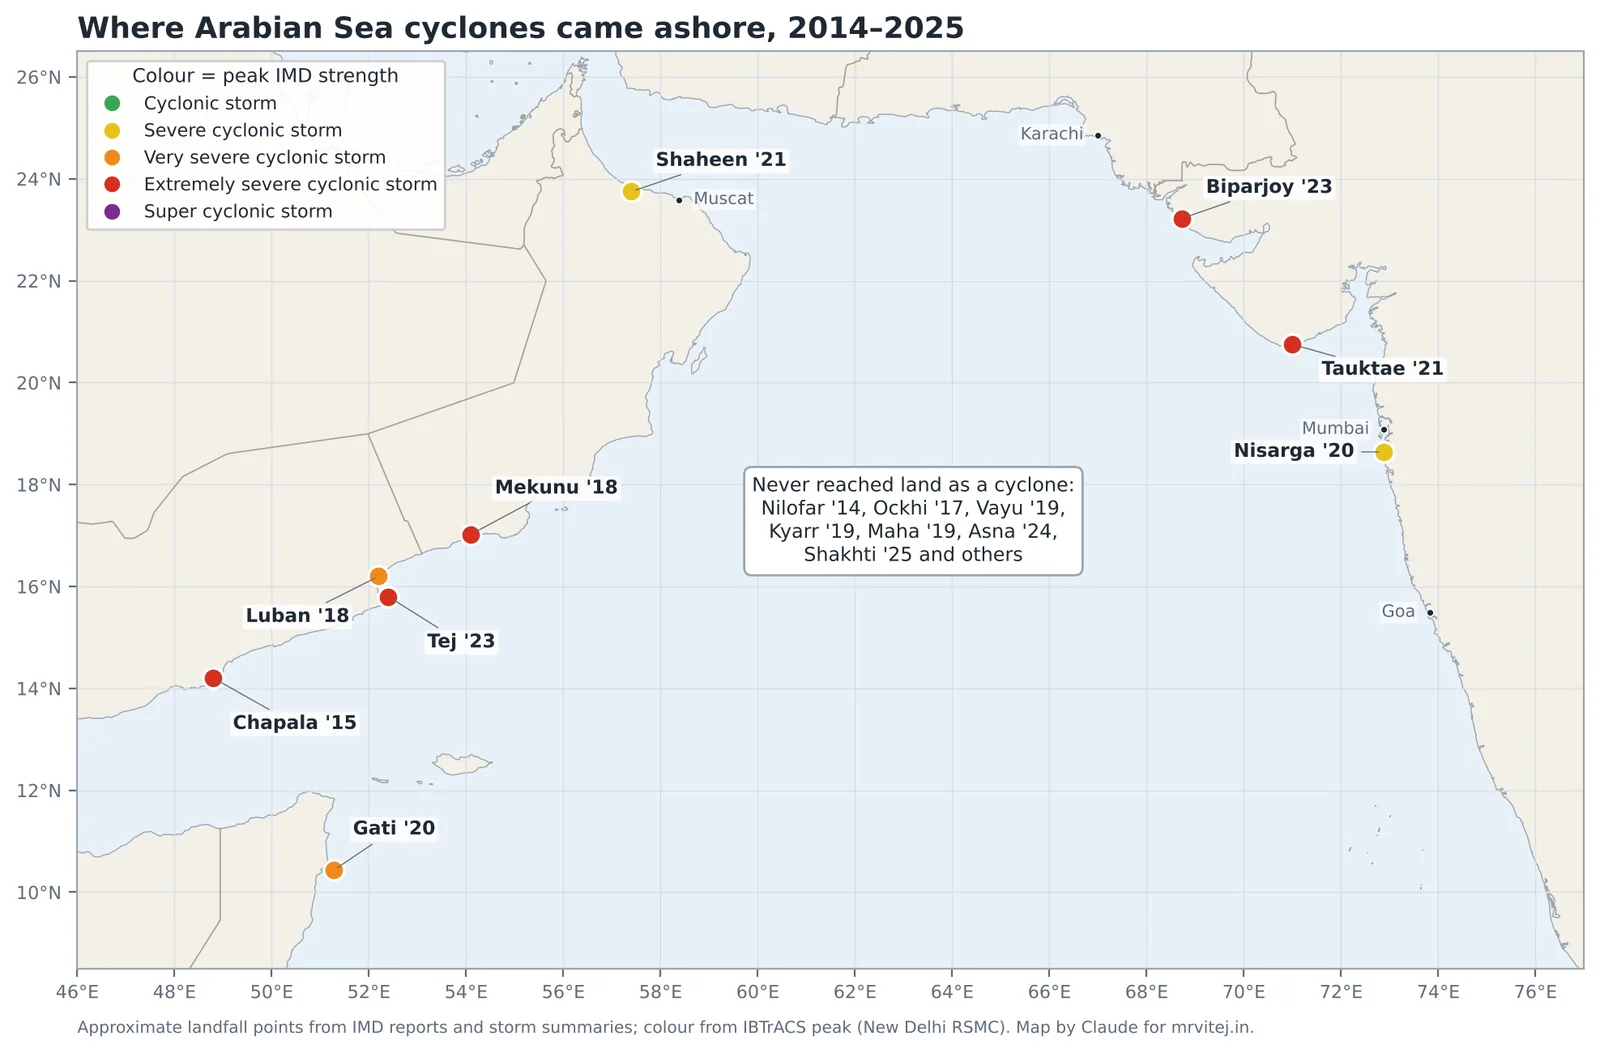
The map above is drawn directly from the international best-track archive (IBTrACS), which collects the official track of every storm from the responsible agency. A few patterns jump out:
- Bay of Bengal storms tend to move north-west or north towards the east coast. Most of them make landfall somewhere.
- Arabian Sea storms split: some go north to Gujarat or Pakistan, many go west to Oman, Yemen and Somalia, and several fizzle at sea.
- The strongest stretches, in red and purple, are over open water. Storms are usually past their peak by the time they reach land, but not always: Hudhud and Fani hit at or near peak.
Part 5: Landfall, storm surge and the four ways a cyclone kills
What “landfall” means, exactly
IMD defines landfall as the moment the centre of the cyclone crosses the coastline. For a strong storm with an eye, that is when the eye moves over land. When a bulletin says a storm “crossed the north Andhra Pradesh coast between Kalingapatnam and Visakhapatnam close to Visakhapatnam during 1130 to 1330 hours IST”, it is telling you three things: the stretch of coast, the nearest named place, and the time window during which the centre crossed.
Three points are often misunderstood.
Landfall is a process, not an instant. A storm’s eye might take an hour or two to cross the coast. Its eyewall arrives earlier and leaves later, and its outer bands may have been battering the coast for twelve hours or more before the centre arrives. People sometimes relax when the bulletin says “landfall expected tonight” and get caught by the morning rain bands. Treat the landfall time as the middle of the event, not the beginning.
A storm can do terrible damage without making landfall. If the eyewall scrapes the coast while the centre stays offshore, it is called a direct hit even without landfall. Tauktae in May 2021 never crossed the Kerala, Karnataka, Goa or Maharashtra coasts. It ran parallel to them, a hundred kilometres or so offshore, and still caused deaths and damage all the way up the west coast before making landfall in Gujarat.
The landfall category is not the peak category. Amphan was a super cyclonic storm over the central Bay but crossed the West Bengal coast as a very severe cyclonic storm. News headlines often quote the peak. What matters on the ground is the strength at the coast and the size of the wind field.
The right-front quadrant
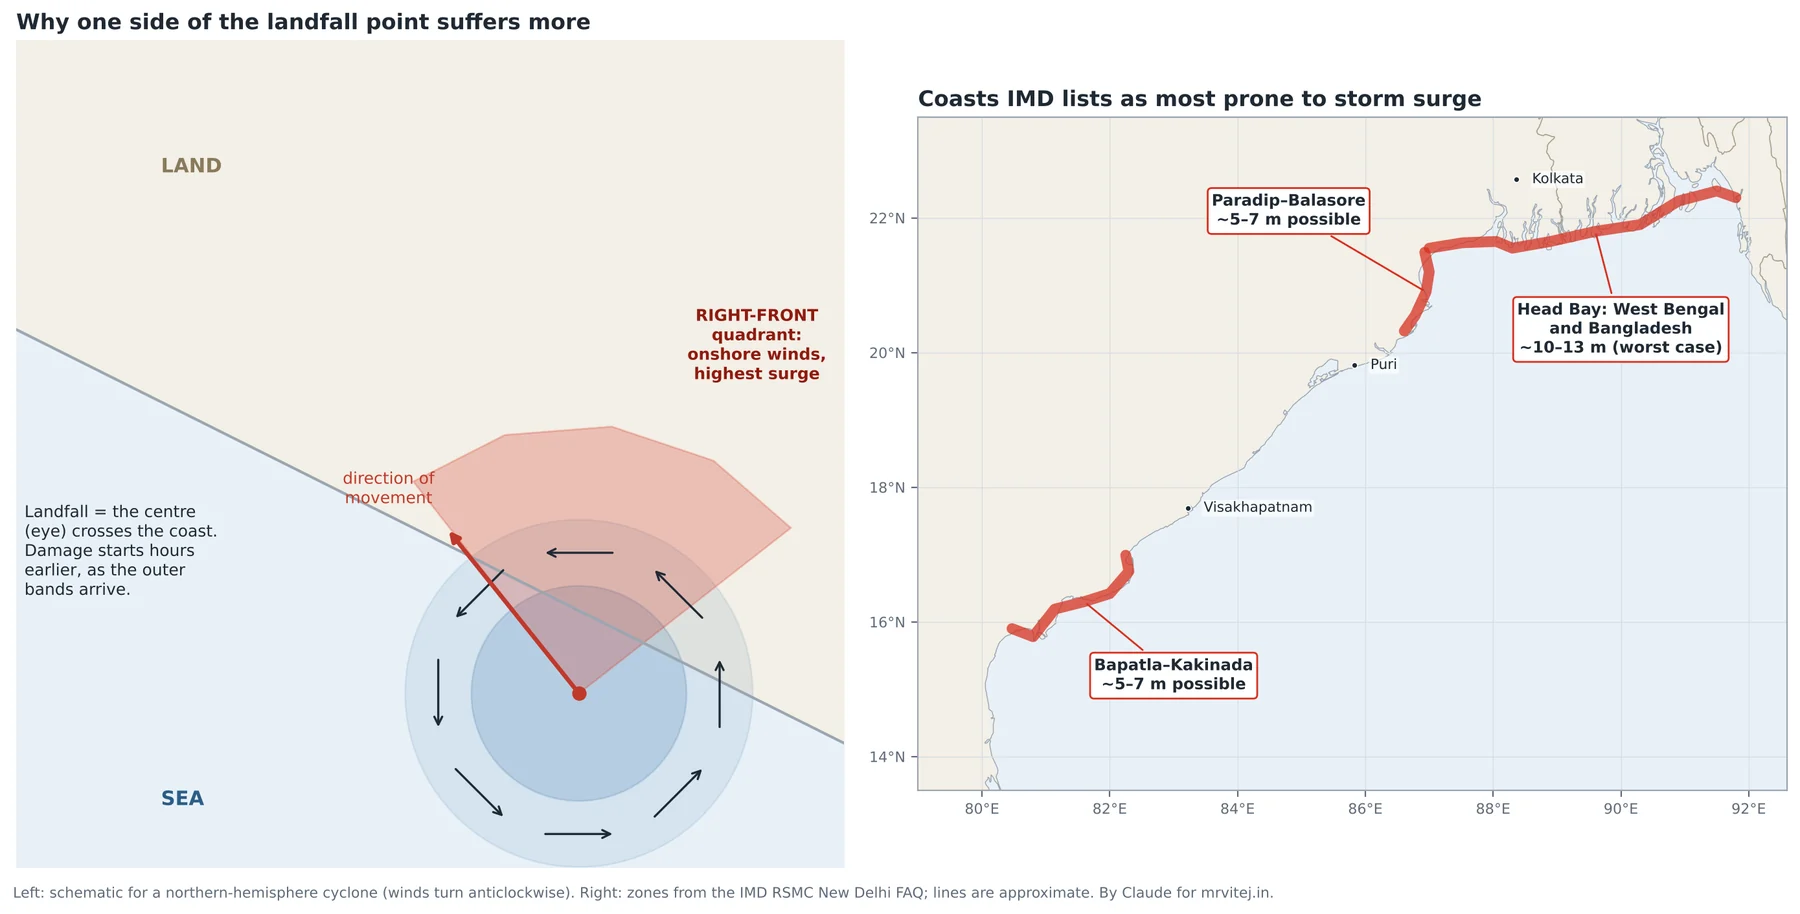
A cyclone’s winds are not symmetrical. In the northern hemisphere the winds turn anticlockwise, and the whole storm is also moving. On the right side of the track (looking in the direction of motion) the storm’s spin and its forward motion add together. On the left side they partly cancel. The right-front quadrant therefore has the strongest winds, and because those winds blow from the sea towards the land, it also piles up the most water.
For a storm moving north-west into the Andhra coast, the right side is the north-east, so towns north of the landfall point usually get the worst surge and wind. For a storm moving north into Odisha or West Bengal, it is the east side. This is why IMD bulletins name a landfall point and then warn of surge “to the right of the landfall point”.
Real world: Hudhud moved north-west and crossed the coast at Visakhapatnam itself, so the city was inside the eyewall and close to the storm’s strong right-front side at the same time. Its waterfront, from RK Beach to the fishing harbour, took the full force of wind and waves, and a 1.4-metre surge ate into the beaches.
Storm surge: the biggest killer
Storm surge is the abnormal rise of the sea above the normal tide level, caused mainly by the cyclone’s winds pushing water towards the shore and, to a smaller extent, by the low pressure at the centre lifting the sea surface (each hPa of pressure drop raises the sea by about one centimetre). On a deep coast the water can escape downwards. On a shallow, gently sloping shelf it cannot, so it piles up and runs inland.
Storm tide is the surge plus the normal astronomical tide. A one-metre surge at low tide may barely cross the beach. The same surge at high tide during a full or new moon can flood villages. The interaction is not simple addition, but timing against the tide matters enormously.
IMD lists the most surge-prone coasts of India as the head of the Bay in West Bengal and adjoining Bangladesh (where worst-case surges of over 10 metres are possible), the Odisha coast from Paradip to Balasore, and the Andhra Pradesh coast between Bapatla and Kakinada (both 5 to 7 metres in the worst case). Most of the deaths in the great historical cyclones of the Bay, including 1970, 1977 Andhra, 1991 Bangladesh and 1999 Odisha, came from the sea.
Real world: Cyclone Yaas crossed the Odisha coast north of Dhamra on the morning of 26 May 2021, the day of a full moon, when tides were near their highest of the month. It was “only” a very severe cyclonic storm, but storm tides flooded more than a thousand villages across the Sundarbans and coastal West Bengal, well away from the landfall point and on the storm’s right flank.
Storm surge forecasts have improved enormously. IMD now runs dedicated surge models for every threatening storm and publishes surge heights for each coastal district. Evacuation zones in Odisha and Andhra Pradesh are drawn from those maps.
The four killers
When the cyclone category is high, attention fixes on the wind. Over the last twelve years, Indian cyclone deaths have come from four hazards, roughly in this order:
- Water from the sky. Extreme rain causes flash floods, river floods, urban flooding and landslides. Gaja, Titli, Michaung, Fengal and Montha did most of their harm this way. Rain depends on how much moisture the storm carries and how slowly it moves, not on its category. A slow cyclonic storm can drop more rain than a fast extremely severe one.
- Water from the sea. Storm surge and storm tide on low coasts.
- Wind. Falling trees, flying roofs and collapsing walls kill people outdoors and in weak houses. Most Indian cyclone wind deaths now happen during or just after the storm, when people go out to check damage or clear roads.
- The aftermath. Electrocution from fallen power lines, contaminated water, snakebites, and injuries during clean-up.
The success of Indian disaster management since 1999 shows up clearly in these numbers. Fani in 2019 was as strong at landfall as several historical storms that killed thousands. Odisha moved more than 1.2 million people to safety in the days before landfall, and the death toll in the state was in the dozens, not the thousands. That change, from thousands of deaths to tens, is one of the great public-safety stories of the past thirty years, and it rests on accurate forecasts, clear warnings, cyclone shelters and practised evacuation.
Part 6: How India watches a cyclone
Before satellites, a cyclone at sea was known only from ship reports and a falling barometer on the coast. The 1970s Andhra and 1990s Odisha disasters happened partly because warnings came late or did not reach people. Today a storm in the Bay of Bengal is watched every few minutes from space, scanned by radar as it approaches, sampled by buoys and ships, and run through supercomputer models several times a day.
Satellites: the eye in the sky
India’s weather satellites sit in geostationary orbit, about 36,000 km above the equator, where they keep pace with the Earth’s rotation and stare at the same half of the globe all the time. INSAT-3D (launched 2013) and INSAT-3DR (2016) were joined in February 2024 by INSAT-3DS. Their imagers take a full picture of the Indian Ocean region every half hour, with faster scans in rapid mode, in several wavelengths.
Visible images show clouds as we would see them, but only in daylight. Infrared images measure the temperature of the cloud tops, day and night. Tall thunderstorms reach 15 km or more, where the air is around −70 to −80 °C, so the coldest, brightest-white areas on an infrared image are the most violent storms. A clear warm spot in the middle surrounded by a ring of very cold cloud is the signature of a well-formed eye.
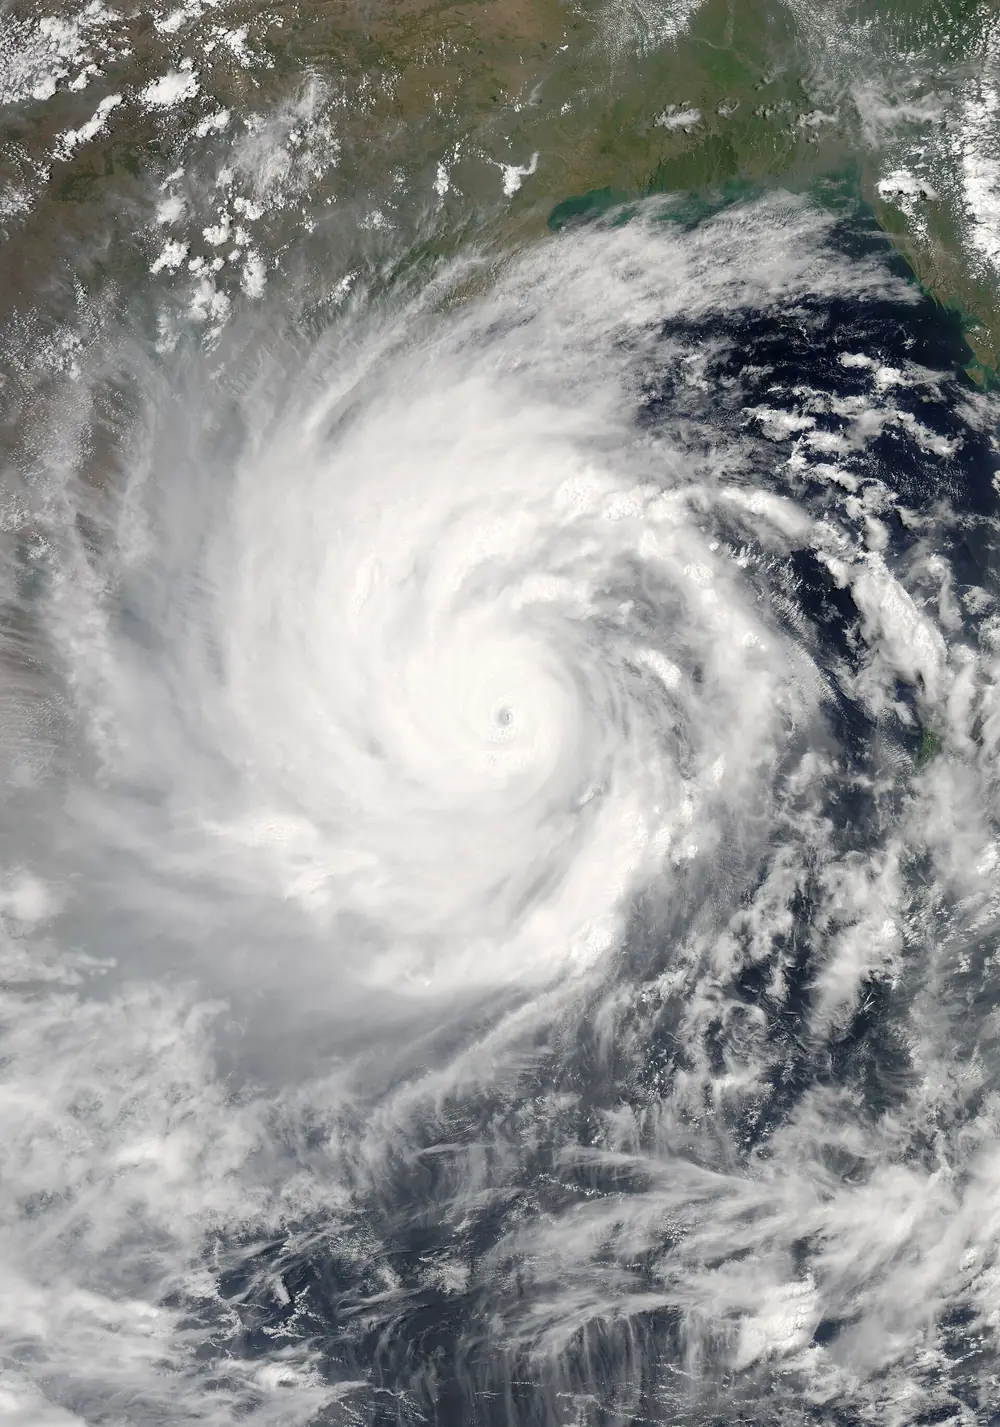

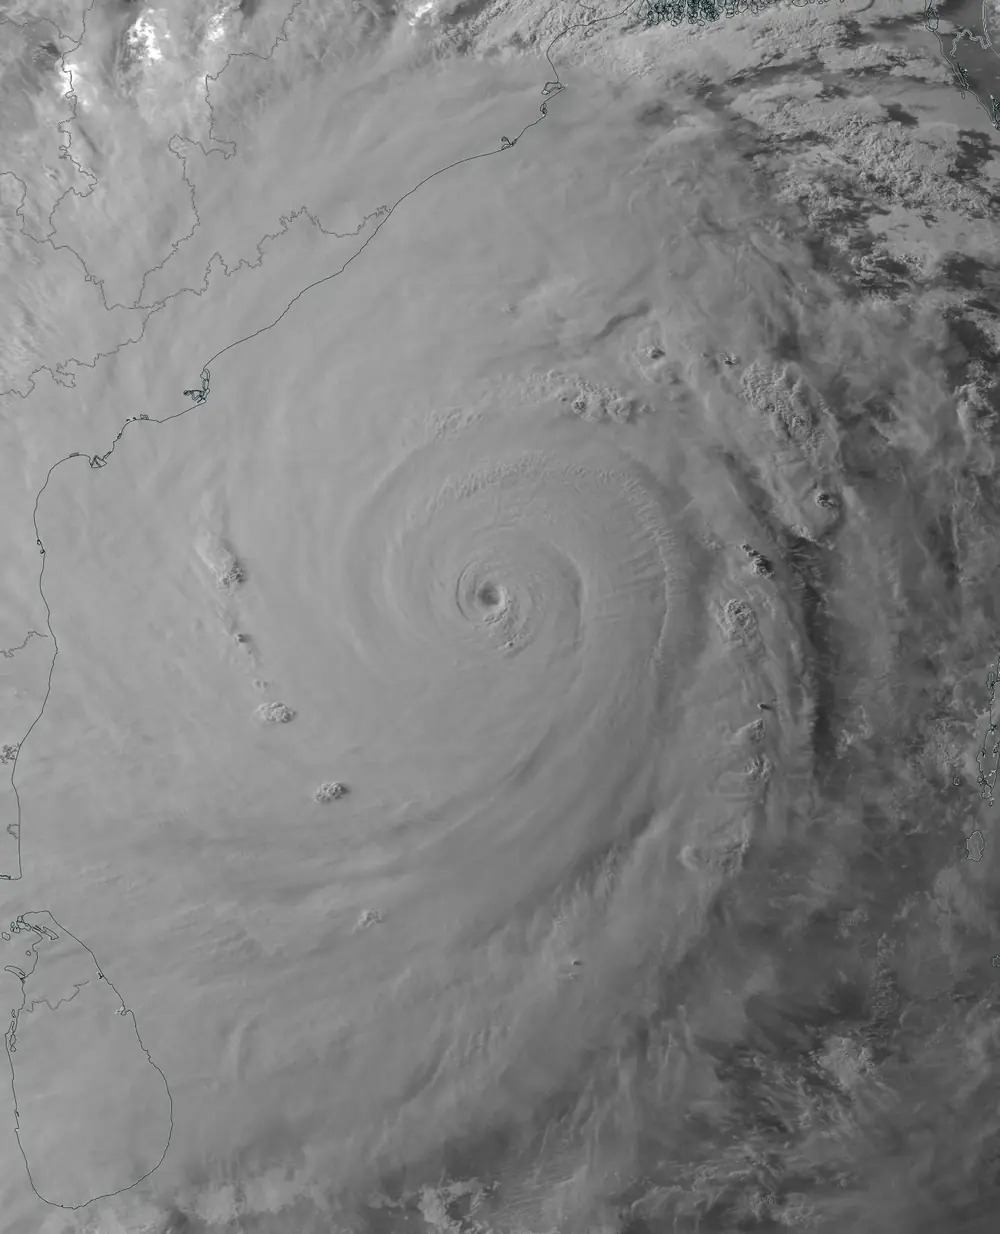

Forecasters estimate a storm’s strength from satellite pictures using the Dvorak technique, a method developed by the American meteorologist Vernon Dvorak in the 1970s. It matches the cloud pattern (curved band, central dense overcast, eye) and the temperature contrast between the eye and the eyewall to a number on a scale from T1.0 to T8.0. IMD maps those numbers to its categories: T1.5 is a depression, T2.5 a cyclonic storm, T4.0 a very severe cyclonic storm, and T6.5 or more a super cyclonic storm. When you see “intensity T3.5” in a bulletin, that is the Dvorak number.
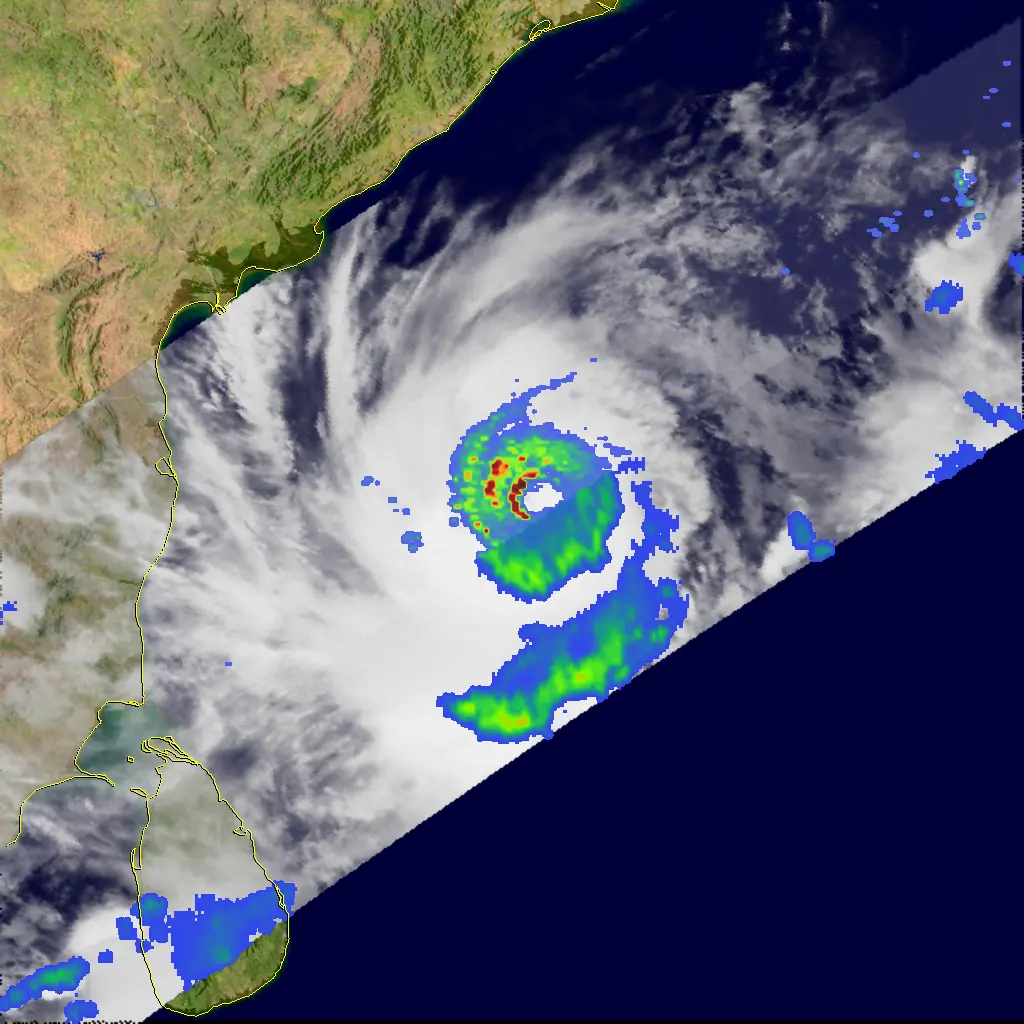
Satellites now carry other instruments too. Microwave sensors see through the cirrus shield to the rain bands and eyewall underneath, which reveals an eye before it shows on infrared. Scatterometers, such as the one on India’s Oceansat-3, bounce radar pulses off the sea surface and measure the small waves that the wind raises, giving wind speed and direction over the open ocean. And satellites with a precipitation radar in orbit, like the joint US-Japan TRMM mission and its successor GPM, can slice through a storm and map its rain in three dimensions.

Doppler weather radar: the close-up
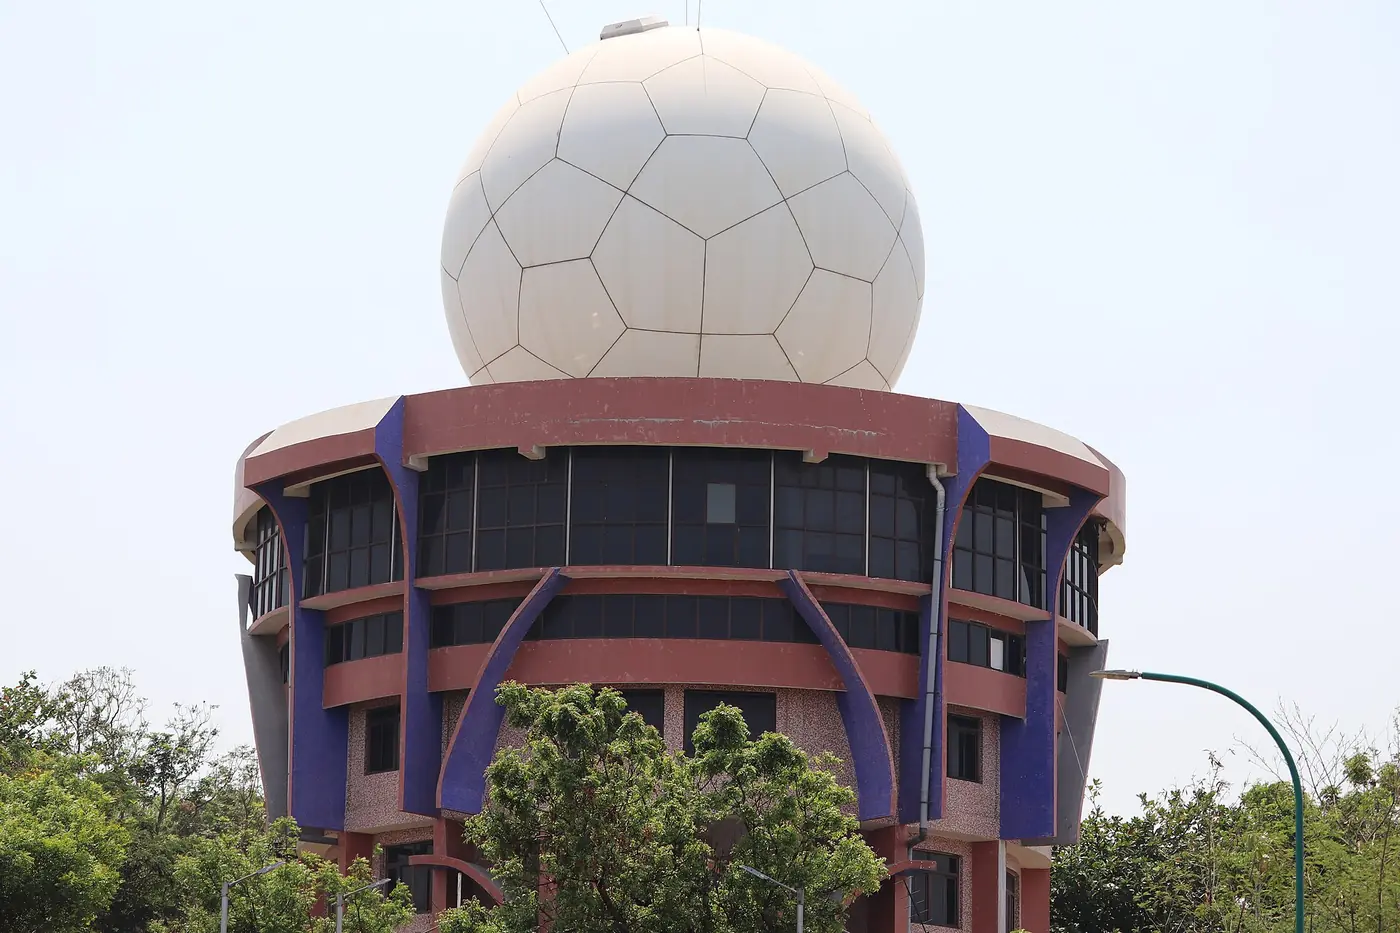
Once a storm comes within a few hundred kilometres of the coast, ground-based Doppler weather radars (DWR) take over the detailed watching. A DWR spins an antenna under a protective dome (the white ball you see on Kailasagiri in Visakhapatnam), sends out pulses of microwaves, and listens for echoes from raindrops.

A radar measures two different things, and it helps to know both.
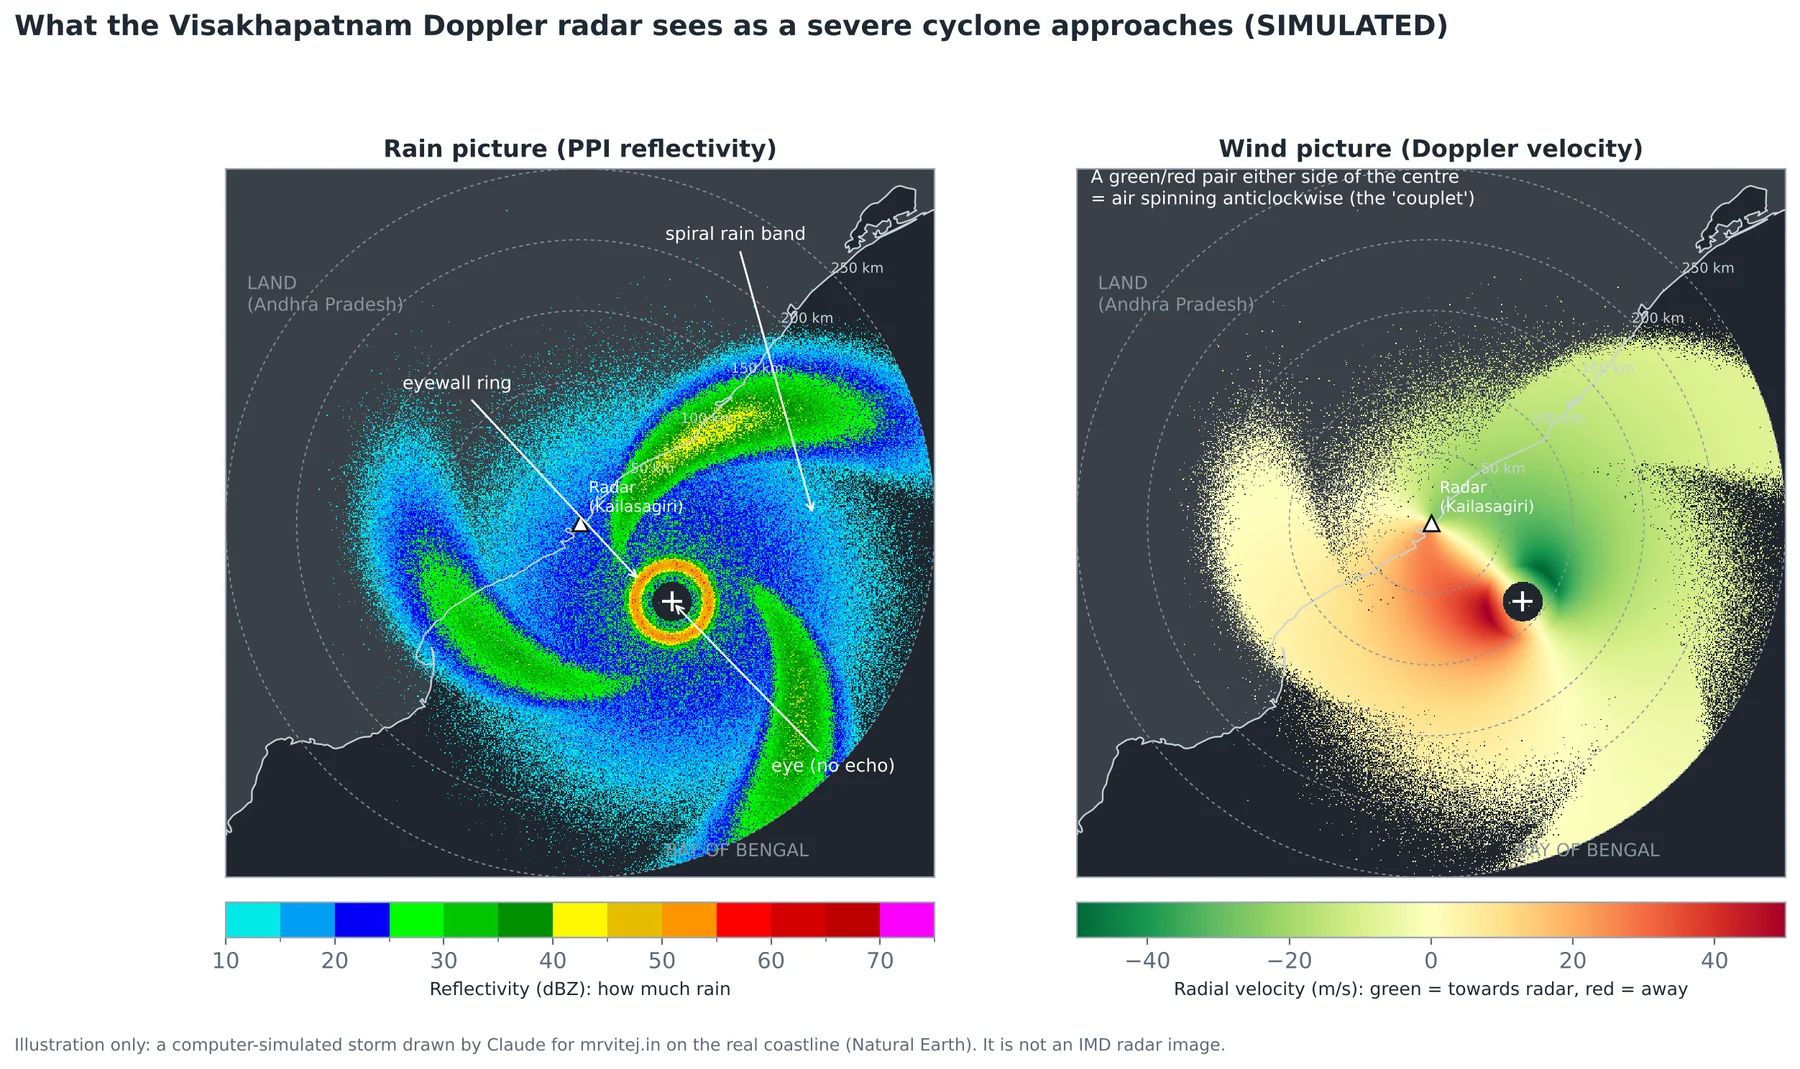
Reflectivity, measured in dBZ, is how strongly the rain reflects the pulse. More and bigger drops give a higher number. Light rain is around 20 dBZ, heavy rain 40 to 50, and the eyewall of a strong cyclone 50 dBZ or more. A reflectivity picture shows you where the rain is: the eye as an empty hole, the eyewall as a bright ring, the rain bands as long spirals.
Radial velocity uses the Doppler effect, the same change in pitch you hear when an ambulance passes. Raindrops moving towards the radar return the pulse at a slightly higher frequency, drops moving away at a slightly lower one. The radar converts this into speed towards (usually shown green) or away from (red) the radar. Because a cyclone spins, one side of it is always moving towards the radar and the other side away, so the storm appears as a green and red pair either side of the centre. The strength of that pair tells forecasters the wind speed in the eyewall, and the point midway between them pins down the centre to within a few kilometres.
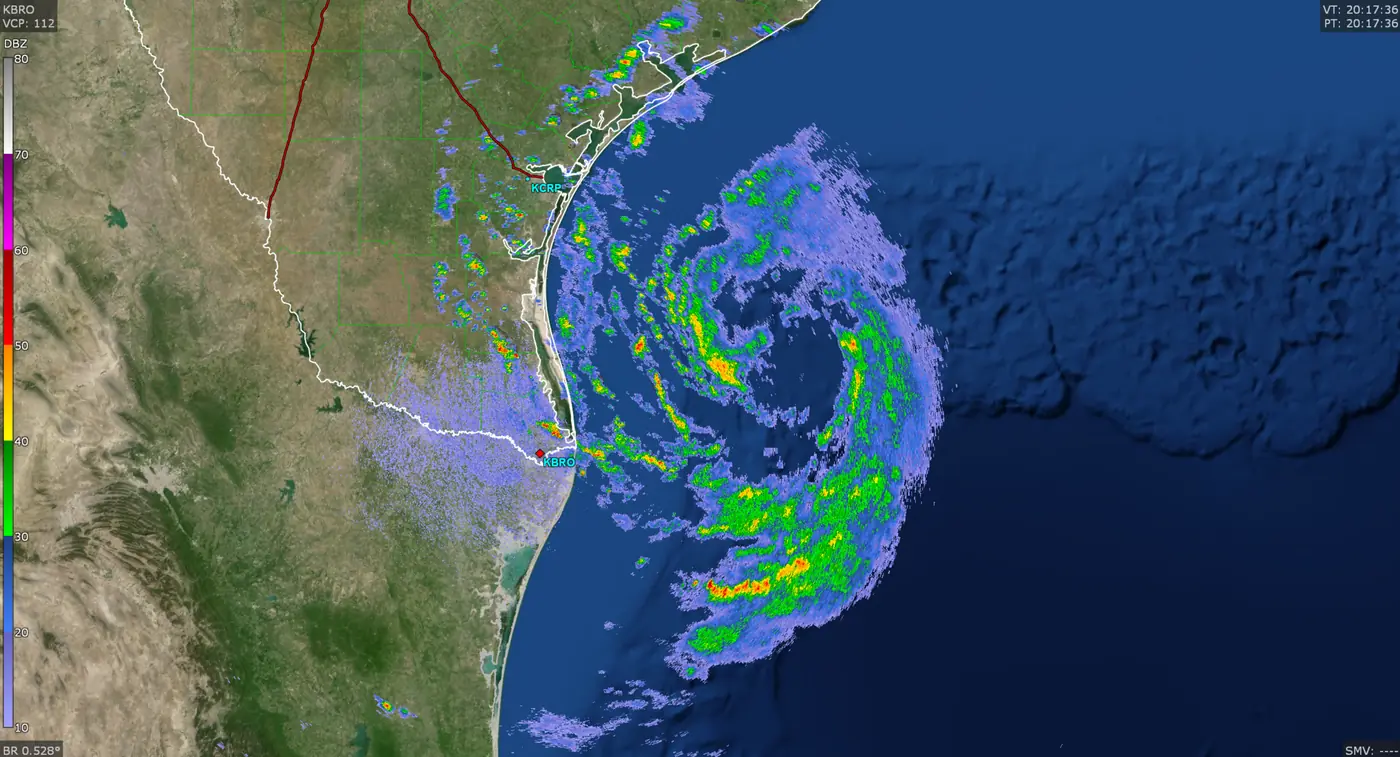
Here is a real radar picture of the same kind, from the United States, where radar images are public domain. It shows Beryl on 7 July 2024, the day before it struck Texas as a hurricane. At that moment it was a tropical storm rebuilding its core, but the ring around the centre and the curling rain bands are exactly what Indian radars show as a Bay of Bengal storm closes in.

India’s radar network has grown fast. The Ministry of Earth Sciences listed 39 Doppler weather radars in August 2024, including a chain along both coasts: Kolkata, Paradip, Gopalpur, Visakhapatnam, Machilipatnam, Sriharikota, Chennai, Karaikal, Kochi, Thiruvananthapuram, Goa, Mumbai and Bhuj. Under Mission Mausam, launched in early 2025, more radars are being added.
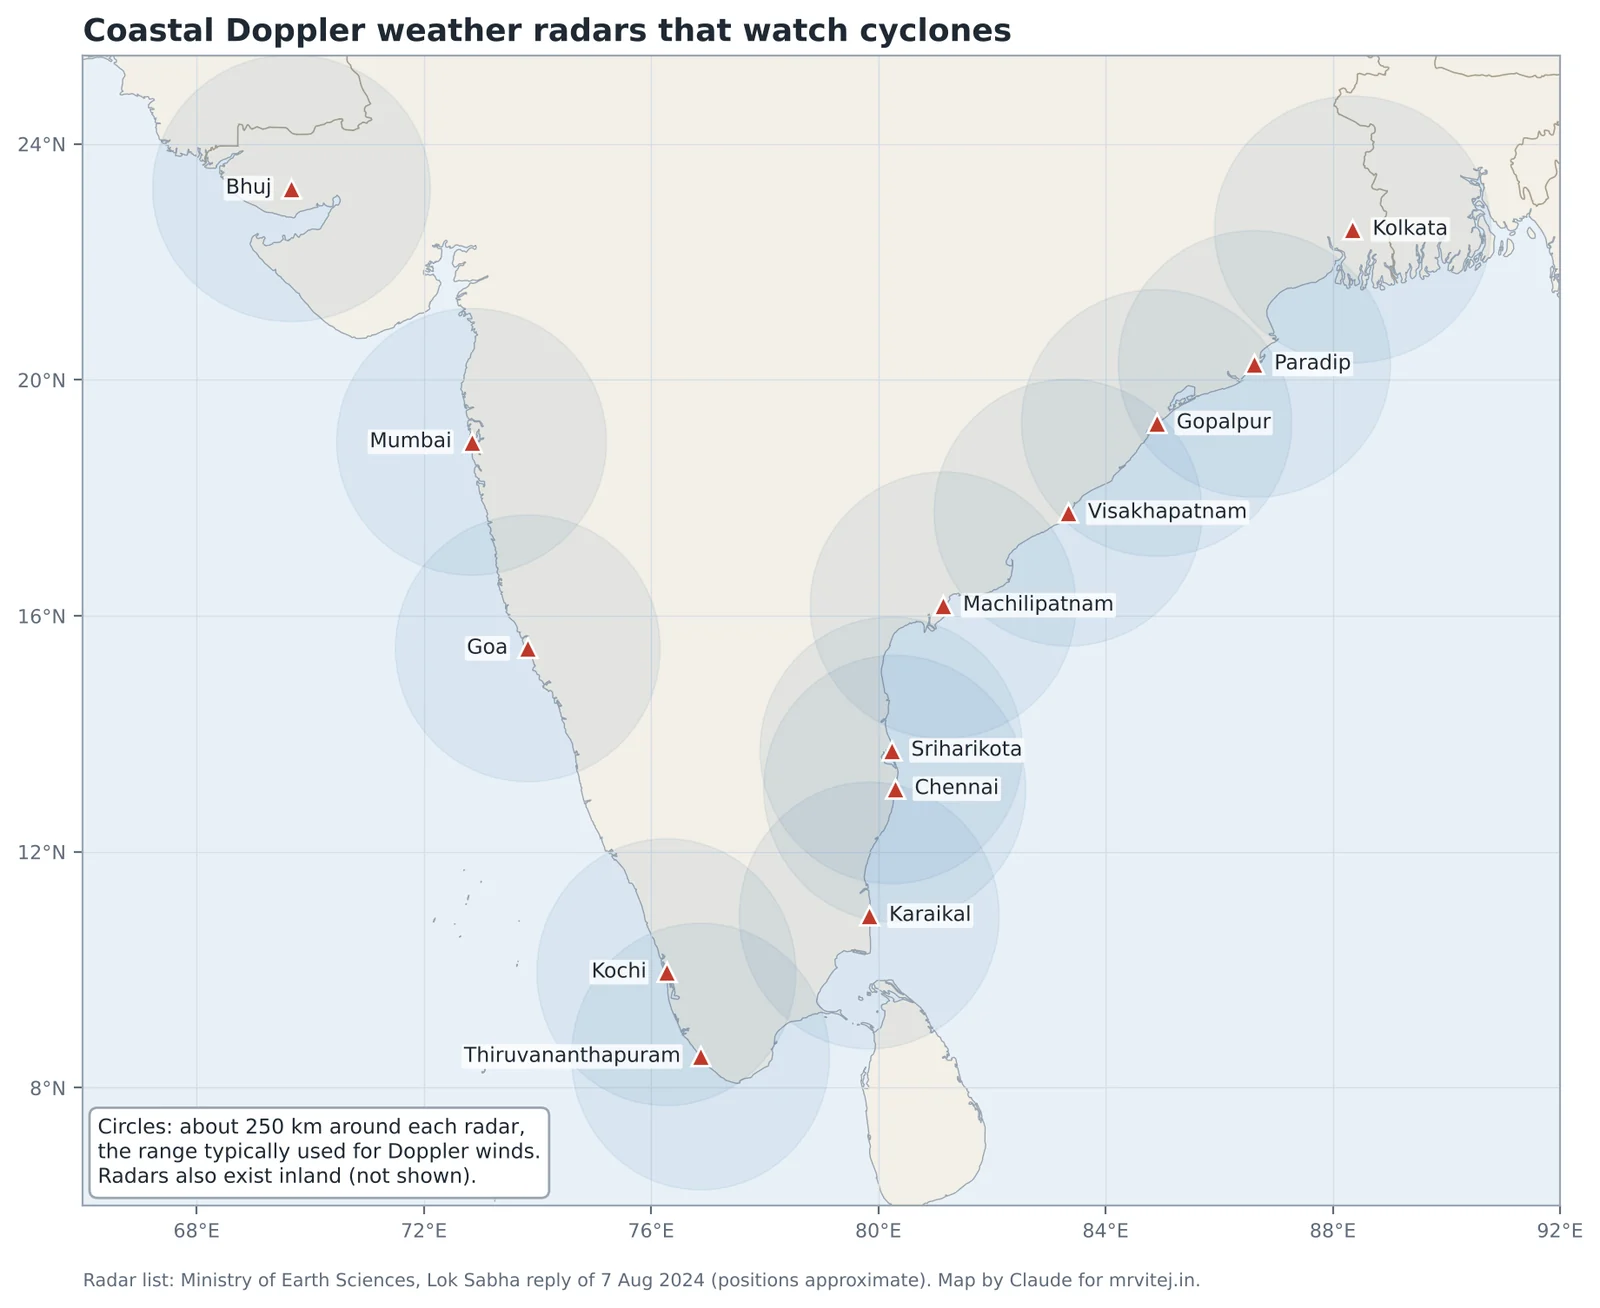
Real world: in the last hours before a landfall, IMD’s bulletins switch from three-hourly to hourly updates, giving the centre’s position, its distance from named towns and the expected crossing time. When a storm is within radar range, as Fani was off Gopalpur and Paradip and Michaung was off Chennai and Machilipatnam, those positions come largely from the coastal radars, which can follow the eye scan by scan.
Buoys, ships and weather stations
Satellites and radars see the storm from above. Instruments at the surface measure what people will actually feel. Moored ocean buoys in the Bay of Bengal and the Arabian Sea, run by Indian ocean institutes, report wind, pressure, waves and sea temperature at regular intervals, and drifting Argo floats measure the temperature of the water below the surface, which tells forecasters how much fuel a storm will find. Ships at sea send weather observations. Along the coast, automatic weather stations and tide gauges measure the wind, rain and sea level as the storm arrives.
Computer models and the forecast cone
Forecasts beyond a few hours come from numerical weather prediction (NWP) models: programs that divide the atmosphere and ocean into a grid, apply the laws of physics, and step forward in time on supercomputers. IMD and the National Centre for Medium Range Weather Forecasting (NCMRWF) run their own global and regional models and also use the European, American, Japanese and British models. For a threatening storm, forecasters look at many models and at ensembles, the same model run dozens of times with slightly different starting conditions. Where the runs agree, confidence is high. Where they spread out, the forecast is uncertain.
IMD publishes track forecasts as a line with a cone of uncertainty around it. The cone shows where the centre is likely to be, given past errors. It does not show how big the storm is. Damage happens well outside the cone, because a cyclone’s rain and wind extend hundreds of kilometres from the centre.
How good are the forecasts?
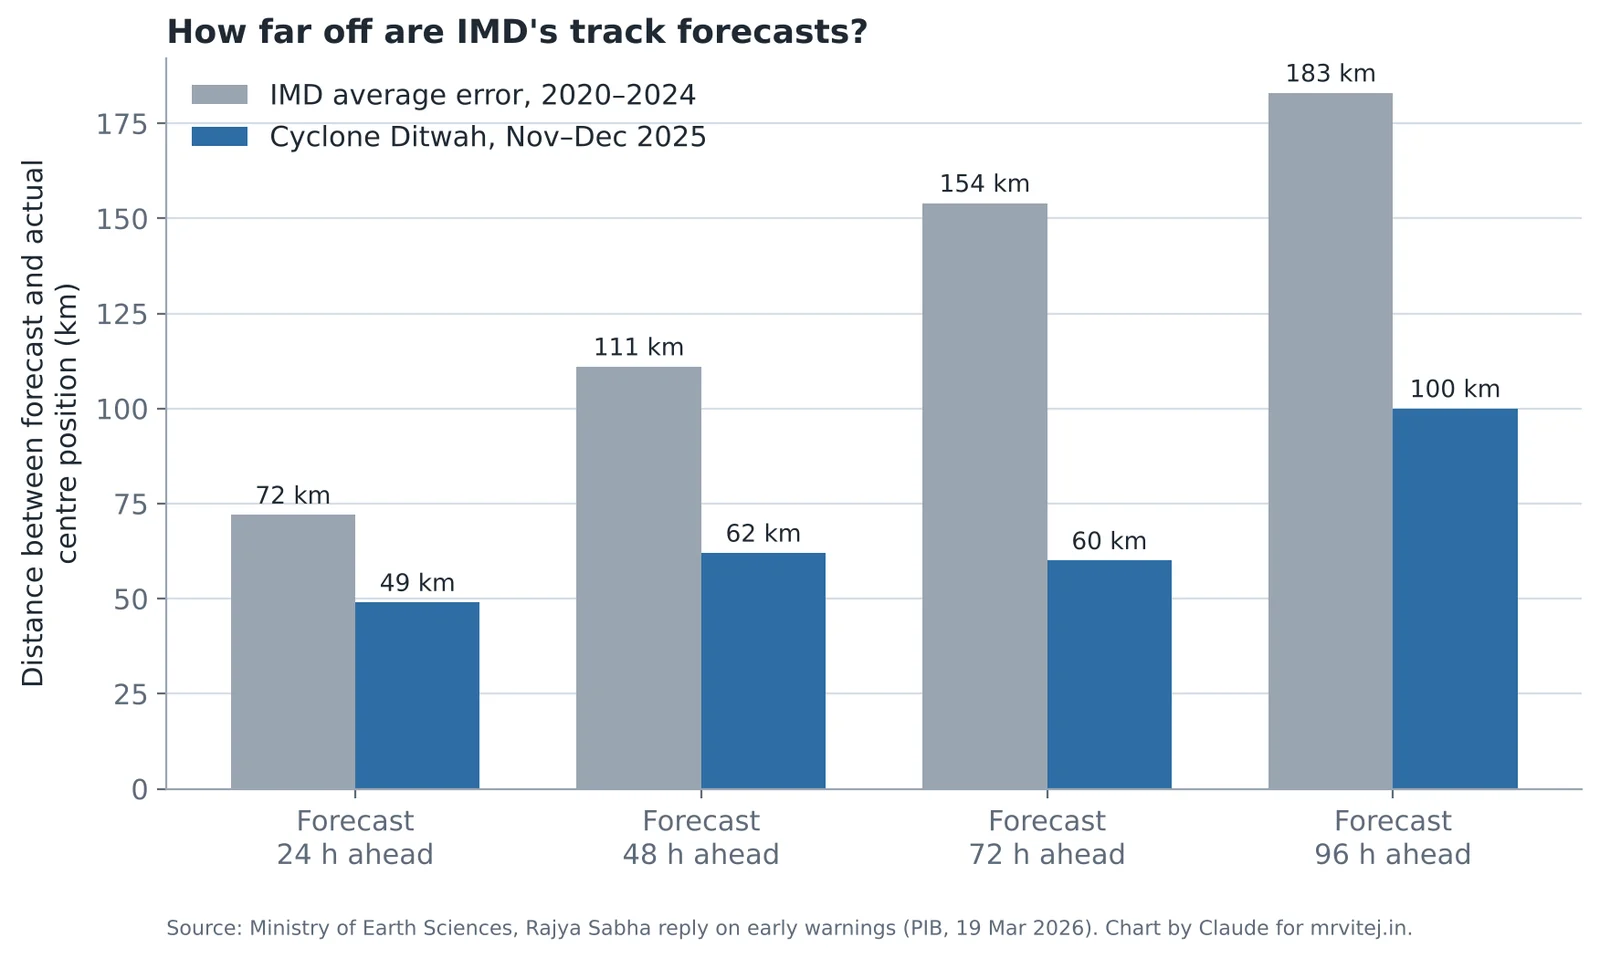
Very good, and getting better. According to the Ministry of Earth Sciences, IMD’s average error in forecasting where a cyclone’s centre will be was about 72 km for 24 hours ahead and about 154 km for three days ahead over 2020 to 2024. For Ditwah in 2025, the errors were 49 km at 24 hours and 60 km at 72 hours. The ministry reported that track forecasts for 2021 to 2025 were 20 to 25 per cent more accurate than for 2016 to 2020, and that landfall and intensity forecasts improved by 35 to 45 per cent.
To put 72 km in perspective, that is roughly the distance from Visakhapatnam to Vizianagaram. A day ahead, IMD can usually tell you which district a storm will cross. Three days ahead, it can tell you which stretch of coast. That is enough to evacuate.
Intensity is harder than track. Rapid intensification, as we saw, can still surprise forecasters, and rain totals are hardest of all, because they depend on how slowly the storm moves and exactly where its bands set up.
Part 7: Warnings, port signals and the language of a bulletin
The four-stage warning
IMD issues cyclone warnings for the Indian coast in four stages, each tied to how far away the bad weather is in time.
| Stage | When it is issued | Colour | Who it is mainly for | What it means for you |
|---|---|---|---|---|
| Pre-cyclone watch | About 72 hours ahead | (not colour-coded) | Senior officials, state governments | A cyclone is likely to form and may affect the coast. Plans start. |
| Cyclone alert | At least 48 hours before bad weather starts on the coast | Yellow | Fishermen, public, media, disaster managers | Get ready. Fishermen return. Check your supplies and your evacuation route. |
| Cyclone warning | At least 24 hours before bad weather starts; updated every 3 hours | Orange | Everyone in the affected districts | Act. Evacuation of low-lying and kutcha-house areas begins. Expect landfall details by district. |
| Post-landfall outlook | At least 12 hours before landfall | Red | Districts inland along the expected path | The storm will cross the coast and keep moving inland. Inland districts prepare for wind and floods. |
Notice that the clock runs from when bad weather starts, not from landfall. A cyclone warning 24 hours before the rain bands arrive might be 36 hours before landfall.
Separately, IMD uses a colour scheme for district weather warnings that you will see on maps and news: green (no action), yellow (be aware), orange (be prepared) and red (take action). During a cyclone, coastal districts often go red for rain and wind at the same time as the cyclone warning stage.
Fishermen warnings and the sea state
Fishermen are warned first, often days before anything happens on land, because the sea becomes dangerous long before the storm arrives. Bulletins describe the sea with standard words: rough (waves 2.5 to 4 m), very rough (4 to 6 m), high (6 to 9 m), very high (9 to 14 m) and phenomenal (over 14 m). When you read “sea condition very high to phenomenal over the west-central Bay of Bengal”, it means no boat should be anywhere near it.
The lesson of Ockhi in 2017 still shapes this system. Ockhi formed close to the southern tip of India and strengthened quickly, and many fishermen from Kerala and Tamil Nadu were already far out at sea on multi-day trips when the warnings came. Hundreds died or went missing. Since then, warnings for fishermen go out earlier and more widely, including through satellite-linked devices on boats and through coastal radio.
Port warning signals
Indian ports hoist warning signals (flags by day, lights by night) on a numbered scale from I to XI. You will see them in news reports as “port signal number 7 hoisted at Visakhapatnam”.
| Signal | Meaning in short |
|---|---|
| I, II | Distant cautionary or warning: a storm far at sea, port not yet threatened |
| III, IV | Local cautionary or warning: squally weather or a storm likely to affect the port |
| V | Danger: storm to cross the coast with the port on the left of its track |
| VI | Danger: storm to cross with the port on the right of its track |
| VII | Danger: storm to cross over or close to the port |
| VIII, IX, X | Great danger: a severe storm, with the port to the left (VIII), right (IX) or over/close to the port (X) |
| XI | Communication with the cyclone warning centre has failed; local danger likely |
Signal VI is often more serious than V for the same storm, because the port is on the stronger, right-hand side. Signal X is the highest real-weather warning.
Reading an IMD cyclone bulletin
IMD bulletins follow a fixed pattern. Here is an example written in the style of a real bulletin, for an imaginary storm, with a translation of each line.
“The Severe Cyclonic Storm over westcentral Bay of Bengal moved west-northwestwards with a speed of 12 kmph during past 6 hours and lay centred at 0830 hours IST near latitude 16.5°N and longitude 85.0°E, about 220 km east-southeast of Visakhapatnam and 300 km south-southeast of Gopalpur. It is very likely to intensify further into a Very Severe Cyclonic Storm during next 12 hours and cross north Andhra Pradesh coast between Kalingapatnam and Visakhapatnam close to Visakhapatnam during evening of tomorrow as a Very Severe Cyclonic Storm with maximum sustained wind speed of 120-130 kmph gusting to 145 kmph.”
- Severe Cyclonic Storm: its current class. Winds 89 to 117 km/h.
- moved west-northwestwards with a speed of 12 kmph: its direction and how fast the centre is moving, not the wind speed.
- lay centred at … latitude … longitude: the analysed position of the centre at the time stated.
- about 220 km east-southeast of Visakhapatnam: Visakhapatnam is 220 km west-north-west of the storm, so this is the distance still to cover.
- cross … between Kalingapatnam and Visakhapatnam close to Visakhapatnam: the forecast landfall stretch, with the most likely point.
- maximum sustained wind speed of 120-130 kmph gusting to 145 kmph: the forecast strength at landfall, with the sustained range and peak gusts.
Later bulletins add tables of storm-surge heights by district, rainfall forecasts with words such as “heavy” (64.5 to 115.5 mm in a day), “very heavy” (115.6 to 204.4 mm) and “extremely heavy” (204.5 mm or more), and specific advice for each sector: fisheries, agriculture, power, transport.
Getting the warning to everyone
A warning only saves lives if it reaches people who can act on it. Warnings now go out through every channel at once: IMD’s website, the Mausam app and social media; All India Radio and Doordarshan; state disaster management authorities; district collectors; police and coastal village volunteers with loudspeakers; and location-based mobile alerts through the national SACHET system, which uses the international Common Alerting Protocol to push SMS and cell-broadcast messages to every phone in an affected area.
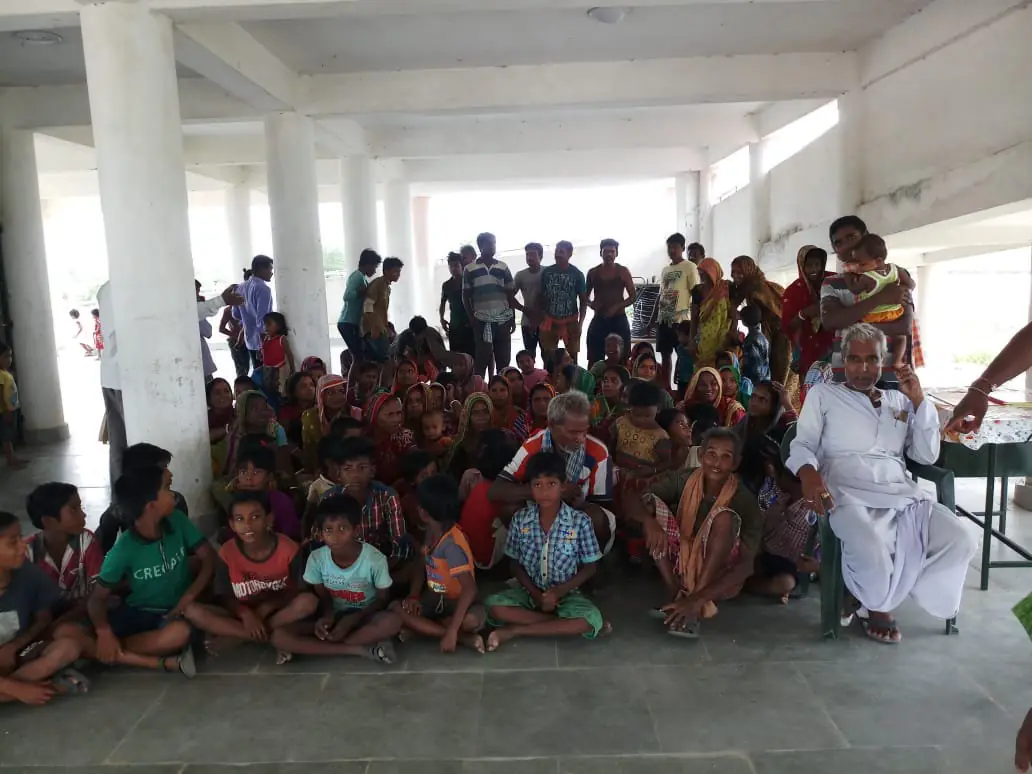

Odisha’s approach, built after 1999, has become a model studied around the world. The state built hundreds of multipurpose cyclone shelters, which serve as schools or community halls in normal times. Before every major storm it sets a zero-casualty target and moves people from kutcha houses and low-lying coastal villages into those shelters, with food, water, medicine and separate spaces for women and the elderly. The Ministry of Earth Sciences reported zero deaths during Cyclone Biparjoy in Gujarat in 2023 and Cyclone Dana in Odisha in 2024.
Part 8: Twelve years of cyclones, October 2014 to October 2026
This part walks through the storms that mattered most, year by year. Each one is tied to a concept from the earlier parts, so by the end you will have seen every idea at work on a real Indian coast. Wind speeds are IMD’s three-minute values unless stated, and dates are in Indian time.
2014: Hudhud and Nilofar
Hudhud (7 to 14 October 2014), extremely severe cyclonic storm, landfall at Visakhapatnam. Concepts: landfall at peak strength, rapid intensification, the remnant hazard.
Hudhud formed as a depression over the Andaman Sea on 7 October, crossed the Bay of Bengal west-north-west, and intensified rapidly on 11 October to a peak of about 185 km/h with a central pressure near 950 hPa in later reanalysis. It crossed the coast at Visakhapatnam around midday on 12 October, still at or near peak strength, the strongest storm to hit the city in living memory.
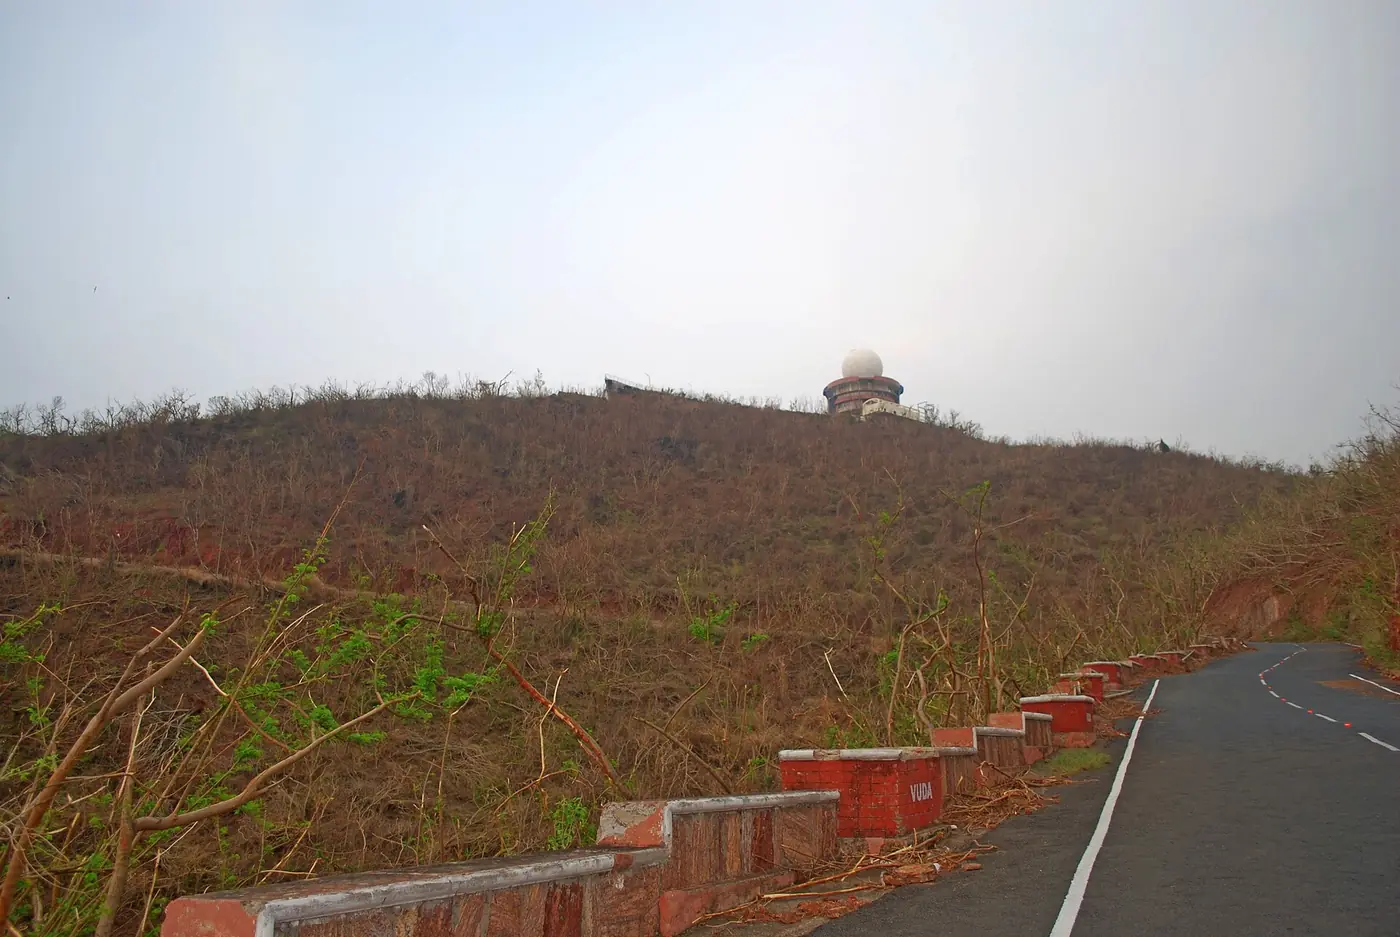

The damage was concentrated and extreme. About seven in ten of the city’s trees were lost. The airport terminal was badly damaged and closed for about a week. The steel plant lost power for days, and the Eastern Naval Command, Andhra University and the Indira Gandhi Zoological Park all suffered heavy damage. A 1.4-metre storm surge eroded beaches and coastal roads. About 1.1 lakh people were evacuated in coastal Andhra Pradesh, and several lakh were moved to relief camps across Andhra and Odisha. Forty-six people died in Andhra Pradesh. Hudhud’s remnant travelled north to the Himalaya and caused a snowstorm and avalanches in Nepal that killed 43 trekkers and guides. A 2015 UN report estimated total losses at about US$11 billion.
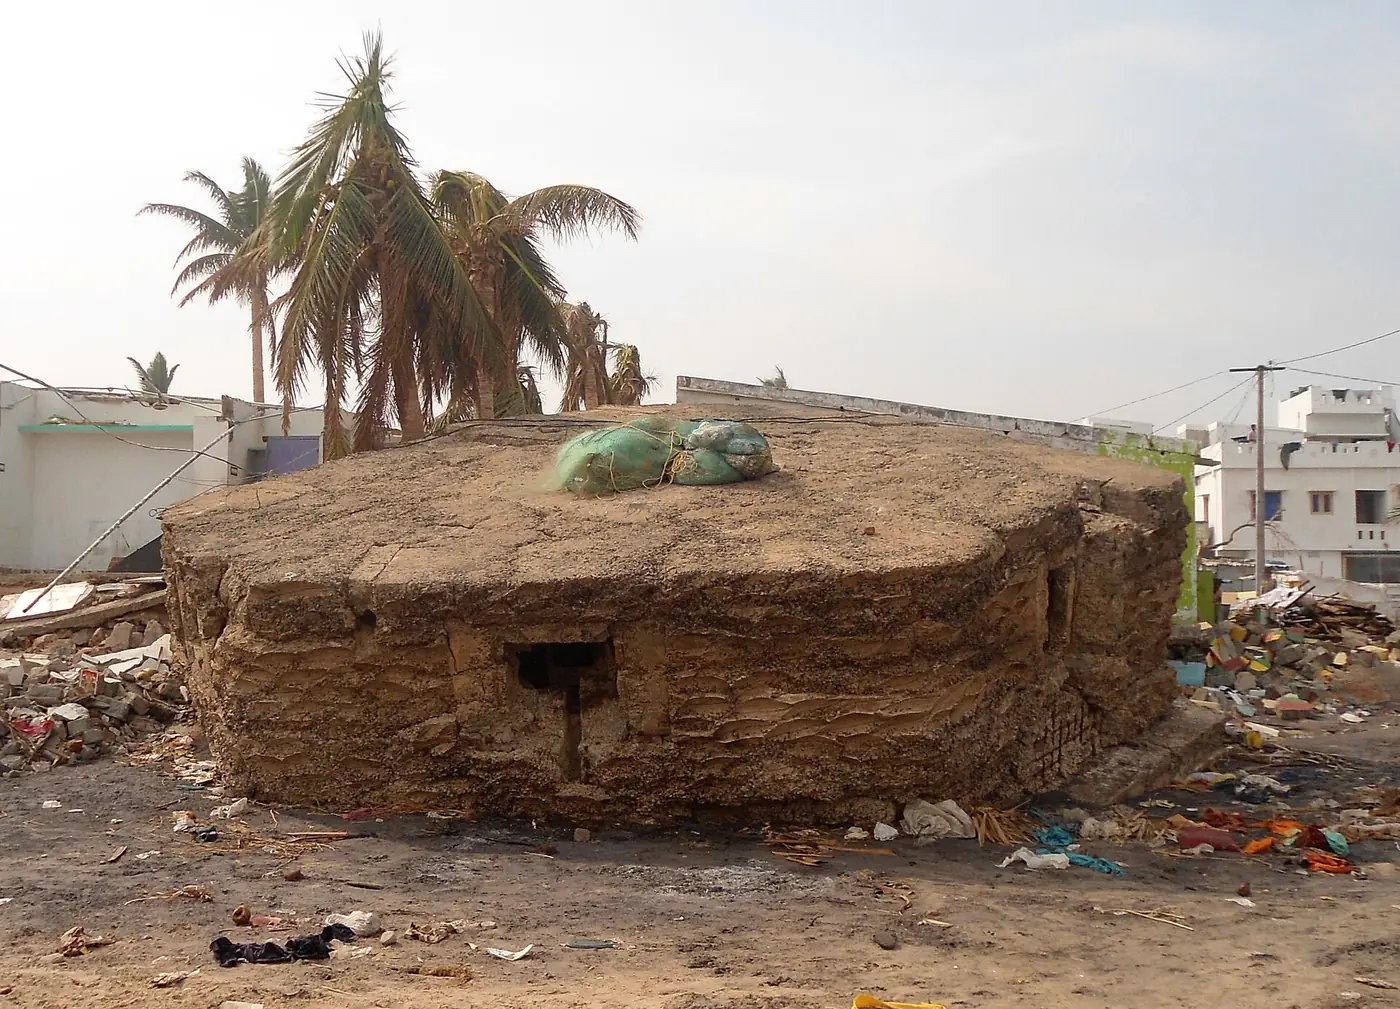

Hudhud also showed what good warning can do. IMD forecast the landfall point at Visakhapatnam days in advance and very accurately, and the death toll, while painful, was a small fraction of what storms of similar strength had caused on the same coast in the 1970s.
Nilofar (25 to 31 October 2014), extremely severe cyclonic storm, no landfall. Concepts: shear and dry air.
Two weeks after Hudhud, Nilofar became one of the strongest storms then recorded in the Arabian Sea, peaking at about 205 km/h and 950 hPa. It turned north towards Gujarat, where officials prepared for a major landfall. Instead it ran into strong shear and dry, cooler air from the north-west and collapsed in about two days, reaching the coast only as a remnant low. It is the best example in our window of a powerful storm killed by its environment.
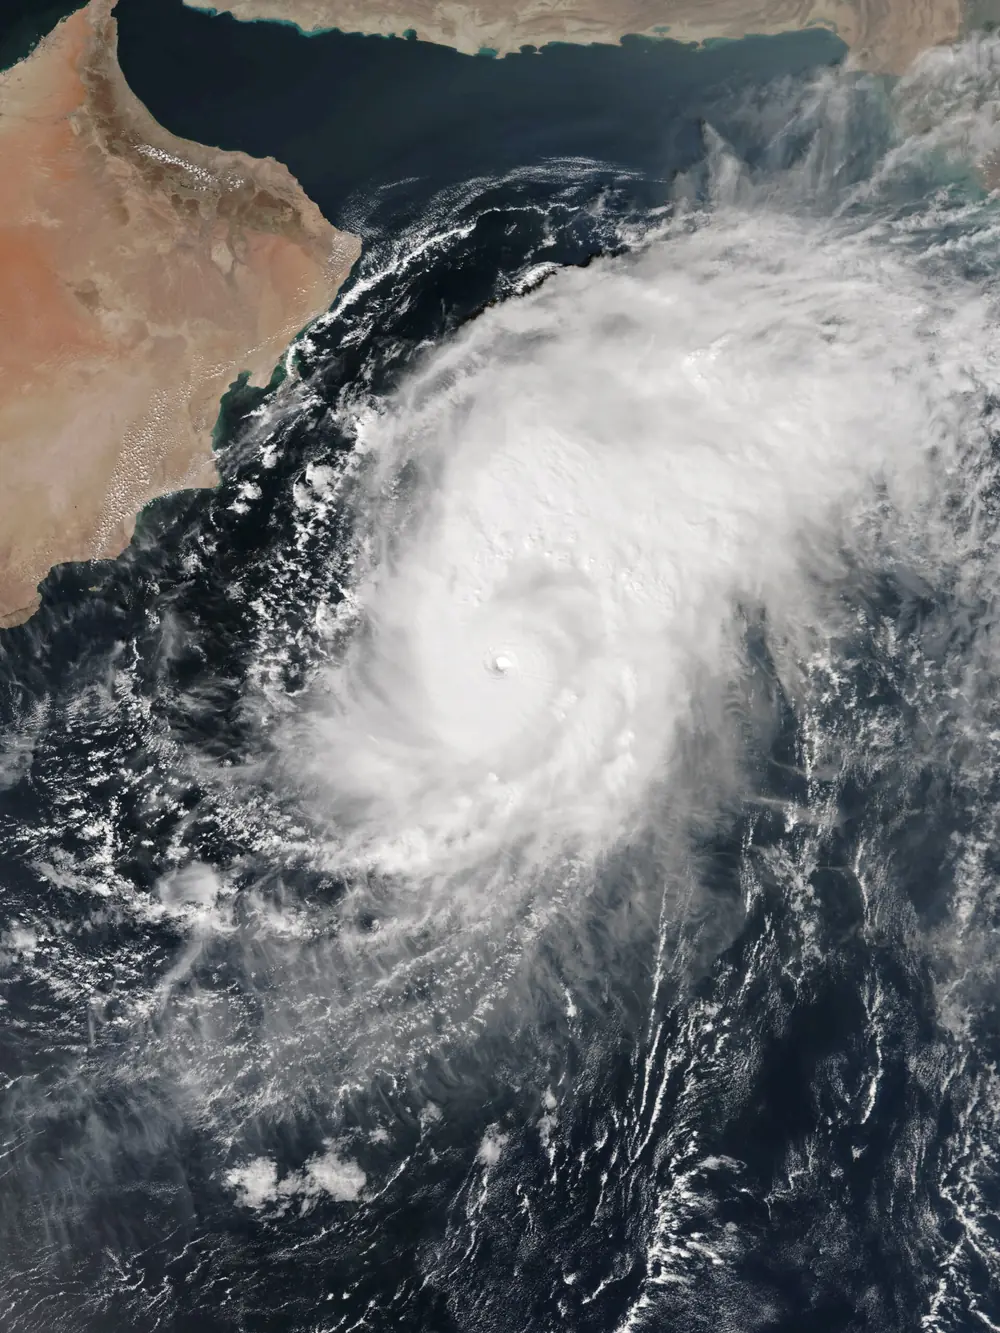

2015: Chapala, Megh and an unnamed deep depression
Chapala and Megh (October and November 2015), extremely severe cyclonic storms, Yemen and Socotra. Concept: the Arabian Sea’s westward storms. Within about a week of each other, two extremely severe cyclonic storms tracked west across the Arabian Sea and struck the Yemeni island of Socotra and the Yemen coast, a region with almost no history of such hits. Neither touched India, but they were early signs of the more active Arabian Sea that the rest of this decade would confirm.
BOB 03 (8 to 10 November 2015), deep depression, Tamil Nadu. Concept: the ladder measures wind, not danger. A deep depression, which never got a name, crossed the Tamil Nadu coast near Puducherry and dumped extreme rain on the north coast, including about 48 cm in a day at Neyveli. It killed dozens of people in Tamil Nadu and was one link in the chain of systems that produced the catastrophic Chennai floods of November and December 2015.
2016: Vardah
Vardah (6 to 13 December 2016), very severe cyclonic storm, landfall at Chennai. Concept: the urban cyclone.
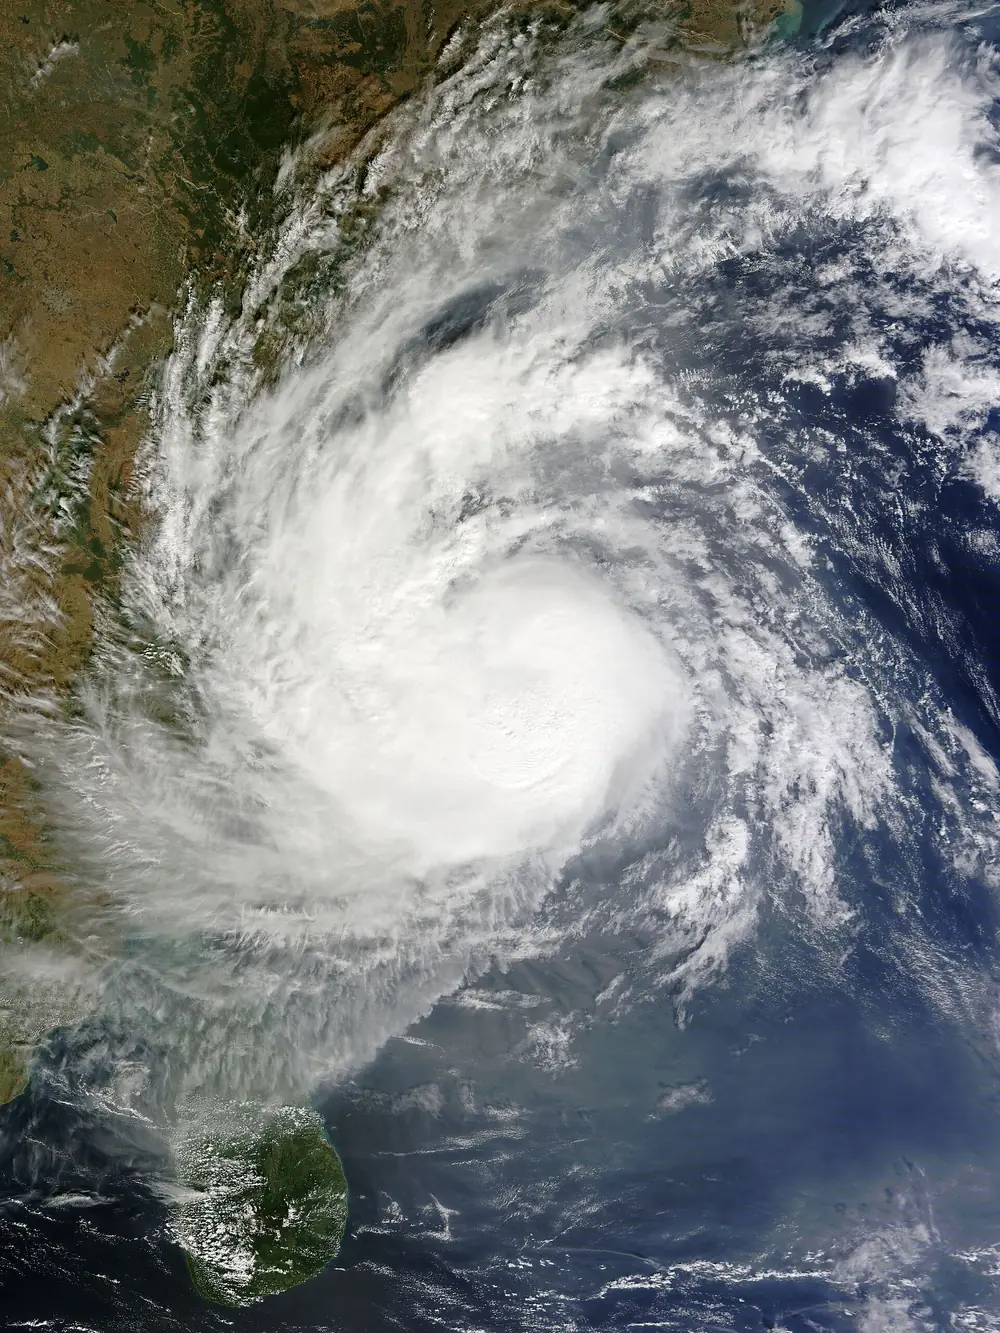

Vardah peaked at about 130 km/h and weakened slightly before crossing the coast close to Chennai on the afternoon of 12 December, one of the very few cyclones to make landfall directly on a metropolitan city in India. Lakhs of trees came down across Chennai and its suburbs, tens of thousands of electric poles and thousands of transformers were damaged, roads were blocked, the airport closed and suburban trains stopped. The Tamil Nadu government put losses at over ₹22,000 crore. Vardah is the case study for what a “moderate” cyclone does to a modern city: the death toll was relatively low, but the city’s infrastructure took weeks to recover.
2017: Ockhi
Ockhi (29 November to 6 December 2017), very severe cyclonic storm. Concepts: genesis close to the coast, warnings for fishermen, a long journey.
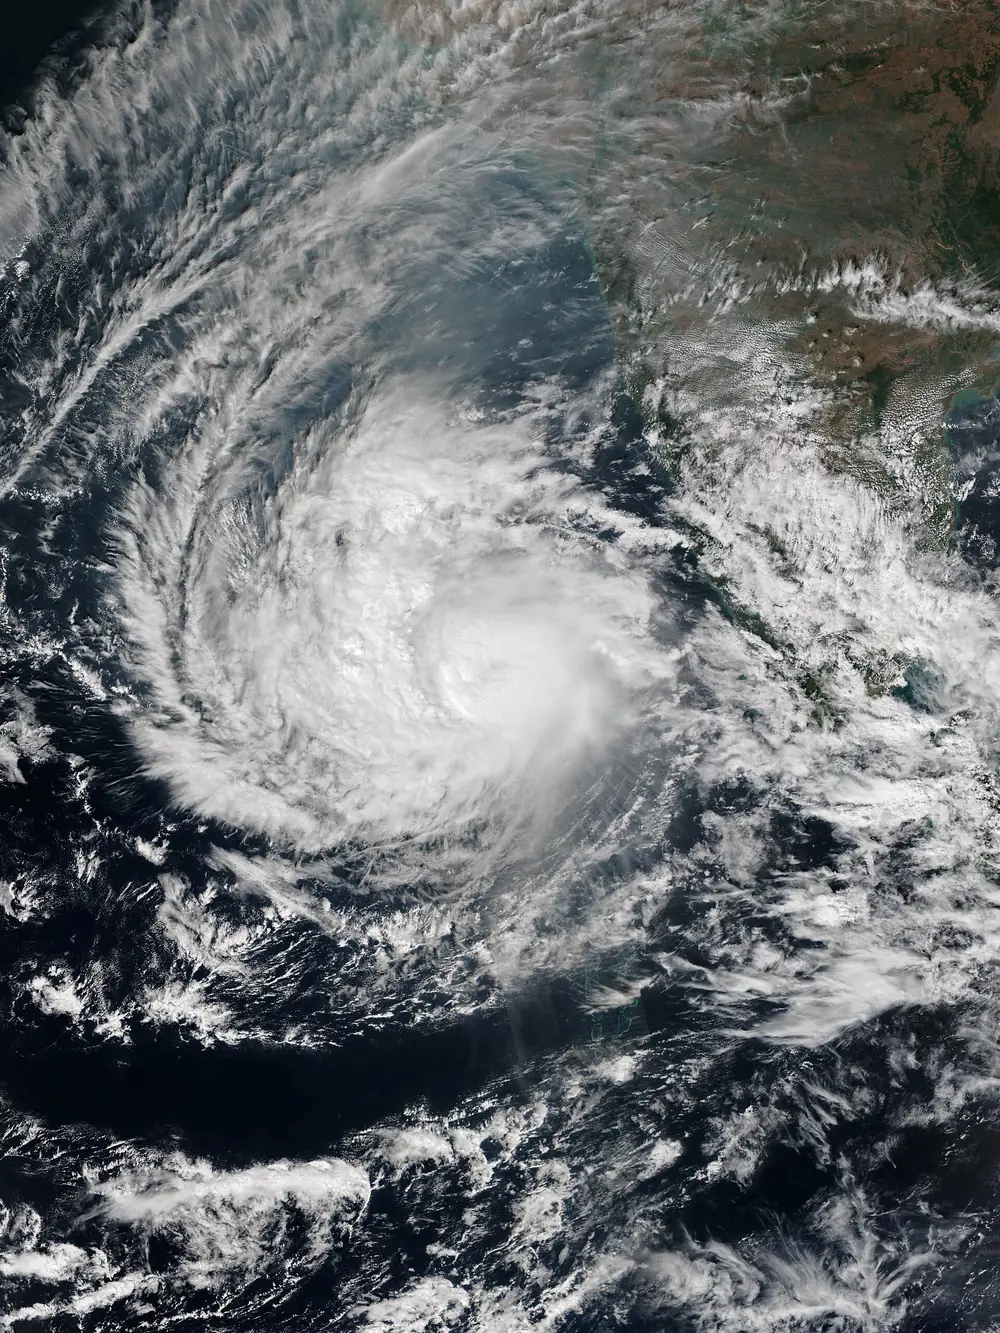

Ockhi began as a depression just off south-east Sri Lanka on 29 November and became a cyclonic storm as it passed just south of Kanyakumari on 30 November, only hours after being a deep depression. It then crossed the Lakshadweep islands as a very severe cyclonic storm of about 155 km/h, curved north through the Arabian Sea and finally weakened near the south Gujarat coast on 6 December, after a journey of over 2,500 km.
Ockhi’s toll fell hardest on fishing communities in Kerala and Tamil Nadu. Many boats were already at sea on long trips when the storm formed so close to shore, and several hundred fishermen died or were never found. The anger that followed changed how warnings for fishermen are issued and delivered, as described in Part 7.
2018: Titli, Gaja and a crowded year
Titli (8 to 12 October 2018), very severe cyclonic storm, landfall near Palasa, Srikakulam. Concept: recurvature and inland flooding.
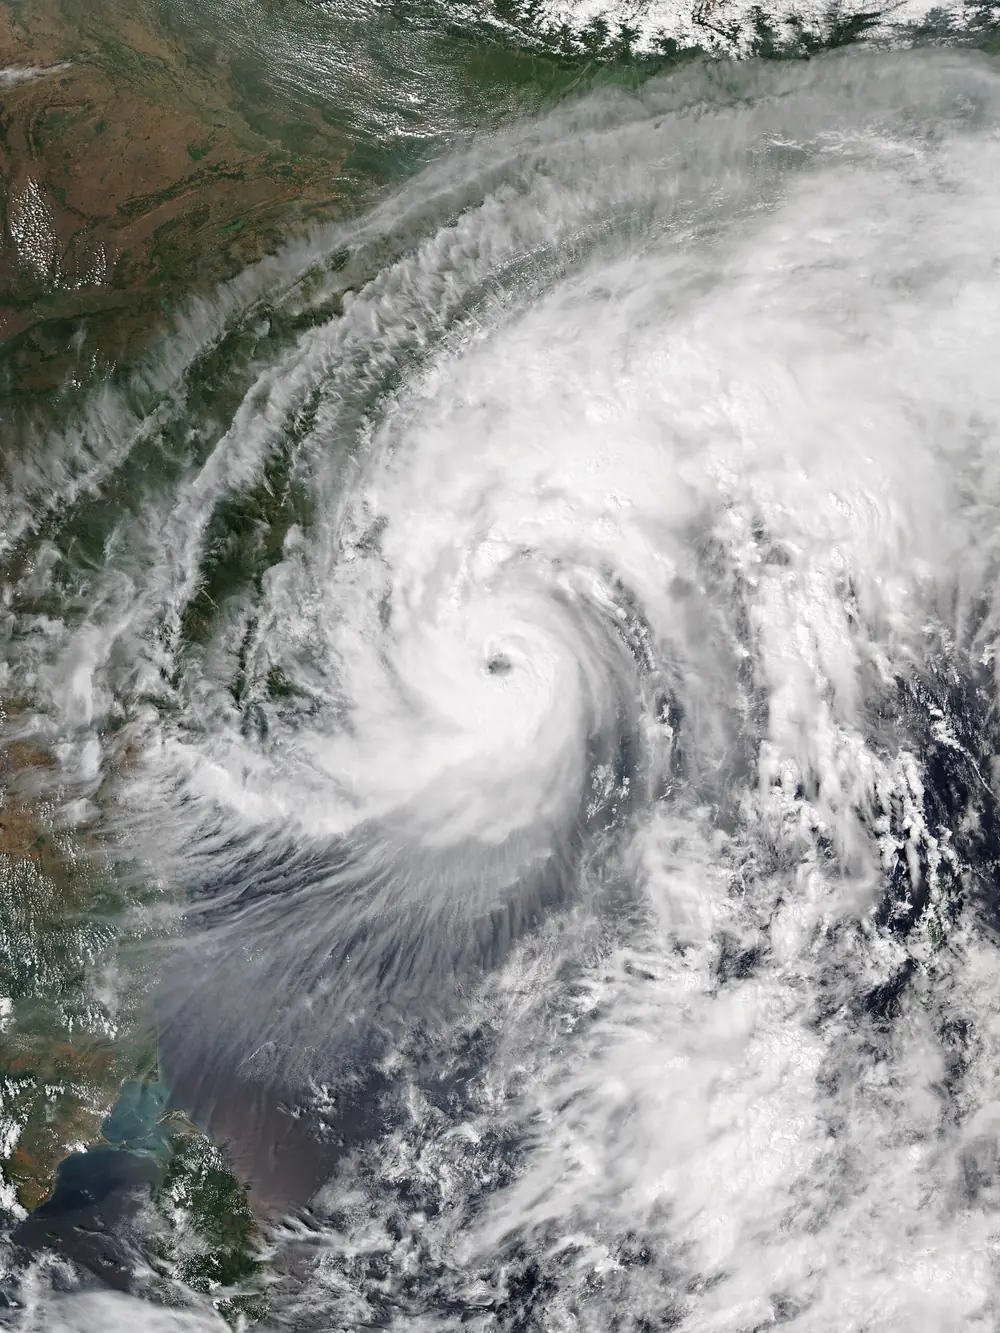

Titli peaked at about 150 km/h with a compact eye only about 12 km wide and crossed the coast near Palasa in Srikakulam district late on 10 October, hitting cashew and coconut plantations hard. Instead of continuing north-west, it recurved north-east through Odisha. Its rain triggered floods and landslides in the hilly Gajapati and Ganjam districts. One landslide killed 12 people who had taken shelter in a cave. More people died in Odisha, far from the landfall point, than in Andhra Pradesh where the eye crossed.
Gaja (10 to 19 November 2018), very severe cyclonic storm, landfall between Nagapattinam and Vedaranyam. Concepts: storm surge, agriculture, the cross-peninsula track.
Gaja crossed the Tamil Nadu coast in the early hours of 16 November and ploughed straight through the Cauvery delta, destroying coconut groves that families had tended for decades, along with banana, paddy and sugarcane. A storm surge of up to about 1.8 metres was reported at Kodikkarai. The storm then crossed the whole peninsula, through Tamil Nadu and Kerala, and re-emerged in the Arabian Sea as a depression. Gaja is a reminder that a farmer’s loss is measured in years: a coconut palm takes several years to bear fruit again.
The same year the Arabian Sea produced Mekunu, an extremely severe cyclonic storm that hit Salalah in Oman in May, and Luban, which hit Yemen in October. On 10 October 2018, Titli in the Bay and Luban in the Arabian Sea were both active at the same moment, a sight that would become more common.
2019: the record year
2019 had eight storms of cyclone strength, more than any other year in our window, and five of them were in the Arabian Sea, about five times its long-term yearly average.
Fani (26 April to 5 May 2019), extremely severe cyclonic storm, landfall at Puri. Concepts: a long-track pre-monsoon storm, mass evacuation.
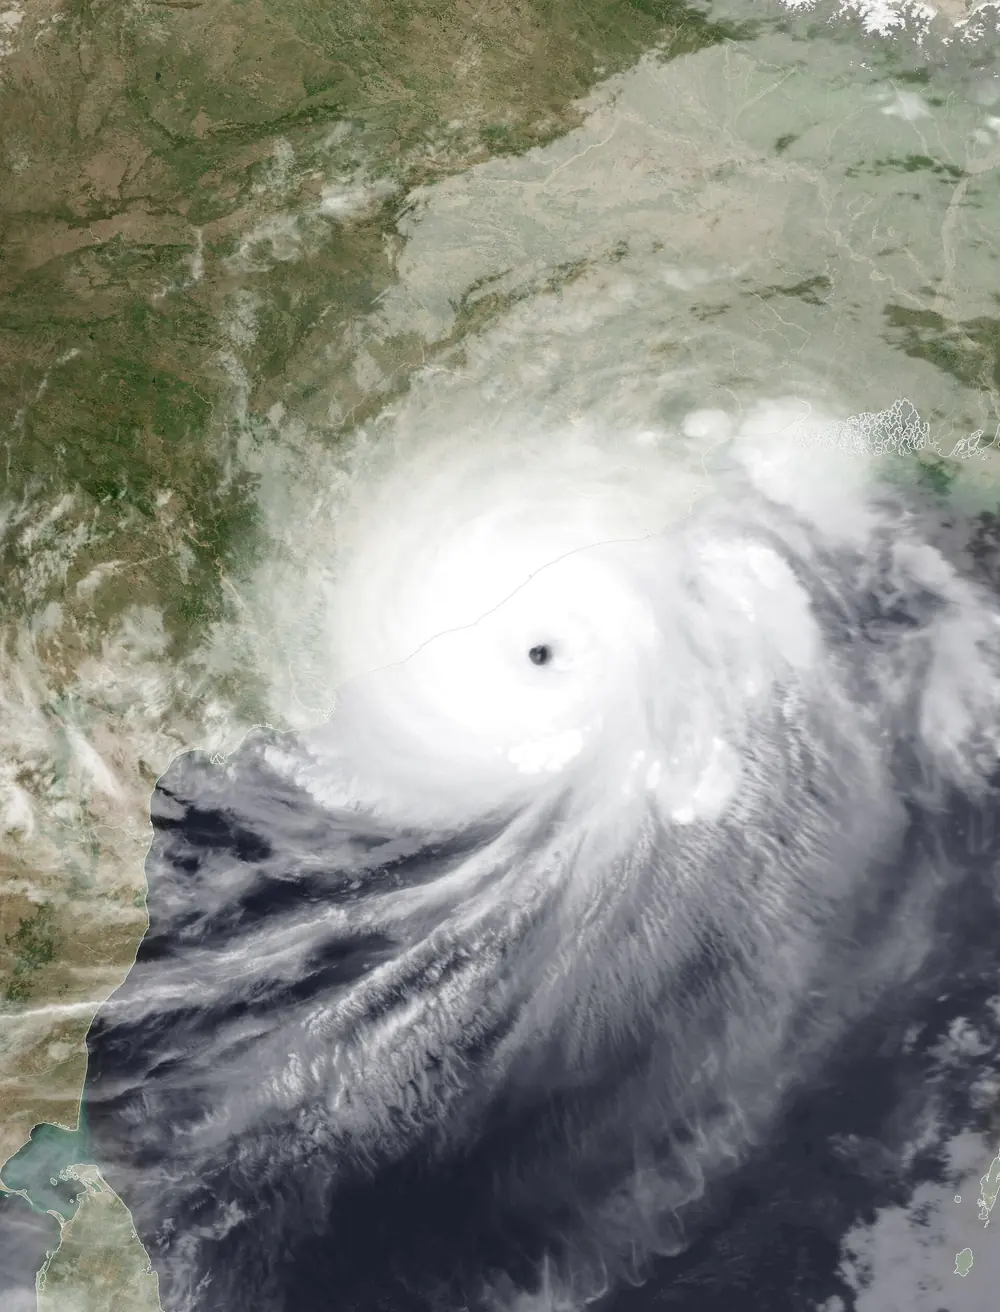

Fani formed unusually close to the equator, west of Sumatra, and took more than a week to reach Odisha, which gave forecasters and officials time. It peaked at about 215 km/h and around 932 hPa, and crossed the coast at Puri on the morning of 3 May as an extremely severe cyclonic storm of about 175 to 185 km/h, the strongest landfall in Odisha since the 1999 super cyclone.
Odisha moved more than 1.2 million people to shelters, and Bangladesh moved a similar number before the remnant reached it. The state’s death toll was 64. Damage was immense, around US$8 billion across the region, with Puri and Bhubaneswar losing power, trees, roofs and telecom towers for weeks.
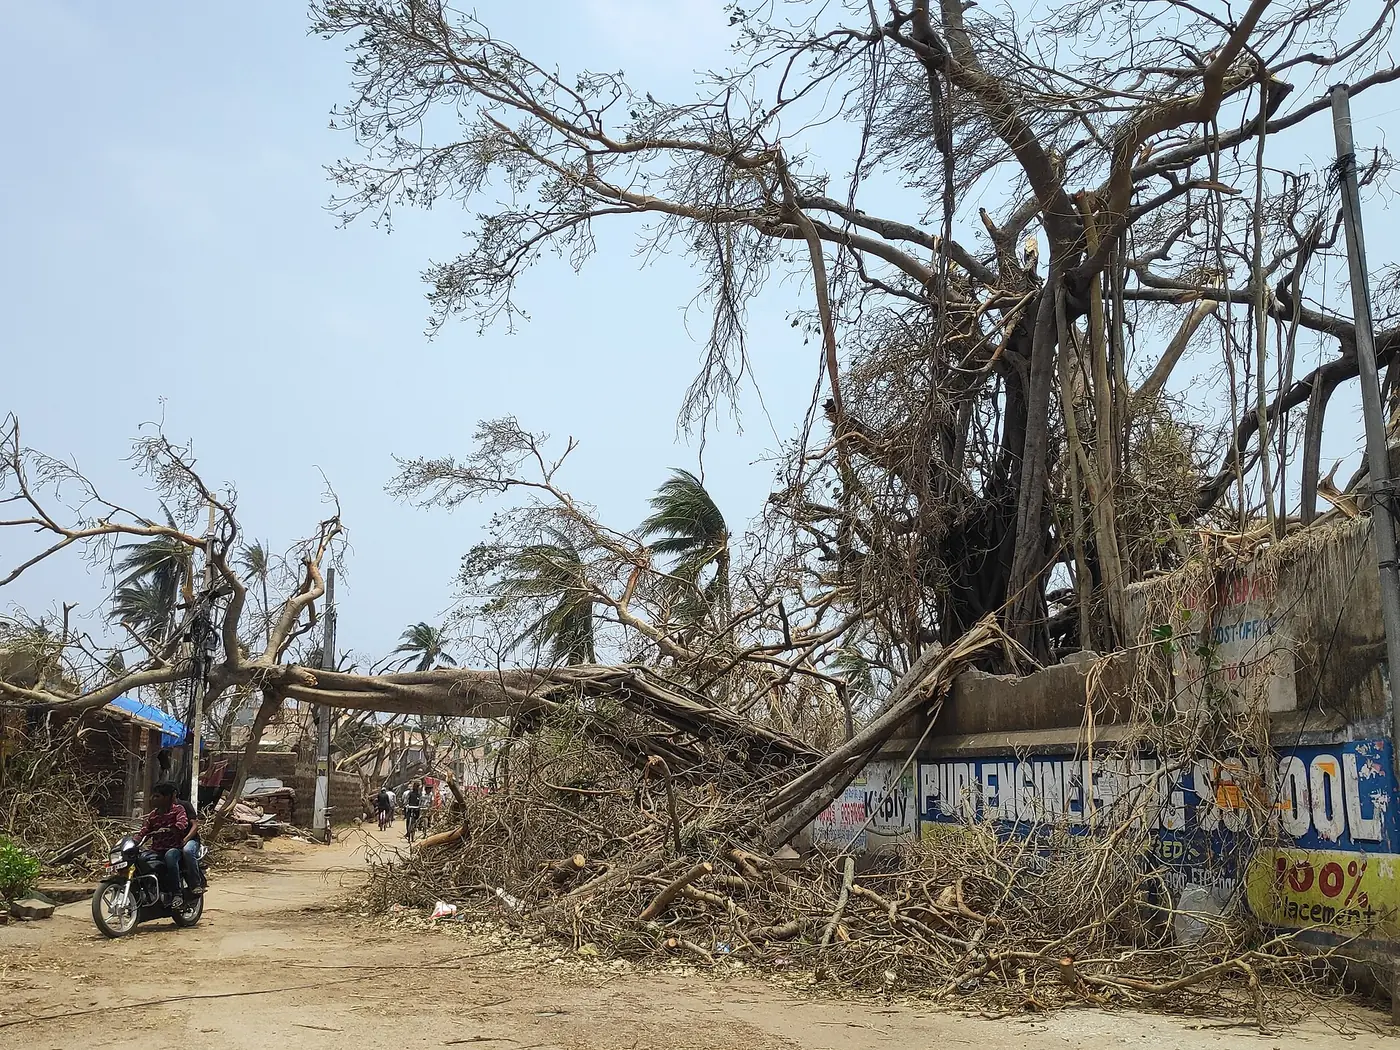

Vayu (10 to 17 June 2019), very severe cyclonic storm, no landfall. Concept: forecast uncertainty and a monsoon disrupted. Vayu was forecast to hit the Saurashtra coast of Gujarat as a very severe cyclonic storm, and about three lakh people were evacuated. On 13 June it turned west, then wandered for days and finally looped back to the Kutch coast as a weak low. By drawing moisture away from the monsoon, it held up the monsoon’s march into north India by about a week.
Kyarr (24 October to 2 November 2019), super cyclonic storm, no landfall. Concept: the Arabian Sea’s new extremes.
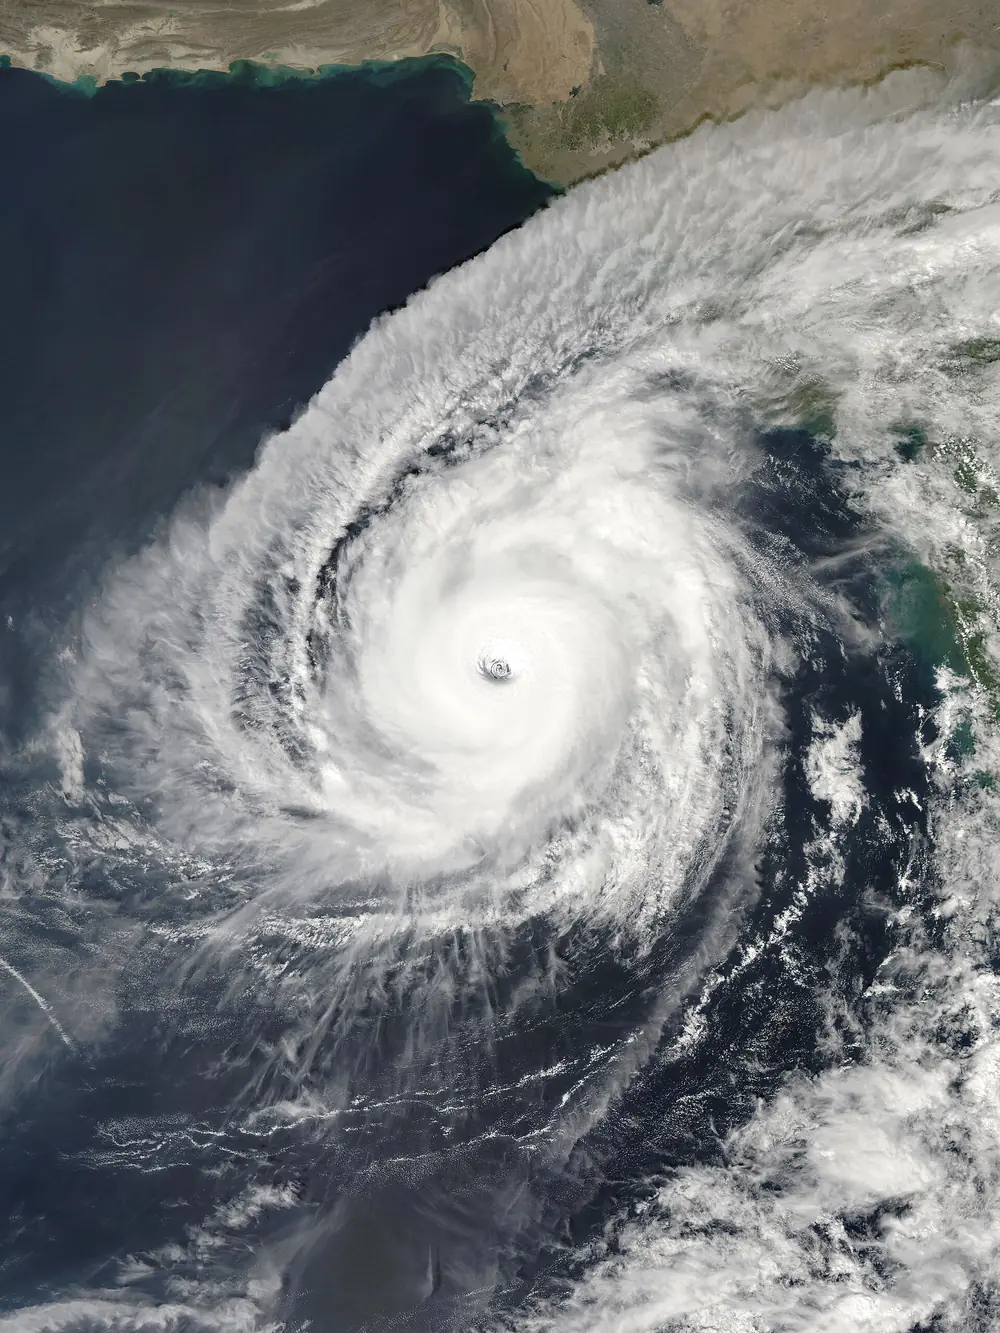

Kyarr formed over the east-central Arabian Sea a few hundred kilometres off the Goa and Karnataka coasts, turned away from India, and intensified by about 110 km/h in a day to become a super cyclonic storm of about 240 km/h and 922 hPa on 27 October. It was the first super cyclonic storm in the Arabian Sea since Gonu in 2007 and one of the strongest on record there. It never made landfall, but its swell flooded parts of the Konkan coast, Goa and Karnataka. While Kyarr was still alive, Maha formed off the southern tip of India and passed over Lakshadweep, and for the first time on record two cyclonic storms were active in the Arabian Sea at once.
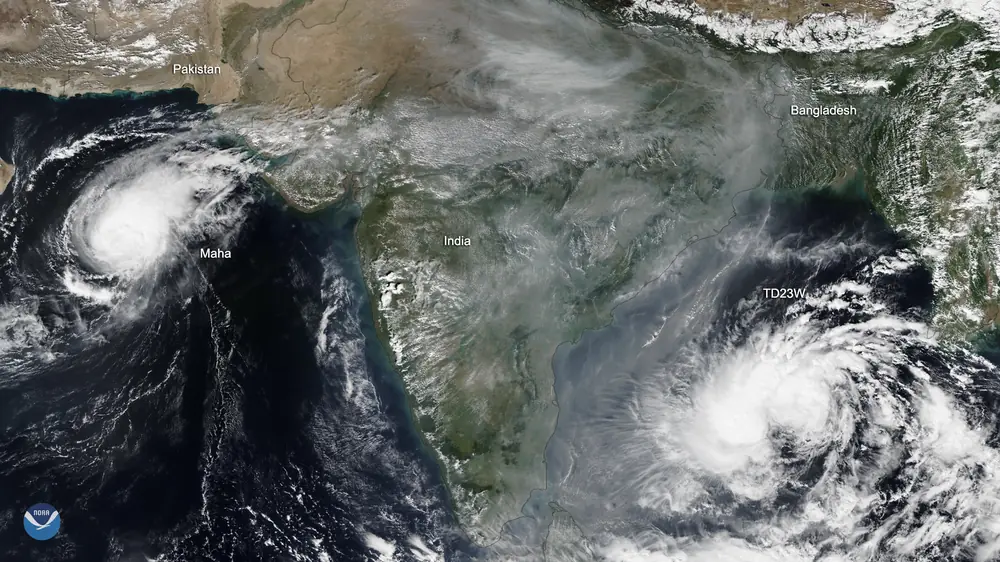

Bulbul (5 to 11 November 2019), very severe cyclonic storm, landfall near Sagar Island. Concept: a Pacific storm reborn. Bulbul was the leftover of Tropical Storm Matmo, which had hit Vietnam a week earlier. The remains crossed Southeast Asia, re-formed over the Andaman Sea, and became a very severe cyclonic storm that crossed the Sundarbans near Sagar Island on the night of 9 November, killing about 40 people in West Bengal and Bangladesh.
2020: Amphan, Nisarga, Nivar, in a pandemic year
Amphan (16 to 21 May 2020), super cyclonic storm, landfall near Bakkhali, West Bengal. Concepts: super cyclone, rapid intensification, eyewall replacement, evacuation under COVID-19.
Amphan formed as a depression over the south-east Bay of Bengal on 16 May. Over the next two days it became the fastest-strengthening storm in our window, gaining around 120 km/h in 24 hours to reach super cyclonic storm strength of about 240 km/h with a central pressure of 920 hPa on 18 May. It went through an eyewall replacement, weakened over cooler water to the north, and crossed the Sundarbans coast of West Bengal near Bakkhali on the afternoon of 20 May as a very severe cyclonic storm of about 155 km/h, the strongest storm to hit the Ganges delta in our window and the strongest to strike India since 1999.
Its broad wind field swept straight over Kolkata, uprooting thousands of trees, flattening homes in the Sundarbans and cutting power and water to millions for days. Around 130 people died in India and Bangladesh. With damage estimated at about US$15 billion, Amphan was the costliest cyclone ever recorded in the North Indian Ocean until Senyar in 2025.
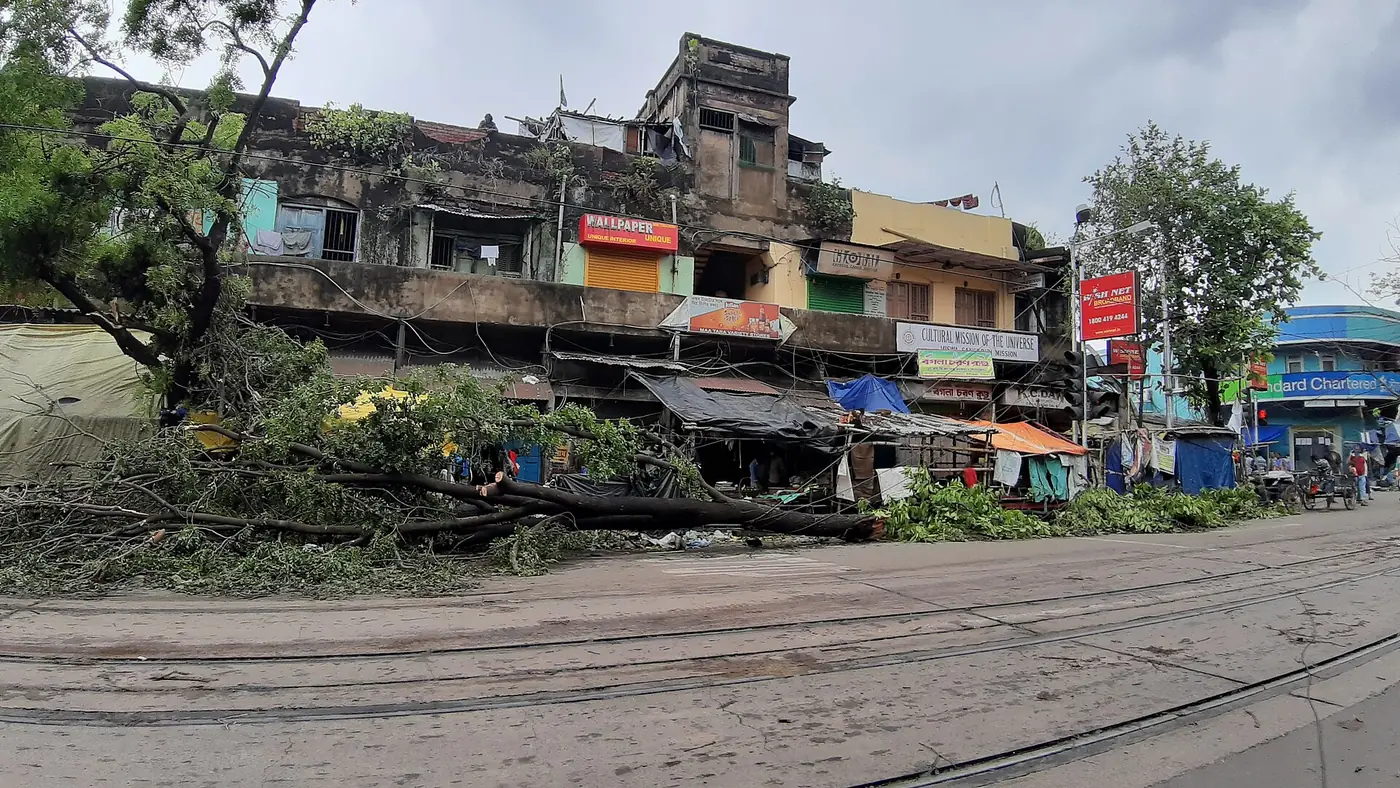

Amphan struck in the middle of India’s first COVID-19 lockdown. West Bengal and Odisha evacuated more than five lakh people while trying to keep shelters from becoming infection hotspots. Odisha filled its shelters to only a third of capacity, and Kolkata opened schools and community centres as extra shelters so that people could be spread out. It was the first major test of evacuation planning in a pandemic, and it largely held.
Nisarga (1 to 4 June 2020), severe cyclonic storm, landfall near Alibag. Concept: the near miss. Nisarga crossed the Konkan coast near Alibag, about 95 km south of Mumbai, around 12:30 pm on 3 June with winds around 110 km/h. It was the strongest cyclone to hit Maharashtra in June since 1891, and the first to strike the Raigad and Mumbai region since Cyclone Phyan in 2009. Six people died. A shift of a hundred kilometres north would have put India’s financial capital on the right-hand side of a landfalling cyclone, and planners took note.
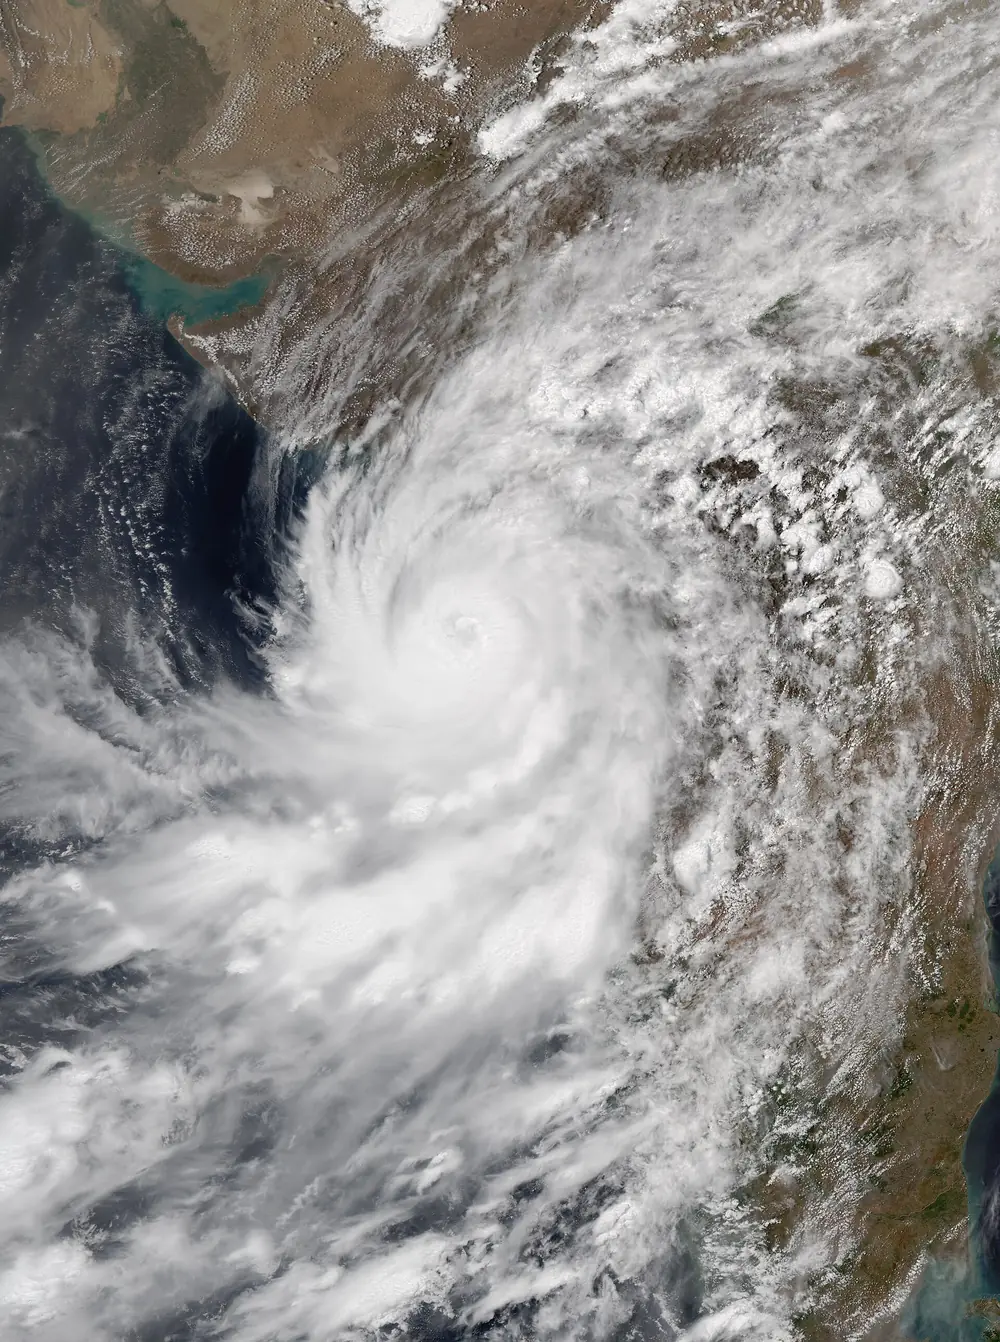

Nivar (23 to 27 November 2020), very severe cyclonic storm, landfall near Puducherry. Concept: rain and reservoirs. Nivar crossed the coast close to Puducherry, near Marakkanam, around midnight on 25 November with winds near 120 km/h. Its heavy rain forced the Chembarambakkam reservoir, a key source of Chennai’s water and a major factor in the 2015 floods, to release water for the first time in five years. This time the release was planned and gradual, and the city avoided the disaster of 2015. Days later, Burevi crossed Sri Lanka and stalled in the Gulf of Mannar, bringing more heavy rain to south Tamil Nadu.
In the Arabian Sea, Gati in November 2020 strengthened explosively, gaining about 75 km/h of one-minute wind in roughly six hours by US estimates, and on 22 November became the strongest tropical cyclone on record to hit Somalia.
2021: Tauktae, Yaas and the storm that crossed India
Tauktae (14 to 19 May 2021), extremely severe cyclonic storm, landfall near Diu. Concepts: a storm running parallel to the coast, danger at sea.
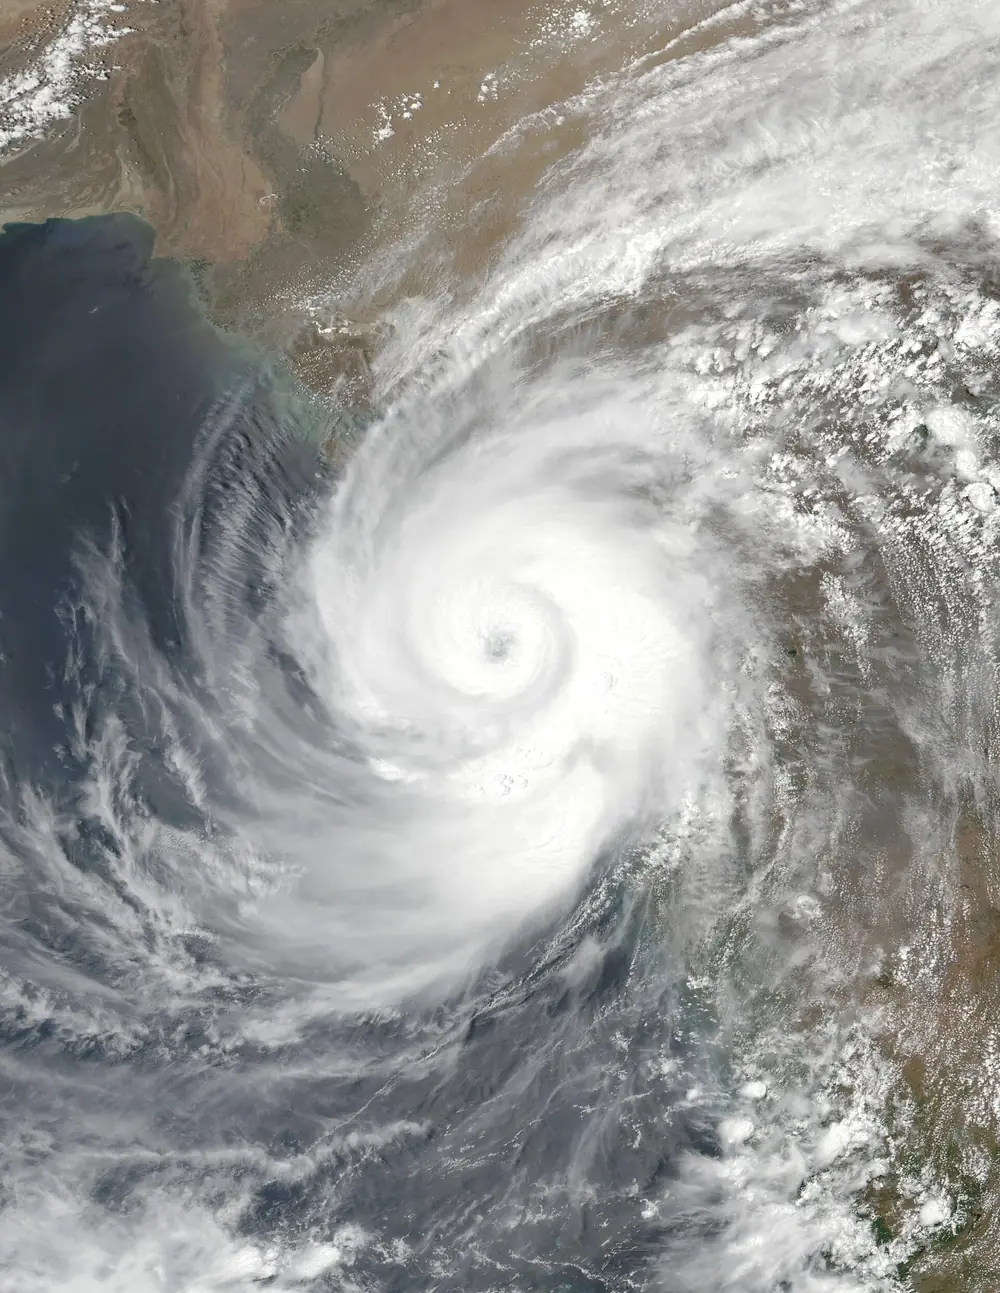

Tauktae formed off Lakshadweep and moved almost due north, parallel to the west coast and 100 to 200 km off it, past Kerala, Karnataka, Goa and Maharashtra. Every state on the way got lashed by its western rain bands and wind. Off Mumbai on 17 May, the accommodation barge P305, working for an offshore oil field, broke loose and sank; dozens of workers died. Mumbai recorded its highest May rainfall on record. That night Tauktae crossed the Saurashtra coast near Diu and Una as an extremely severe cyclonic storm, the strongest landfall in Gujarat since 1998, with a peak of about 185 km/h. In all, about 170 people died.
Tauktae arrived during the deadly second wave of COVID-19, when hospitals in Gujarat and Maharashtra were full and dependent on uninterrupted power and oxygen supply. Keeping those running through the storm was a large part of the response.
Yaas (23 to 28 May 2021), very severe cyclonic storm, landfall north of Dhamra, Odisha. Concept: storm tide. Yaas crossed the coast north of Dhamra port around 9 am on 26 May with winds of about 130 to 140 km/h. Its landfall coincided with a full moon and therefore a spring tide. The combination pushed sea water deep into the Sundarbans and coastal villages of West Bengal, more than a hundred kilometres to the right of the landfall point, flooding more than a thousand villages.
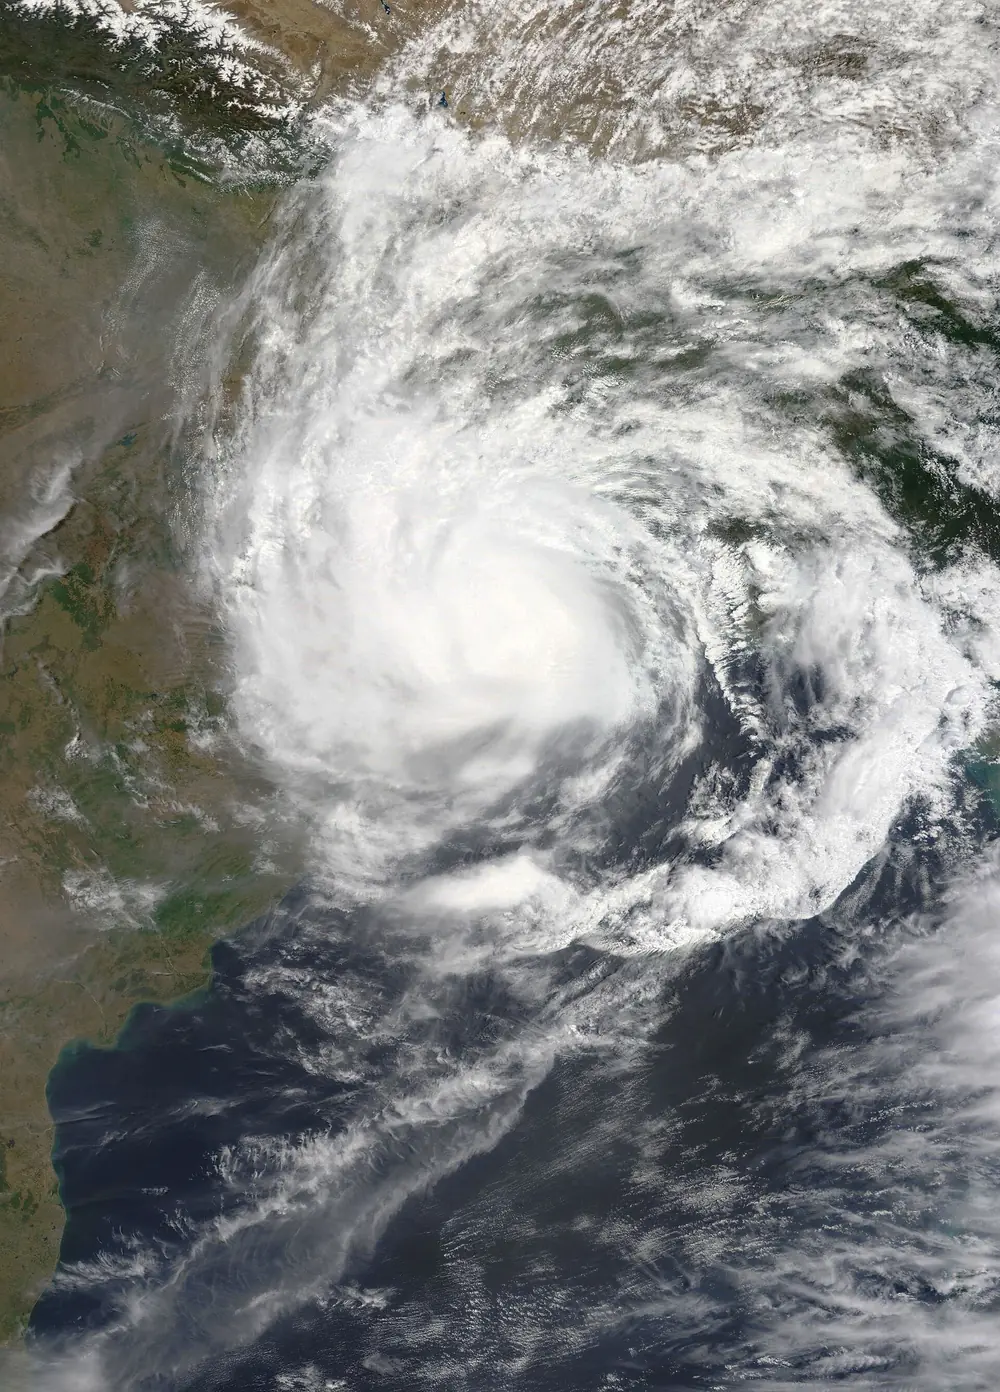

Gulab and Shaheen (24 September to 4 October 2021). Concept: regeneration. Gulab was a modest cyclonic storm that crossed the north Andhra coast near Kalingapatnam on the evening of 26 September. In Visakhapatnam it brought about 28 cm of rain in a day, one of the wettest days in the city’s modern record. Its leftover low then travelled more than 1,500 km west across Telangana, Maharashtra and Gujarat, re-emerged over the Arabian Sea, and on 1 October was named Shaheen as it re-strengthened into a severe cyclonic storm. Shaheen struck the north coast of Oman on 3 October, a very rare event there, and killed at least 14 people in Oman and several more in Iran.
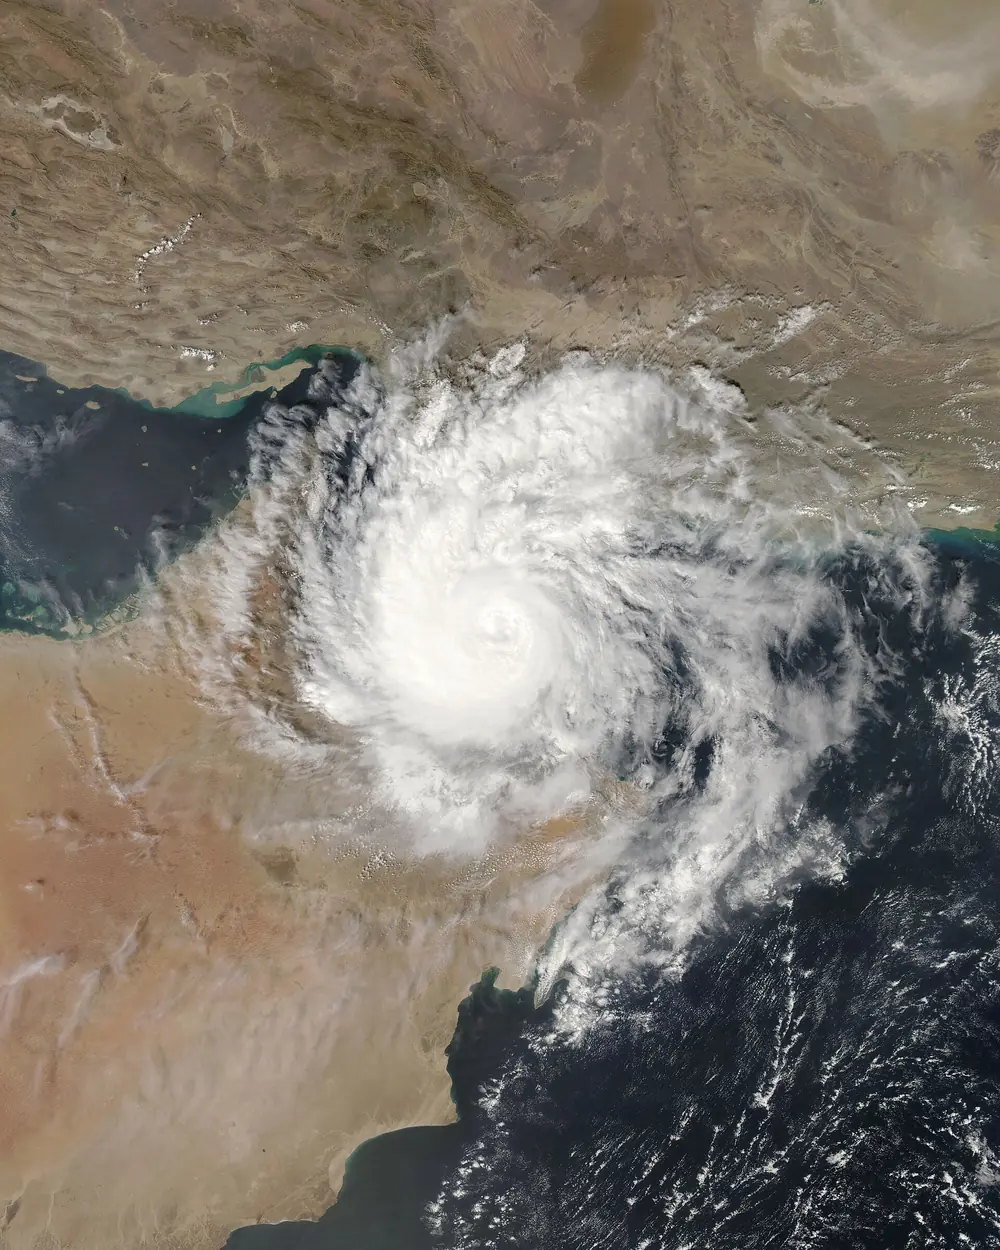

Jawad (December 2021) was forecast to approach the north Andhra and Odisha coast, and tens of thousands of people were moved to shelters in Andhra Pradesh, Odisha and West Bengal. Instead it weakened over cooler water and faded into a low over the north-west Bay of Bengal without making landfall. That is not a failure: precautions taken for a storm that weakens are the price of never being caught out by one that does not.
2022: a quieter year with a golden surprise
2022 produced only three cyclones, all in the Bay of Bengal and none stronger than severe.
Asani (May 2022) became a severe cyclonic storm of about 100 km/h and then did something unusual: instead of crossing the coast head-on, it curved and moved almost parallel to the Andhra coast, weakened, and crossed near Machilipatnam and Narsapur as a deep depression on 11 May. Its surf washed up a gold-coloured, chariot-like structure at Sunnapalli in Srikakulam district, apparently drifted across the Bay from South-East Asia, a strange image that made national news.
Sitrang (October 2022) hit Bangladesh. Mandous (December 2022) peaked as a severe cyclonic storm, weakened, and crossed the north Tamil Nadu coast near Mamallapuram on the night of 9 December as a cyclonic storm, bringing down hundreds of trees in Chennai.
2023: Mocha, Biparjoy, twin storms and Michaung
Mocha (9 to 15 May 2023), extremely severe cyclonic storm, landfall near Sittwe, Myanmar. Concept: the Bay’s eastern coast.
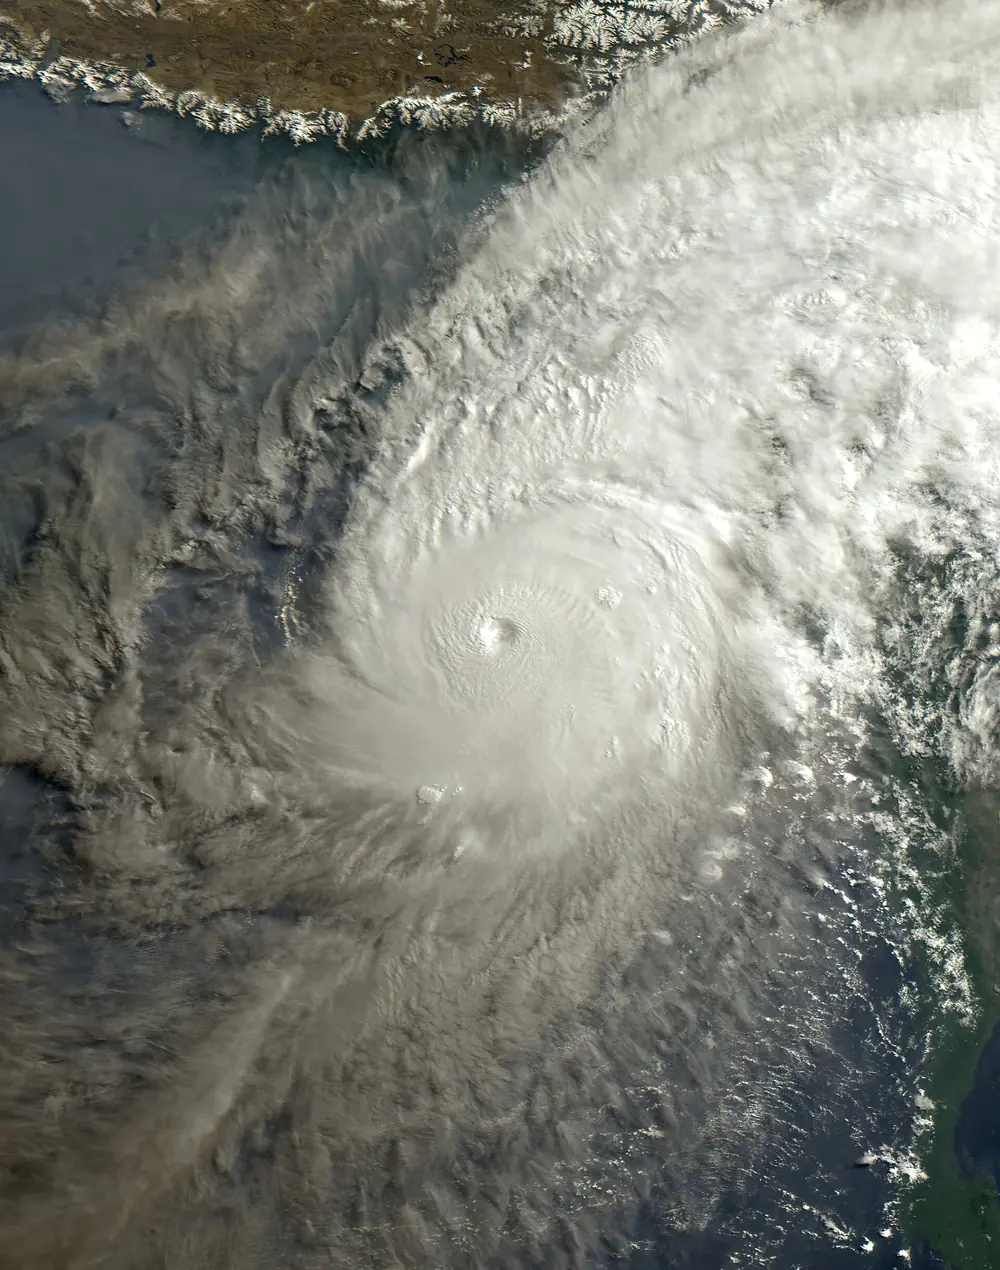

Mocha intensified by over 90 km/h in a day, peaked at about 215 km/h and 938 hPa, just short of super cyclone strength, and crossed the Rakhine coast of Myanmar just north of Sittwe on 14 May. Hundreds died in Myanmar, many of them Rohingya living in flimsy camps near the coast. India’s role was to warn: as RSMC, IMD issued the official regional advisories that Myanmar and Bangladesh used.
Biparjoy (6 to 19 June 2023), extremely severe cyclonic storm, landfall near Jakhau, Gujarat. Concepts: the long-lived Arabian Sea storm, zero-casualty evacuation.
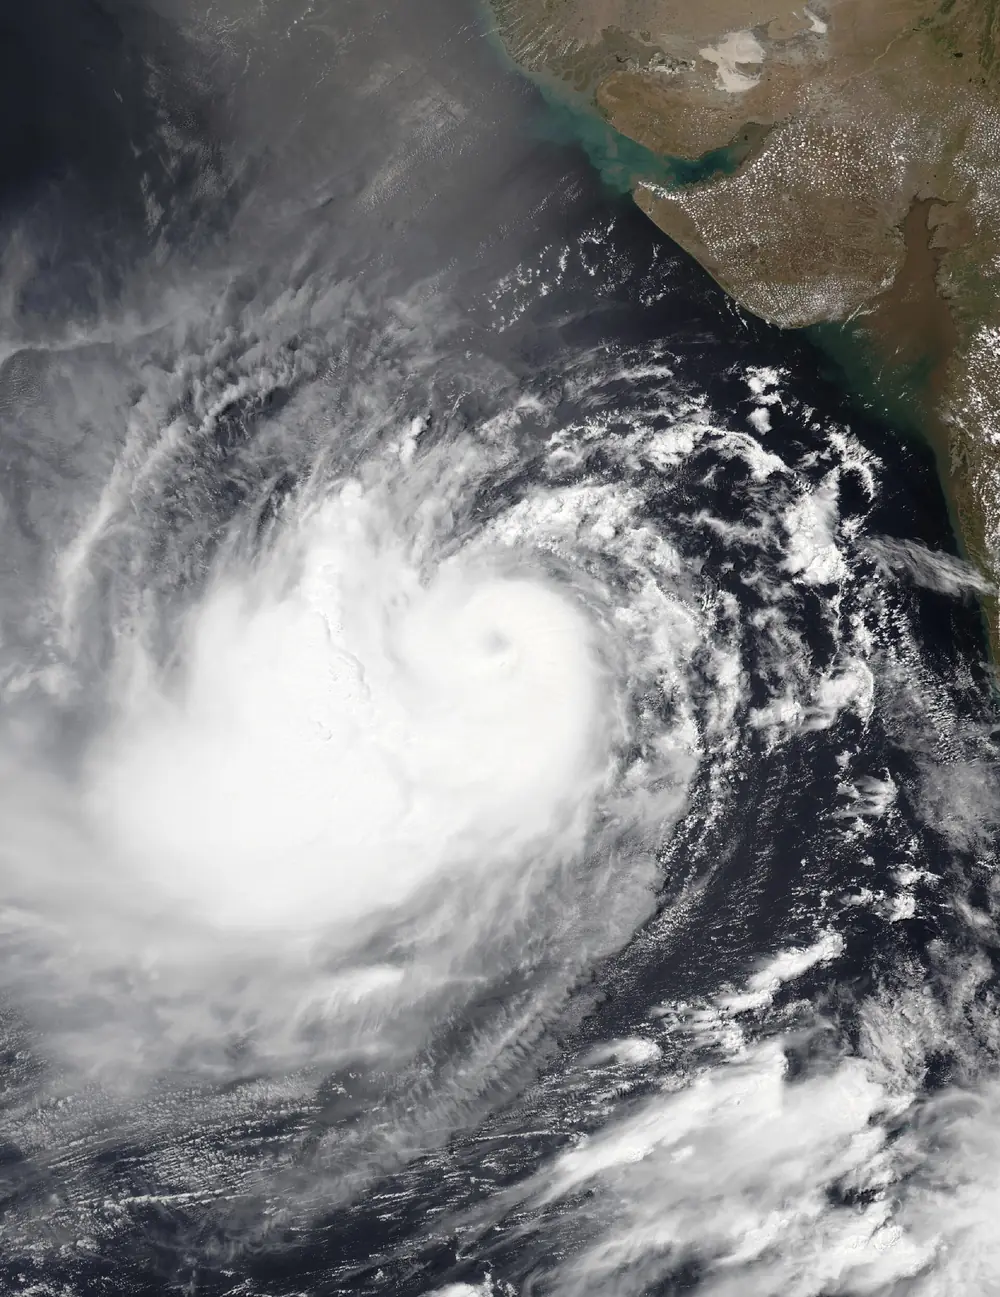

Biparjoy lasted about 13 days, one of the longest lives of any Arabian Sea cyclone, and it released more accumulated cyclone energy than any North Indian Ocean storm on record. It meandered north for more than a week as a very severe and briefly extremely severe cyclonic storm, then crossed the Kutch coast near Jakhau port on the evening of 15 June with winds of about 115 to 125 km/h. Gujarat had moved around one lakh people out of coastal Kutch, Devbhumi Dwarka and nearby districts in advance. The government reported no deaths in Gujarat from the landfall itself, although the storm’s wider impacts were deadly elsewhere along the coast and in Pakistan. Biparjoy also held up the monsoon’s progress over western India.
Tej and Hamoon (October 2023). Once again storms ran at the same time in both seas: Tej, an extremely severe cyclonic storm, hit Yemen on 24 October, and Hamoon, a very severe cyclonic storm, hit Bangladesh near Chittagong a day later.
Michaung (1 to 6 December 2023), severe cyclonic storm, landfall south of Bapatla. Concept: the slow storm and the city flood.
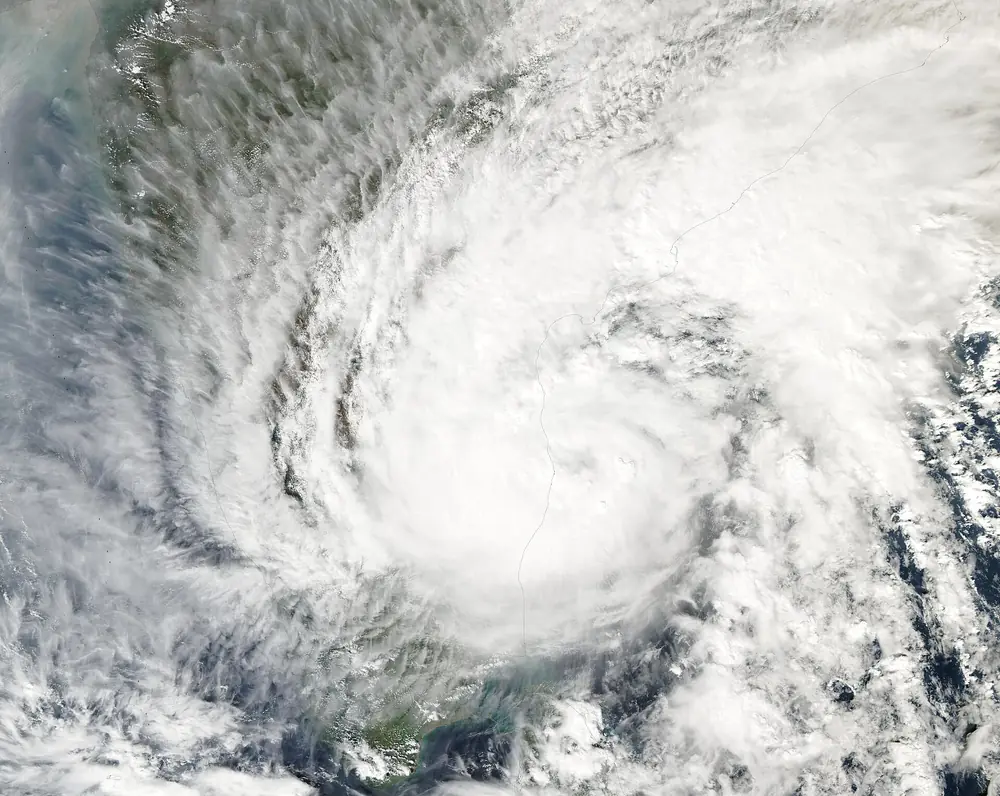

Michaung never became stronger than a severe cyclonic storm, but it crawled north just off the Chennai coast for two days before crossing the south Andhra coast near Bapatla on 5 December. Chennai’s Nungambakkam station recorded about 53 cm of rain over 2 to 4 December. The Adyar and Cooum rivers and the city’s lakes overflowed, the airport closed, and large parts of the city were under water for days. Tamil Nadu’s losses were estimated at well over ₹10,000 crore. In Andhra Pradesh, paddy ready for harvest was flattened across the Krishna and Godavari deltas.
2024: Remal, Asna, Dana, Fengal
Remal (24 to 28 May 2024), severe cyclonic storm, landfall on the West Bengal and Bangladesh coast. Concept: the remnant rain far from the coast. Remal crossed the coast between Sagar Island and Khepupara, near Mongla in Bangladesh, on the night of 26 May with winds of about 110 to 120 km/h. Most of the deaths were not on the coast but hundreds of kilometres away: its remnant rain set off landslides in Mizoram, including a stone quarry collapse near Aizawl, and dozens of people died across the north-eastern states.
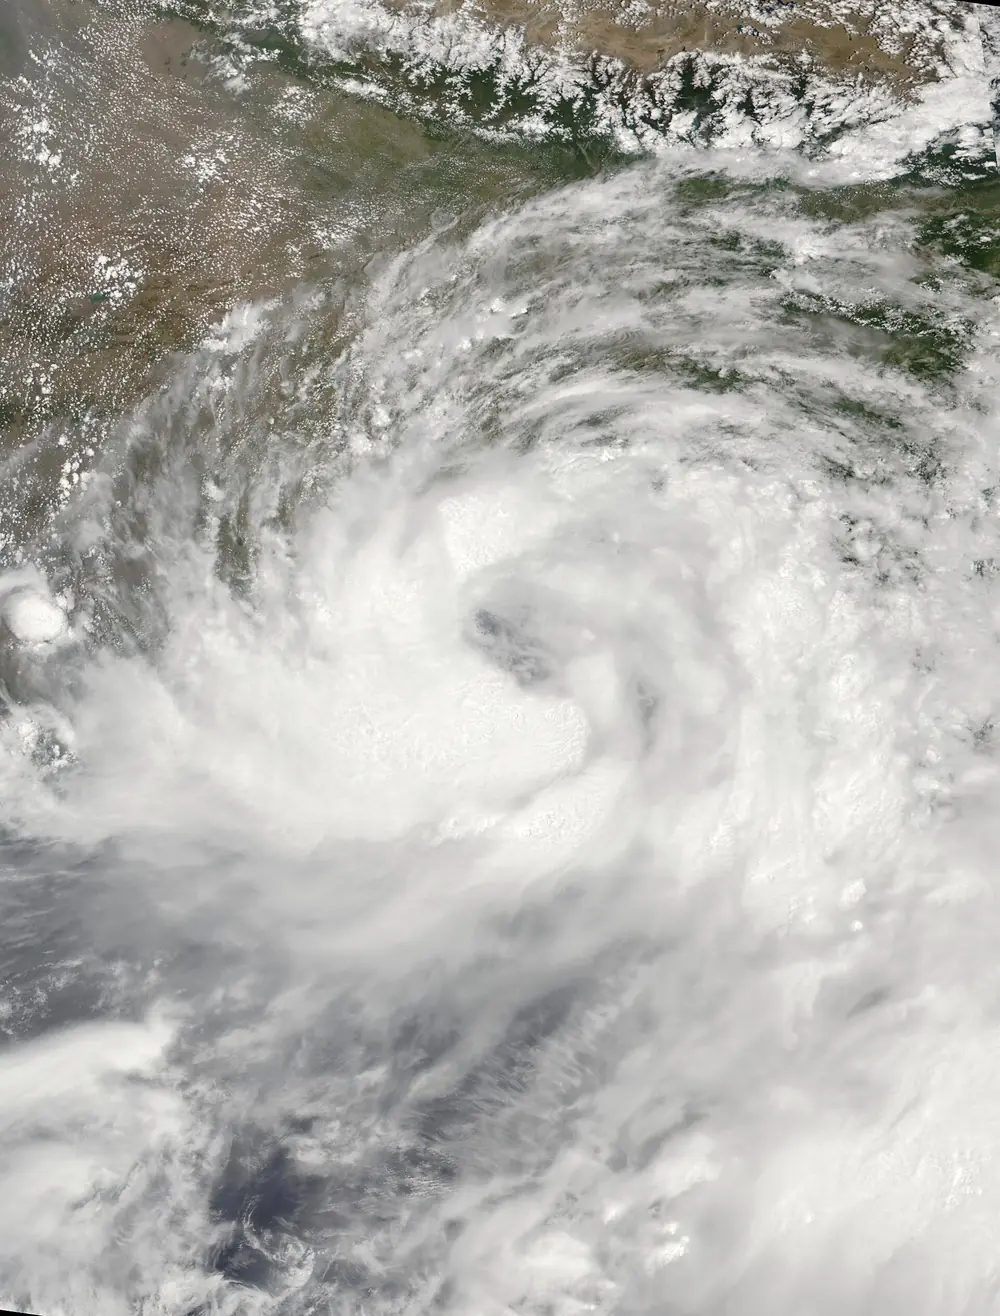

Asna (25 August to 2 September 2024), cyclonic storm. Concept: a cyclone born from land. Asna began as a depression over land in Rajasthan, drifted south-west across Gujarat while dropping torrential rain (it was a big part of the severe floods in Vadodara and Saurashtra that week), crossed the Rann of Kutch, and only reached cyclone strength once it was over the north-east Arabian Sea on 30 August. It then moved away towards Oman and weakened. A land depression turning into an Arabian Sea cyclone in August had been recorded only three times before, in 1944, 1964 and 1976.
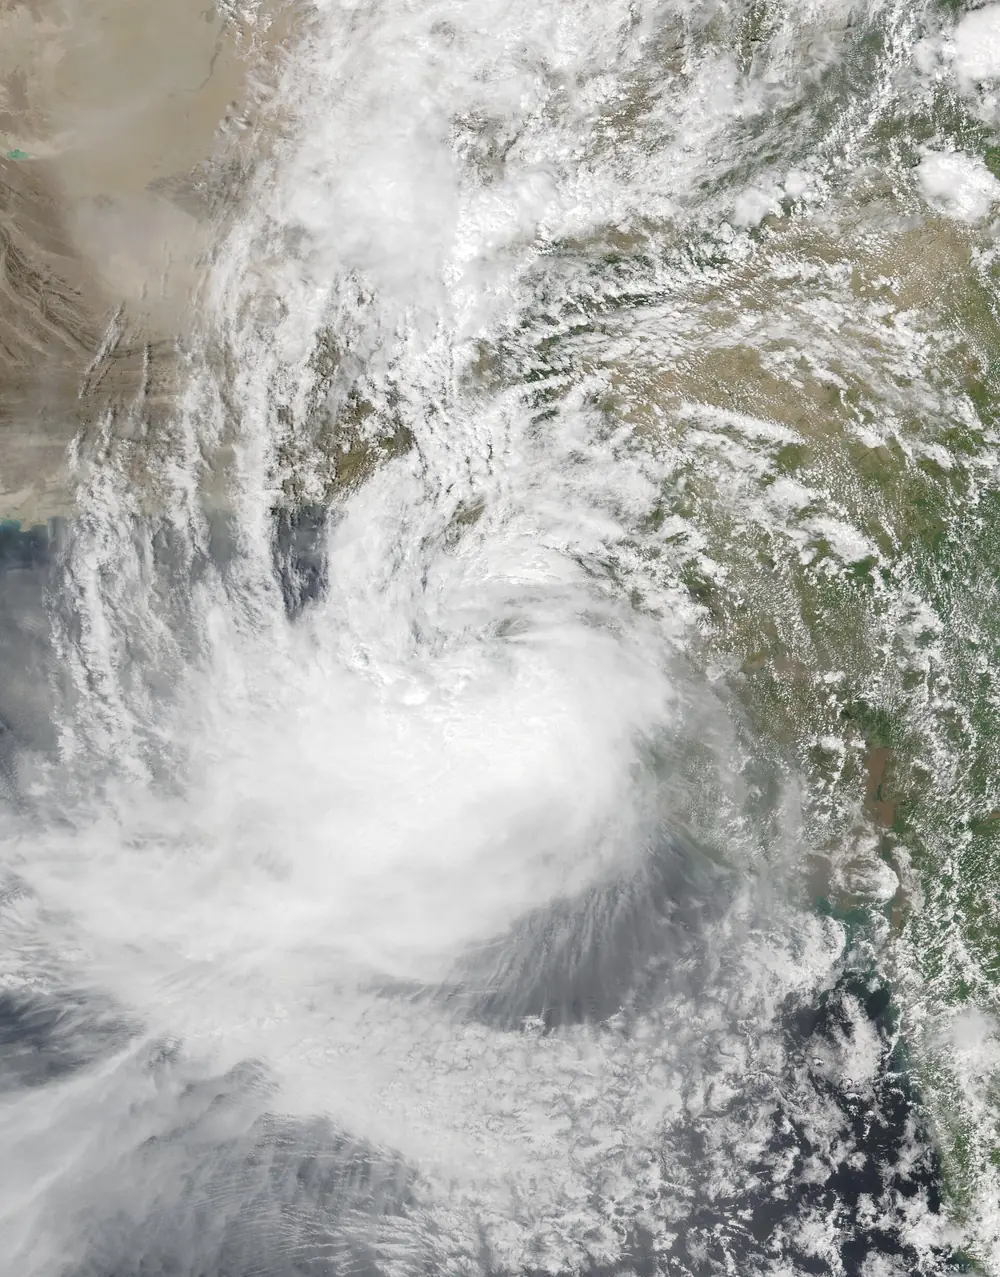

Dana (22 to 27 October 2024), severe cyclonic storm, landfall near Bhitarkanika and Dhamra, Odisha. Concept: zero-casualty evacuation.
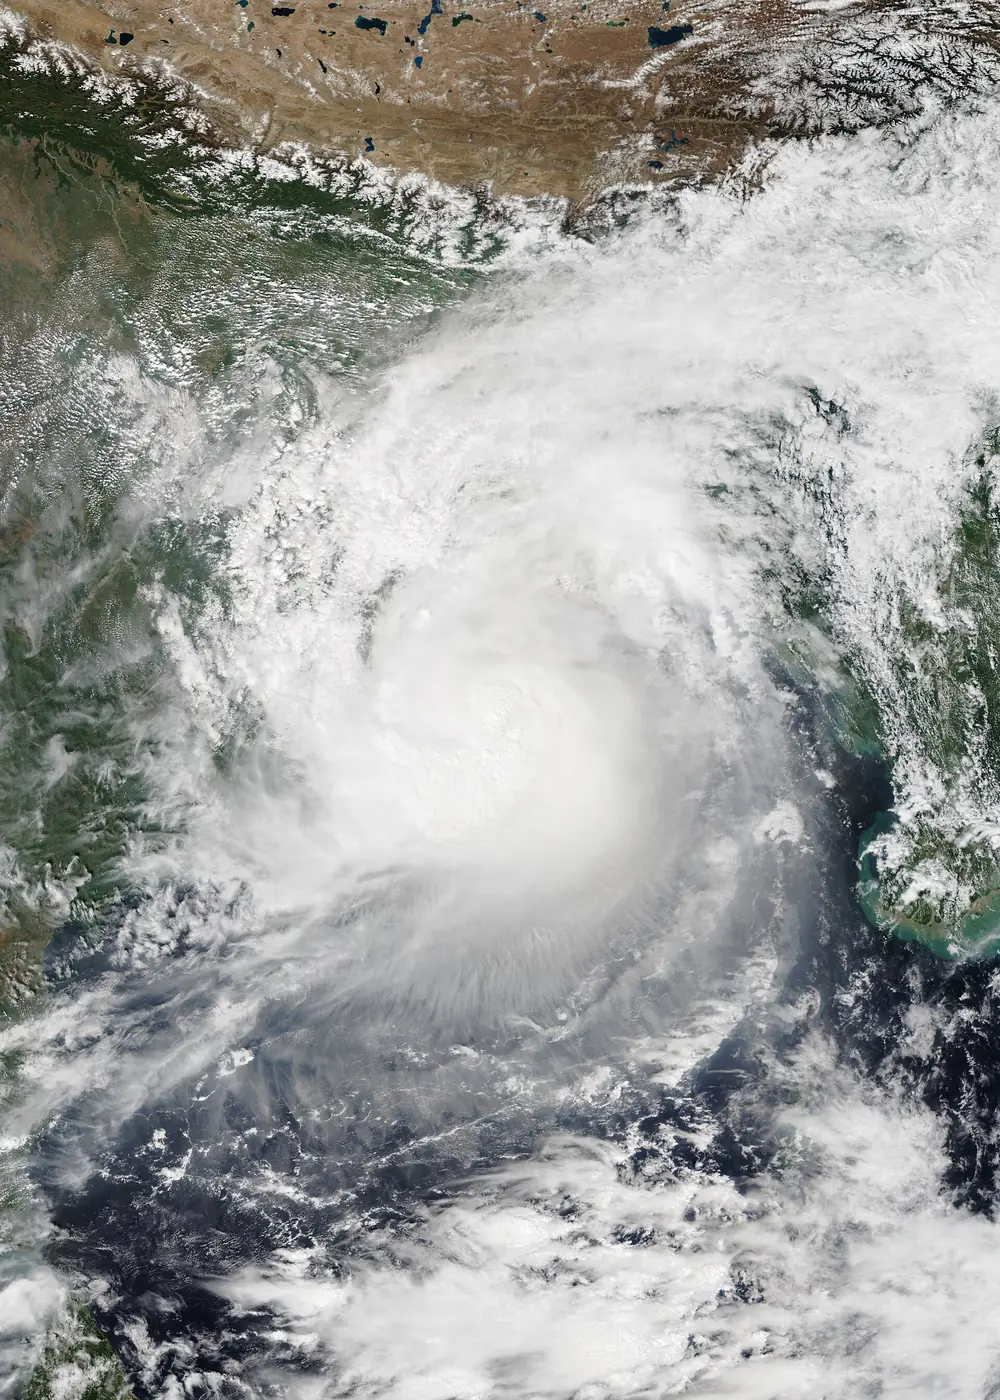

Dana crossed the north Odisha coast between Bhitarkanika national park and Dhamra port overnight on 24 and 25 October with winds of about 100 to 110 km/h. Odisha and West Bengal moved several lakh people out of harm’s way in advance. Odisha, which has refined its zero-casualty approach since 1999, reported very few deaths; the Ministry of Earth Sciences later cited Dana as a storm with zero deaths from the cyclone in the state.
Fengal (25 November to 4 December 2024), cyclonic storm, landfall near Puducherry. Concept: weak but slow, and therefore wet.
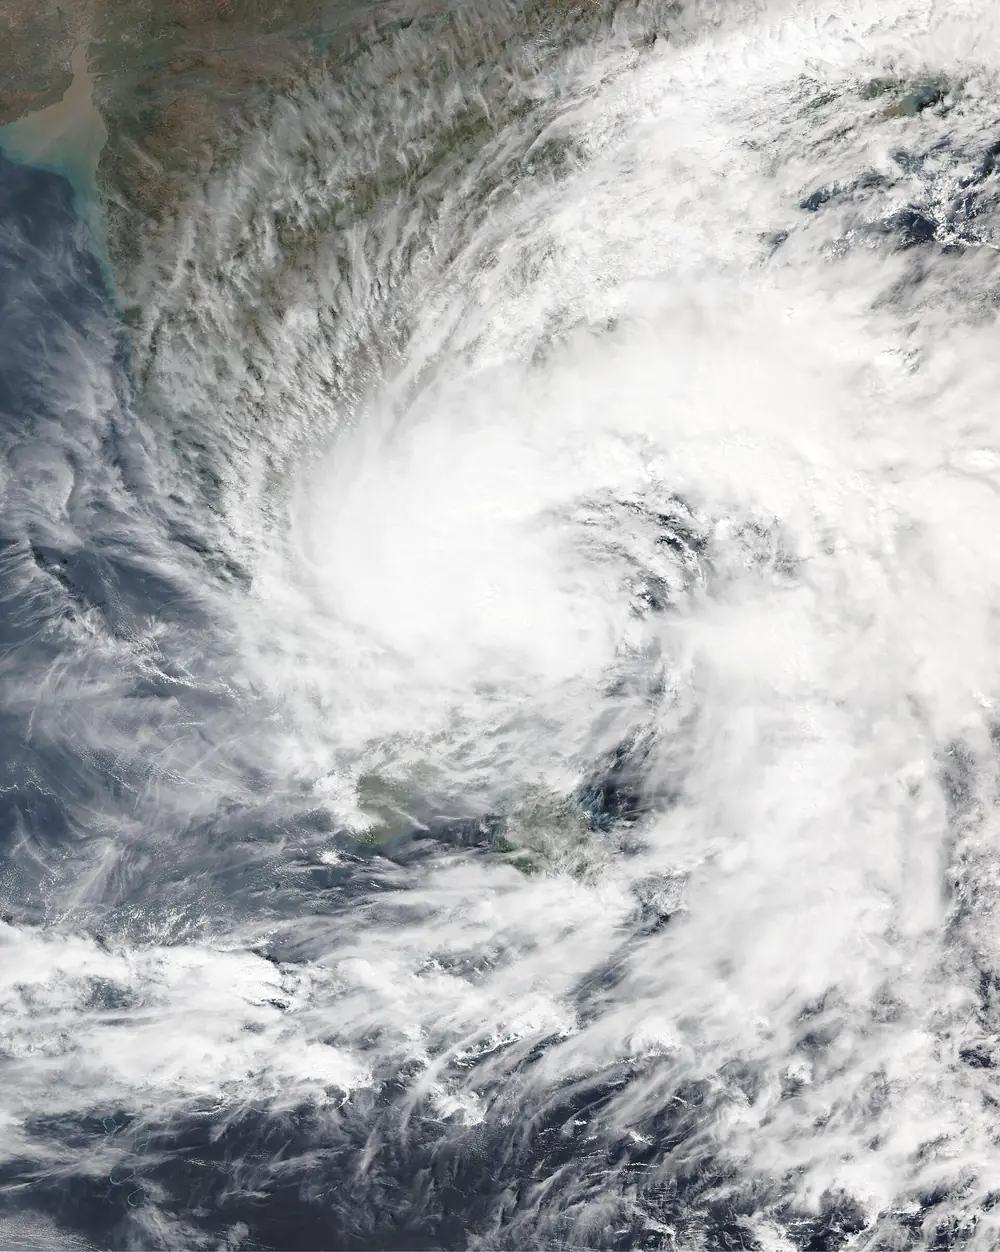

Fengal spent days as a depression before finally becoming a cyclonic storm on 29 November, peaking at only about 85 km/h. It crossed the coast close to Puducherry on the evening of 30 November and then nearly stalled. Over the next day it dumped extraordinary rain on Villupuram and the hills of the interior: around 50 cm in 24 hours at Mailam and at Uthangarai in Krishnagiri district. Rivers flooded, a landslide in Tiruvannamalai buried a house, and about twenty people died in India, with more in Sri Lanka. On the IMD ladder it was only one step above a deep depression.
2025: Shakhti, Montha, Senyar and Ditwah
Shakhti (1 to 7 October 2025), severe cyclonic storm. Concept: a Bay low reborn in the Arabian Sea. The leftover of a Bay of Bengal depression that crossed Odisha in late September drifted across India, reached the north-east Arabian Sea, and became Shakhti on 3 October. At about 110 km/h it was the strongest storm of 2025 by wind, but it moved away west and died off the coast of Oman.
Montha (25 to 30 October 2025), severe cyclonic storm, landfall near Narsapur, Andhra Pradesh. Concept: Andhra’s delta coast, and rain far inland.
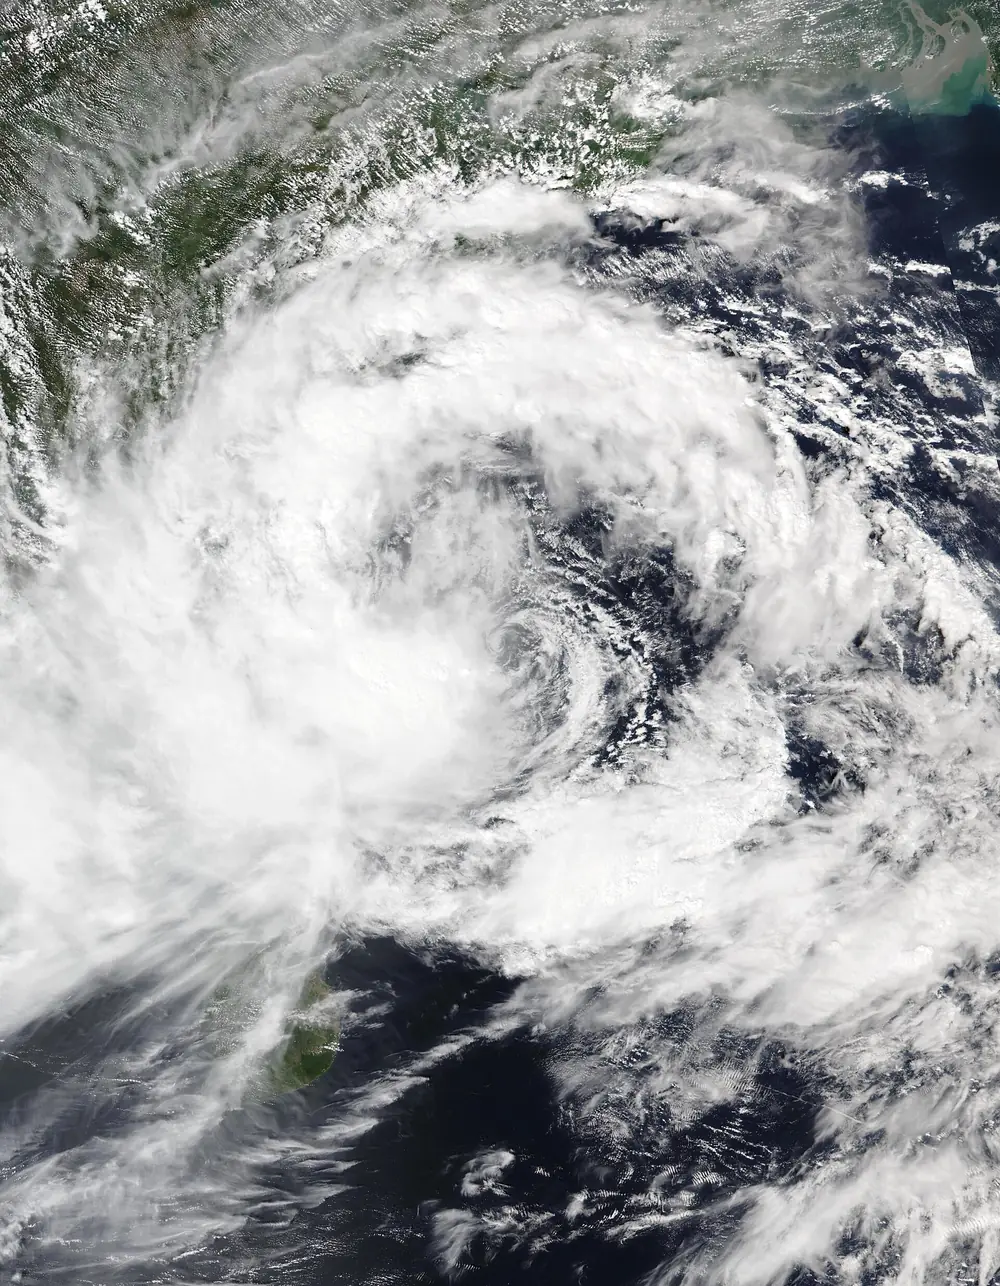

Montha formed over the south-east Bay of Bengal, moved north-west, and crossed the Andhra Pradesh coast near Narsapur in West Godavari district on the night of 28 October as a severe cyclonic storm of about 90 to 100 km/h. Tens of thousands of people in Andhra Pradesh and Odisha had already been moved to shelters. The wind damage in the Godavari and Krishna deltas was serious but limited. The rain was not: as Montha’s remnant moved into Telangana, Bheemadevarpalle recorded about 42 cm in roughly a day, and floods swept through Warangal and Hanamkonda. Most of the deaths were in Telangana, not on the coast.
Senyar (late November 2025), cyclonic storm, landfall in Sumatra. Concept: a storm where none had formed before. Senyar formed in the Strait of Malacca, between Malaysia and Sumatra, the first cyclone recorded forming there, and IMD tracked and named it as part of its regional duty. Its rain caused catastrophic floods and landslides in Indonesia and southern Thailand, killing well over a thousand people. By damage estimate it became the costliest cyclone ever recorded in the North Indian Ocean basin, overtaking Amphan.
Ditwah (26 November to 3 December 2025), cyclonic storm, Sri Lanka and Tamil Nadu. Concept: forecast accuracy, and slowness again.
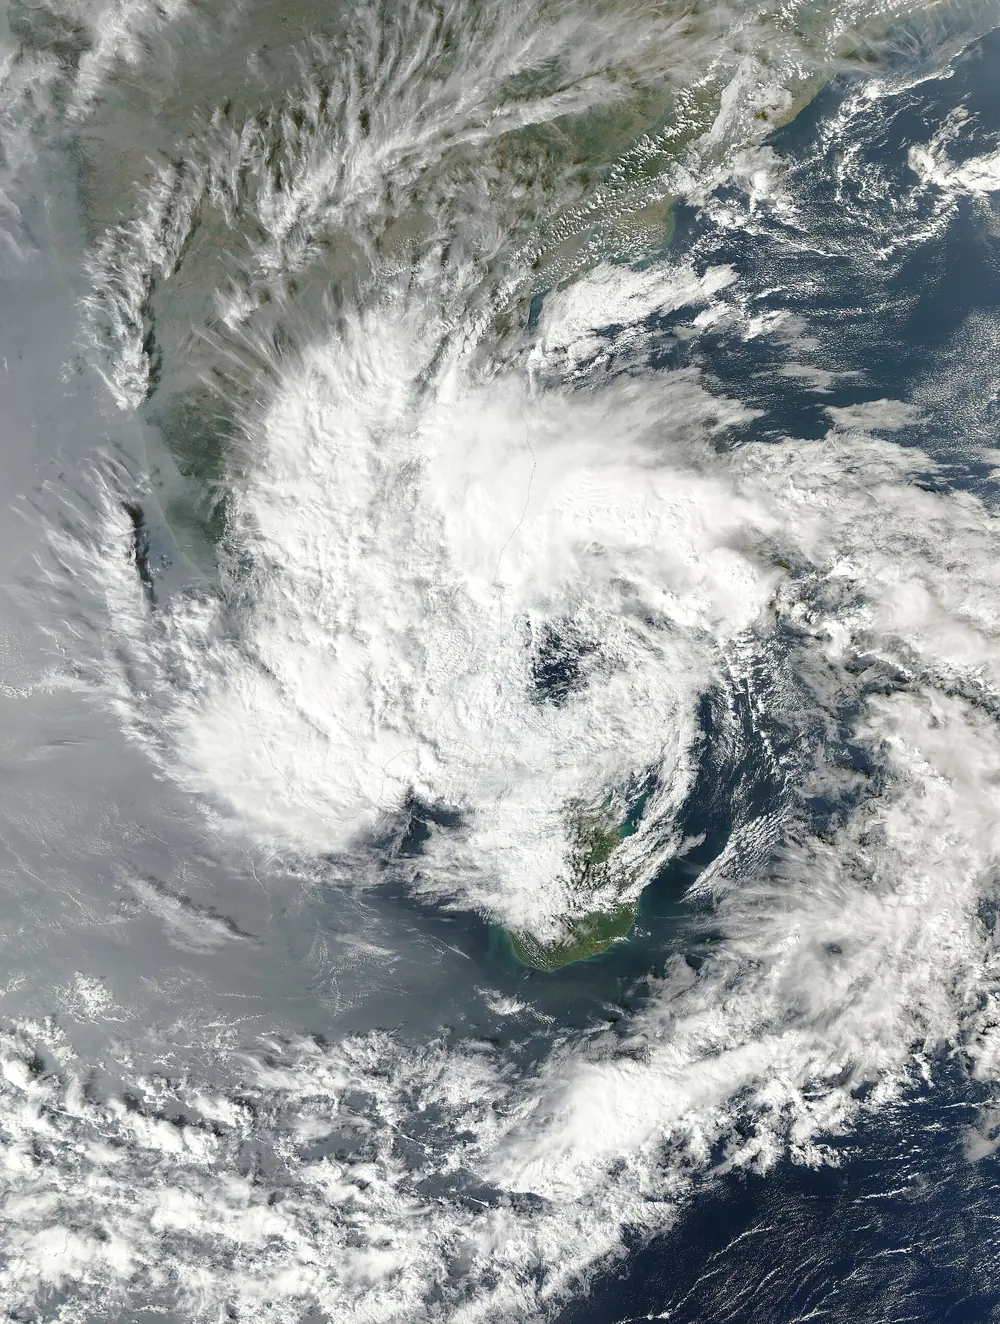

Ditwah formed just off south-east Sri Lanka and crawled across the island over several days, bringing floods and landslides that killed several hundred people, one of Sri Lanka’s worst weather disasters in decades. It then moved north, parallel to the Tamil Nadu coast, weakening to a deep depression near Chennai. IMD’s track forecasts for Ditwah were among its best ever, with errors of about 49 km a day ahead and 60 km three days ahead, a sign of how far forecasting has come since Hudhud.
2026 so far: depressions, and a cyclone possibly on the way
As of 24 October 2026, the North Indian Ocean has not had a single storm of cyclone strength this year. That does not mean it has been quiet:
- A deep depression (BOB 01) crossed Sri Lanka in January.
- A deep depression over the north Bay in late July (BOB 03) moved inland across central India and was linked to 31 deaths in Odisha, Chhattisgarh, Maharashtra, Telangana, Gujarat and Rajasthan, from building collapses, lightning and floods.
- In the last week of September, a deep depression crossed the north Andhra and south Odisha coast near Kalingapatnam. Its rain hit south Odisha’s hill districts hardest; Semiliguda in Koraput recorded 23 cm in a day, and about 5,000 people in Gajapati district were moved to shelters.
Live: the Bay of Bengal depression is on its own page, refreshed every 6 hours from IMD bulletins until landfall, with a track map and a satellite view: open the live page.
At 11:30 pm IST on 24 October 2026, IMD reported the depression near 15.5°N, 91.0°E, forecast to become a cyclonic storm by the morning of 26 October and to cross the Andhra Pradesh coast between Bapatla and Visakhapatnam as a very severe cyclonic storm by the forenoon of 28 October.
If you live on the Andhra Pradesh or south Odisha coast, this is the time to do the “Cyclone alert” checklist in Part 10, and to follow only IMD and your district administration for the landfall forecast. Model guesses circulating on social media are not warnings.
For the latest position and warnings, follow IMD (mausam.imd.gov.in) and your district administration.
Twelve years in one table
| Storm | Dates | Basin | Peak IMD class (approx. peak wind) | Where it crossed the coast | What it teaches |
|---|---|---|---|---|---|
| Hudhud | Oct 2014 | Bay | ESCS (185 km/h) | Visakhapatnam | Landfall at peak; urban destruction |
| Nilofar | Oct 2014 | Arabian | ESCS (205 km/h) | None (died before Gujarat) | Shear and dry air kill storms |
| Vardah | Dec 2016 | Bay | VSCS (130 km/h) | Chennai | Cyclone in a metropolis |
| Ockhi | Nov–Dec 2017 | Bay to Arabian | VSCS (155 km/h) | None in India as a cyclone | Genesis close to land; fishermen |
| Titli | Oct 2018 | Bay | VSCS (150 km/h) | Near Palasa, Srikakulam | Recurvature; inland landslides |
| Gaja | Nov 2018 | Bay | VSCS (130 km/h) | Nagapattinam–Vedaranyam | Surge; crops; crossing the peninsula |
| Fani | Apr–May 2019 | Bay | ESCS (215 km/h) | Puri | Mass evacuation works |
| Vayu | Jun 2019 | Arabian | VSCS (150 km/h) | None | Track uncertainty; monsoon delay |
| Kyarr | Oct–Nov 2019 | Arabian | SuCS (240 km/h) | None | Arabian Sea extremes |
| Bulbul | Nov 2019 | Bay | VSCS (140 km/h) | Near Sagar Island | Pacific storm reborn |
| Amphan | May 2020 | Bay | SuCS (240 km/h) | Near Bakkhali, West Bengal | Rapid intensification; pandemic evacuation |
| Nisarga | Jun 2020 | Arabian | SCS (110 km/h) | Near Alibag | Near miss for Mumbai |
| Nivar | Nov 2020 | Bay | VSCS (120 km/h) | Near Puducherry | Reservoir management |
| Tauktae | May 2021 | Arabian | ESCS (185 km/h) | Near Diu | Parallel track; danger at sea |
| Yaas | May 2021 | Bay | VSCS (140 km/h) | North of Dhamra | Storm tide at full moon |
| Gulab / Shaheen | Sep–Oct 2021 | Bay, then Arabian | CS / SCS | Kalingapatnam; then Oman | Regeneration |
| Mocha | May 2023 | Bay | ESCS (215 km/h) | Near Sittwe, Myanmar | IMD’s regional role |
| Biparjoy | Jun 2023 | Arabian | ESCS (about 167 km/h) | Near Jakhau | Long life; zero-casualty planning |
| Michaung | Dec 2023 | Bay | SCS (about 100 km/h) | South of Bapatla | Slow storm floods a city |
| Remal | May 2024 | Bay | SCS (110 km/h) | Sagar Island–Khepupara | Remnant rain far inland |
| Asna | Aug 2024 | Land to Arabian | CS (75 km/h) | None | A cyclone born over land |
| Dana | Oct 2024 | Bay | SCS (110 km/h) | Bhitarkanika–Dhamra | Zero-casualty evacuation |
| Fengal | Nov–Dec 2024 | Bay | CS (85 km/h) | Near Puducherry | Weak and slow means very wet |
| Montha | Oct 2025 | Bay | SCS (about 95 km/h) | Near Narsapur | Rain far inland (Telangana) |
| Ditwah | Nov–Dec 2025 | Bay | CS (75 km/h) | Sri Lanka | Forecast accuracy; slow-moving rain |
| Not yet named (Oct 2026 depression) | Oct 2026 | Bay | Forecast to become a VSCS | Forecast Andhra Pradesh, between Bapatla and Visakhapatnam | Live as this is written |
Part 9: A warming ocean, and what is changing
The Arabian Sea is heating up
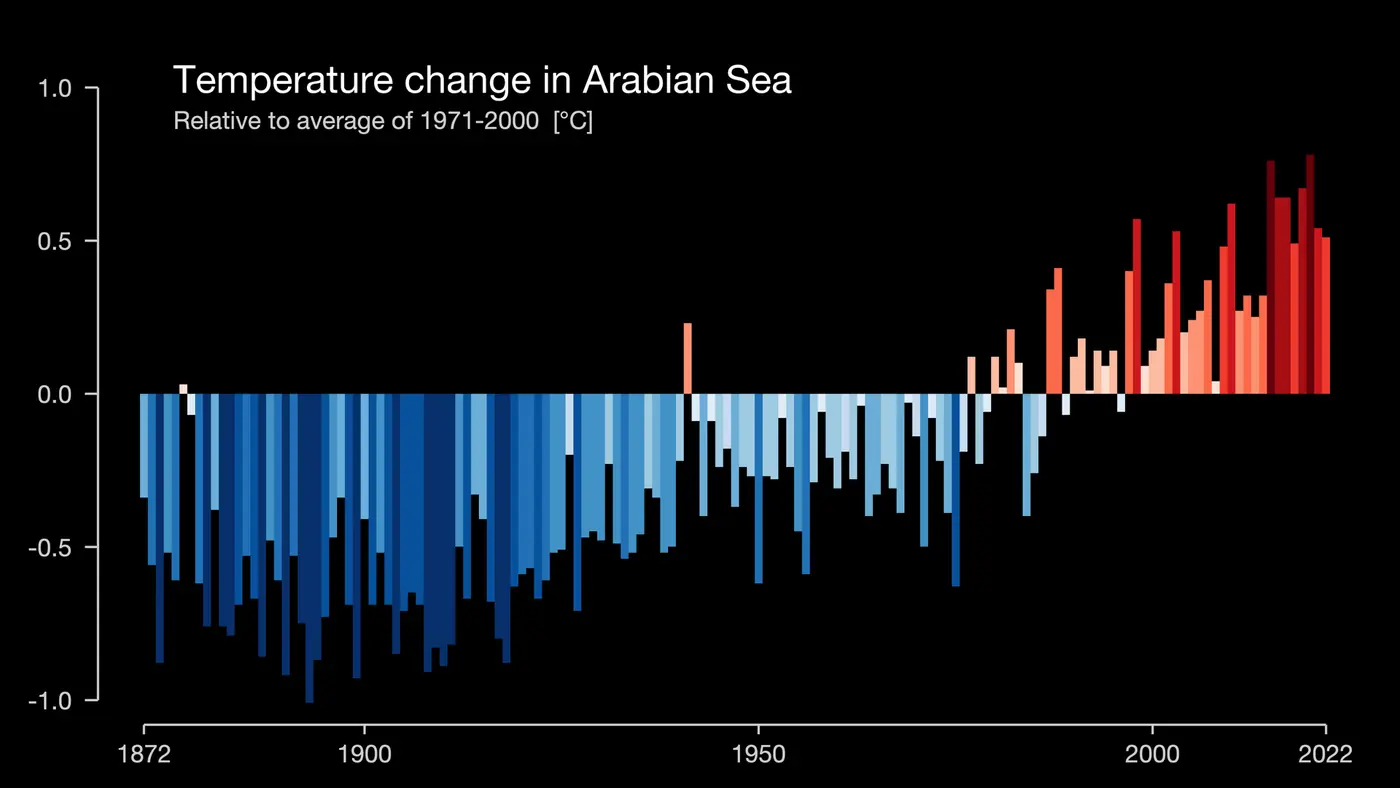

The chart above, one of climate scientist Ed Hawkins’s “warming stripes” graphics, shows yearly temperatures over the Arabian Sea region. The pattern needs no explanation: blue for most of the twentieth century, red since about 2000. Scientists at the Indian Institute of Tropical Meteorology in Pune have reported that parts of the Arabian Sea warmed by about 1.2 to 1.4 °C over recent decades, faster than the global ocean average.
Warmer water means more fuel. The IITM study by Medha Deshpande, Roxy Mathew Koll and colleagues, published in Climate Dynamics in 2021, compared the recent two decades, 2001 to 2019, with 1982 to 2000. In the Arabian Sea, cyclonic storms became about 52 per cent more frequent, very severe cyclones about 150 per cent more frequent, storm lifetimes grew by about 80 per cent, and the total accumulated cyclone energy roughly tripled. Over the Bay of Bengal the number of cyclones dipped slightly, by about 8 per cent, and their duration and energy showed no significant change.
The storms since 2019 fit that trend. Kyarr became the strongest Arabian Sea cyclone in years. Tauktae became the strongest to hit Gujarat since 1998. Biparjoy set a basin record for accumulated energy. And in our count, 20 of the 55 named storms of 2014 to 2025 formed in the Arabian Sea, much higher than the historical share.
What scientists expect, and what they do not
Climate science is more confident about some cyclone changes than others. In plain terms:
- More rain per storm. A warmer atmosphere holds about 7 per cent more water vapour for each degree Celsius of warming, so storms can produce heavier rain. This is the most confident projection, and it matches the recent run of very wet storms like Michaung, Fengal and Montha.
- Higher storm surge, even with the same storms. Sea level along Indian coasts is rising. Every centimetre of higher sea is a centimetre more of surge reaching further inland.
- A larger share of storms reaching the top categories, and more frequent rapid intensification over very warm water.
- Slower-moving storms, which some studies have found globally, would mean more rain in one place.
What is less certain is whether the total number of cyclones will rise or fall. Globally, many models project the same or fewer storms, with a larger share of intense ones. In the North Indian Ocean, the Arabian Sea’s recent increase is clear in the observations, but natural year-to-year swings are large, and twelve years is a short window. It is honest to say the risk is rising, and wise to plan as though it is, without pinning any single storm entirely on climate change.
What this means for India’s coasts
The east coast’s risk has always been dominated by surge on flat deltas. The west coast’s risk used to be modest. That is changing: Mumbai, Goa, Mangaluru, Kochi and the Gujarat coast now see more cyclones threaten them than they did a generation ago. The planning, shelters and drills that Odisha and Andhra Pradesh built over decades are now being extended along the west coast, and the lessons of Ockhi, Tauktae and Biparjoy are shaping them.
Part 10: What the words should make you do
Every concept in this guide comes down to a decision on the ground. Here is a practical translation, written for someone living on India’s east or west coast. Always follow your district administration’s orders; this list is general.
At “depression” or “deep depression” over the sea
- Note it and start following IMD’s bulletins (mausam.imd.gov.in, the Mausam app, or IMD’s official social media).
- If you have family who fish, make sure they know. Fishermen should not go out, and those at sea should return.
- Nothing more is needed on land yet, unless your area is under a heavy rain warning.
At “cyclone alert” (yellow, about 48 hours before bad weather)
- Charge phones and power banks. Keep a battery radio if you have one.
- Store drinking water for at least three days and some ready-to-eat food.
- Keep medicines, documents (Aadhaar, ration card, property papers, certificates) and some cash in a waterproof bag.
- Know where your nearest cyclone shelter or safe building is and how you would get there.
- Bring in or tie down anything that can fly: tin sheets, flower pots, dish antennas, loose boards.
- Trim dead branches near the house if you can do it safely.
At “cyclone warning” (orange, about 24 hours before)
- If you live in a kutcha house, near the sea, or in a low-lying area named for evacuation, go when asked. Do not wait to see how bad it gets. Most surge deaths happen to people who stayed.
- Fill the vehicle’s tank. Park away from trees and hoardings.
- Switch off and unplug appliances when the wind rises. Know how to switch off your main power.
- Stay indoors once the wind starts. Choose a room away from windows, ideally on an inner wall.
When the eye passes
If the wind suddenly drops and the sky clears for a while during a severe storm, you may be in the eye. Do not go out. In 30 minutes to an hour the other side of the eyewall will arrive, with the wind blowing just as hard from the opposite direction. Many injuries happen to people who went out to look.
After the storm
- Wait for the official all-clear.
- Stay away from fallen power lines and waterlogged areas near them. Electrocution is one of the most common post-cyclone causes of death.
- Do not drive or walk through floodwater. Fifteen centimetres of moving water can knock a person down; sixty centimetres can float a car.
- Drink boiled or treated water until supplies are declared safe.
- Watch for snakes and scorpions pushed out by the water.
- Photograph damage for insurance and government compensation before you clear it.
Five myths that get people hurt
- “It is only a depression, so it is not serious.” Depressions and deep depressions caused some of the deadliest floods in this guide, from Chennai in 2015 to the 31 deaths of July 2026. The class tells you the wind, not the rain.
- “The storm is weakening, so the danger is over.” Weakening after landfall reduces wind, but the rain often continues and moves inland. Montha’s worst floods were in Telangana, a day after landfall.
- “The landfall is far from us.” A cyclone’s rain and wind extend 300 to 500 km from the centre. The surge is worst to the right of the track. Yaas flooded villages in West Bengal far from where it crossed in Odisha.
- “The calm means it is over.” See the eye, above.
- “Forecasts are always wrong, so we will wait and see.” IMD’s 24-hour track forecast errors averaged about 72 km over 2020 to 2024, and were under 50 km for Ditwah in 2025. The forecast cone exists precisely because uncertainty is real; act on the whole cone, not just the line.
Part 11: Glossary of weather terms
These are the words you will meet in IMD bulletins, news reports and this guide, in alphabetical order.
| Term | Meaning |
|---|---|
| Accumulated cyclone energy (ACE) | A measure of a storm’s total wind energy over its life, combining strength and duration. Biparjoy holds the North Indian Ocean record. |
| Barrier layer | A stable layer in the upper ocean, created by fresh river water on top of salty water, that stops a storm stirring up cold water. Common in the Bay of Bengal. |
| BOB / ARB / LAND numbers | IMD’s labels for depressions in the Bay of Bengal, the Arabian Sea and over land, numbered through the year. |
| Central dense overcast (CDO) | The solid shield of high cloud over a cyclone’s centre. |
| CI number | Current intensity number in the Dvorak method; the T-number adjusted for recent trends. |
| Cone of uncertainty | The shaded area around a forecast track showing where the centre may go. It does not show the storm’s size. |
| Coriolis effect | The apparent deflection of moving air caused by Earth’s rotation; it makes cyclones spin. |
| Crossing the coast | IMD’s phrase for landfall. |
| Cyclone alert / warning | The second and third stages of IMD’s four-stage warning (yellow and orange). |
| Cyclonic circulation | A spin in the wind, at the surface or aloft, that may develop into a low. |
| Cyclonic storm (CS) | Sustained winds 62 to 88 km/h; the stage at which a storm is named. |
| Deep depression (DD) | Sustained winds 50 to 61 km/h. |
| Depression (D) | Sustained winds 31 to 49 km/h; the first stage with a defined, tracked centre. |
| Direct hit | When the eyewall passes over a place, whether or not the centre crosses the coast. |
| Doppler weather radar (DWR) | A radar that measures both rain (reflectivity) and the speed of rain towards or away from it (radial velocity). |
| Dvorak technique | The satellite-pattern method for estimating cyclone strength on a T1.0 to T8.0 scale. |
| El Niño / La Niña (ENSO) | Warming or cooling of the eastern tropical Pacific that shifts weather patterns worldwide, including cyclone odds in the Indian Ocean. |
| Ensemble | Many runs of a forecast model with slightly different starting conditions, used to judge uncertainty. |
| Extremely severe cyclonic storm (ESCS) | Sustained winds 167 to 221 km/h. |
| Eye | The calm centre of a cyclone, where air sinks and pressure is lowest. |
| Eyewall | The ring of intense thunderstorms around the eye, with the strongest winds. |
| Eyewall replacement cycle | A new eyewall forms outside the old one and replaces it; peak winds dip, the wind field widens. |
| Gust | A brief burst of wind stronger than the sustained wind. |
| hPa (hectopascal) | The unit of air pressure. Normal sea level is about 1,010 hPa. |
| IBTrACS | The International Best Track Archive for Climate Stewardship, a global database of official storm tracks. |
| Indian Ocean Dipole (IOD) | A difference in sea temperature between the western and eastern Indian Ocean that affects rain and cyclones. |
| Infrared satellite image | A picture showing cloud-top temperature; the coldest tops are the tallest storms. |
| ITCZ | The Inter-Tropical Convergence Zone, a belt of rising air and showers near the equator where many cyclones begin. |
| Knot (kt) | One nautical mile per hour, 1.852 km/h. |
| Landfall | When the centre of a cyclone crosses the coastline. |
| Latent heat | Heat released when water vapour condenses; the fuel of a cyclone. |
| Low pressure area (LPA) | A region of lower pressure with one closed isobar and winds under 31 km/h. |
| Madden-Julian Oscillation (MJO) | A pulse of cloud and rain that moves east around the tropics every 30 to 60 days and boosts cyclone formation in its wet phase. |
| Monsoon depression | A low that forms at the head of the Bay of Bengal during the monsoon and moves inland, bringing heavy rain. |
| Monsoon trough | The elongated low-pressure zone across north India during the monsoon. |
| NWP | Numerical weather prediction, forecasting with computer models of the atmosphere. |
| Outer band | The farthest spiral rain band, often the first sign of a cyclone on the coast. |
| Outflow | Air flowing out from the top of a cyclone, 12 to 16 km up. |
| Port warning signal | The numbered signals (I to XI) hoisted at ports to warn ships. |
| Post-landfall outlook | The fourth stage of IMD’s warnings (red), for districts inland of the landfall point. |
| Pre-cyclone watch | The first stage of IMD’s warnings, about 72 hours ahead, for officials. |
| Radial velocity | The speed of rain moving directly towards or away from a radar. |
| Radius of maximum wind (RMW) | The distance from the centre to the strongest winds. |
| Rapid intensification | A rise of at least 30 knots (about 55 km/h) in sustained wind within 24 hours. |
| Recurvature | A cyclone’s turn from a westward to a northward and then north-eastward track. |
| Reflectivity (dBZ) | How strongly rain reflects a radar pulse; a measure of rain intensity. |
| Remnant low | What is left of a cyclone after it weakens below depression strength. It can still bring heavy rain. |
| RSMC | Regional Specialised Meteorological Centre. IMD New Delhi is the RSMC for tropical cyclones in the North Indian Ocean. |
| Scatterometer | A satellite radar that measures wind over the ocean from the roughness of the sea surface. |
| Severe cyclonic storm (SCS) | Sustained winds 89 to 117 km/h. |
| Spiral rain band | A long curved band of thunderstorms winding into the centre. |
| Steering current | The large-scale wind that carries a cyclone along. |
| Storm surge | The rise of sea level above the normal tide caused by a cyclone. |
| Storm tide | Storm surge plus the astronomical tide. |
| Subtropical ridge | The belt of high pressure to the north that steers cyclones west. |
| Super cyclonic storm (SuCS) | Sustained winds 222 km/h or more. |
| Sustained wind | Wind averaged over a set period: 3 minutes for IMD, 1 minute for JTWC, 10 minutes for most other agencies. |
| T-number | The Dvorak intensity number, from T1.0 to T8.0. |
| Tropical cyclone heat potential | The heat stored in ocean water warmer than 26 °C; a measure of fuel available at depth. |
| Upper air cyclonic circulation | A spin in the wind a few kilometres above the surface; often the first sign in bulletins. |
| Upwelling | Cold water rising from depth, as off Somalia and Oman in the monsoon, which cools the Arabian Sea. |
| Very severe cyclonic storm (VSCS) | Sustained winds 118 to 166 km/h. |
| Warm core | The warm centre of a tropical cyclone, created by sinking air in the eye and released latent heat. |
| Well-marked low (WML) | A deeper low, clearly visible on weather maps, still below depression strength. |
| Wind shear | The change of wind speed or direction with height; strong shear tears cyclones apart. |
One-minute recap
| Concept | In one line | Real-world example |
|---|---|---|
| Low pressure area to super cyclone | IMD’s ladder from under 31 km/h to 222 km/h and above, by 3-minute sustained wind | Our October 2026 low, forecast to become a cyclonic storm |
| Naming | A storm is named only on becoming a cyclonic storm, from a 169-name list that is never reused | The next name on the list is Arnab, from Bangladesh |
| Ingredients | Warm deep water, moist air, low shear, latitude, a starting disturbance | Nilofar died when shear and dry air arrived |
| Structure | Eye, eyewall, rain bands, central dense overcast, outflow | Hudhud’s small sharp eye at landfall |
| Two seas | Bay: more storms, deadly surge. Arabian Sea: fewer but warming fast | 20 of 55 storms in 2014–2025 formed in the Arabian Sea |
| Seasons | Peaks in May and October to December; few in the monsoon | 25 of 55 storms formed in October or November |
| Rapid intensification | 55 km/h or more of extra wind in 24 hours | Amphan, about 120 km/h in a day |
| Recurvature | A turn north and north-east as the steering winds change | Titli’s turn into Odisha |
| Landfall | The centre crosses the coast; damage starts hours before | Fani at Puri, 3 May 2019 |
| Right-front quadrant | The side of the track with the strongest onshore winds and surge | Yaas flooding West Bengal villages |
| Storm surge and tide | Sea pushed onshore, worst on shallow coasts and at high tide | Gaja’s 1.8 m surge at Kodikkarai |
| Satellites and radar | Satellites for the whole storm; Doppler radar for the close-up | The Kailasagiri radar in Visakhapatnam |
| Forecast accuracy | Average 24-hour track error about 72 km (2020–2024) | Ditwah: 49 km at 24 hours |
| Warnings | Pre-cyclone watch, alert (yellow), warning (orange), post-landfall outlook (red) | Odisha’s zero-casualty evacuations |
| Rain is the wildcard | Slow, weak storms can be the wettest | Fengal’s 50 cm in a day |
| Climate change | More rain, higher surge base, a more active Arabian Sea | Kyarr, Tauktae, Biparjoy |
The takeaway
The words in a cyclone bulletin are not jargon for its own sake. Each one marks a threshold where the risk, and the right response, changes. A low is a note in the diary. A depression is a call to the fishermen in the family. A cyclone alert is the time to pack documents and fill water cans. A cyclone warning is the time to leave if you are told to. And after the eye passes, the time to stay put.
Twelve years of storms, from Hudhud to today’s depression, also tell a hopeful story. Storms as strong as the ones that killed thousands in 1977 and 1999 now kill dozens or fewer, because forecasts are better, warnings reach people, and states like Odisha and Andhra Pradesh have learned to move lakhs of people within a day or two. The ocean is getting warmer and the storms wetter. The answer is to keep doing what has worked, on both coasts.
References and further reading
Official and scientific sources
- India Meteorological Department, RSMC New Delhi, Frequently Asked Questions on Tropical Cyclones: the IMD intensity scale, Dvorak numbers, landfall and storm surge definitions, surge-prone coasts and port warning signals.
- India Meteorological Department, RSMC New Delhi, Four Stage Warning: timing and colours of the cyclone warning stages.
- NOAA National Centers for Environmental Information, International Best Track Archive for Climate Stewardship (IBTrACS): the track and intensity data behind this guide’s maps and charts (version v04r01, New Delhi RSMC values).
- Ministry of Earth Sciences, Lok Sabha reply on Doppler weather radars, 7 August 2024: the list of 39 radars by state.
- Ministry of Earth Sciences, Rajya Sabha reply on early warnings by IMD, 19 March 2026: track and intensity forecast errors, Ditwah, Mission Mausam.
- Deshpande, M., Singh, V. K., Ganadhi, M. K., Roxy, M. K., Emmanuel, R. and Kumar, U. (2021), Changing status of tropical cyclones over the north Indian Ocean, Climate Dynamics.
- Eos (American Geophysical Union), Climate change is making India’s west coast more vulnerable to cyclones (2021).
- World Meteorological Organization, New list of names issued for tropical cyclones over north Indian Ocean (2020).
- Natural Earth, public domain map data: coastlines and borders for every map in this guide.
Storm summaries and the 2026 season
- Wikipedia, 2025 North Indian Ocean cyclone season and 2026 North Indian Ocean cyclone season: season overviews with links to IMD reports.
- ETV Bharat, IMD: low pressure over Bay of Bengal likely to intensify into cyclonic storm by October 26 (23 October 2026): the forecast summarised in the live box.
- ANI, IMD forecasts cyclonic storm over Bay of Bengal by Oct 26, projected to reach Andhra coast on Oct 28 (24 October 2026): the latest IMD status in the live box.
- India TV News, Deep depression moves towards the Odisha and Andhra coast (September 2026): the late-September deep depression and its rain in south Odisha.
Books
- Kerry Emanuel, Divine Wind: The History and Science of Hurricanes (Oxford University Press, 2005): a beautifully illustrated, readable account of how tropical cyclones work.
- World Meteorological Organization, Global Guide to Tropical Cyclone Forecasting (WMO-No. 1194, 2017): the forecaster’s handbook, freely available from WMO.
- National Disaster Management Authority, National Guidelines on Management of Cyclones (2008): India’s framework for cyclone preparedness and response.
Image credits
Charts, maps and diagrams marked “by Claude for mrvitej.in” were drawn for this guide from the sources above. Satellite photographs from NASA and NOAA are in the public domain. Other photographs are credited in their captions with their Creative Commons licences and link to their pages on Wikimedia Commons.