
Fluentd is an open source data collector that gives a platform a single logging layer. Instead of every application writing to its own file format and every backend needing its own agent, Fluentd reads logs from many sources, turns them into structured records, and sends them to one or more destinations. Records carry a tag that decides how they are filtered and routed, and a buffer on disk holds them while a destination is slow or down. It solves the usual log pipeline problems: unstructured text, many output systems and data loss during outages. Fluentd was created in 2011 by Sadayuki Furuhashi at Treasure Data and is written in Ruby, with performance-sensitive parts in C. The CNCF accepted it on 8 November 2016, and it became the sixth project to graduate, on 11 April 2019.
CNCF daily · Sprint 3, post 18 of 21 · Observability
At a glance
| Category | Observability and Analysis › Observability |
| CNCF status | Graduated. Accepted November 8, 2016, graduated April 11, 2019 |
| Written in | Ruby, with some C |
| License | Apache 2.0 |
| Core concepts | Input, parser, filter, output and buffer plugins; tags and <match> routing; <label> sections |
| Plugins | More than 900 contributed plugins at graduation (Elasticsearch/OpenSearch, Kafka, S3, BigQuery and many more) |
| Packaging | fluent-package (the successor to td-agent), with an LTS channel; Debian, Ubuntu, RHEL and Windows packages; container images |
| Latest release | fluent-package v6.0.4 (June 26, 2026) with Fluentd v1.19.3 |
| Companion project | Fluent Bit, a lighter agent from the same project family, often used on nodes with Fluentd as an aggregator |
Architecture
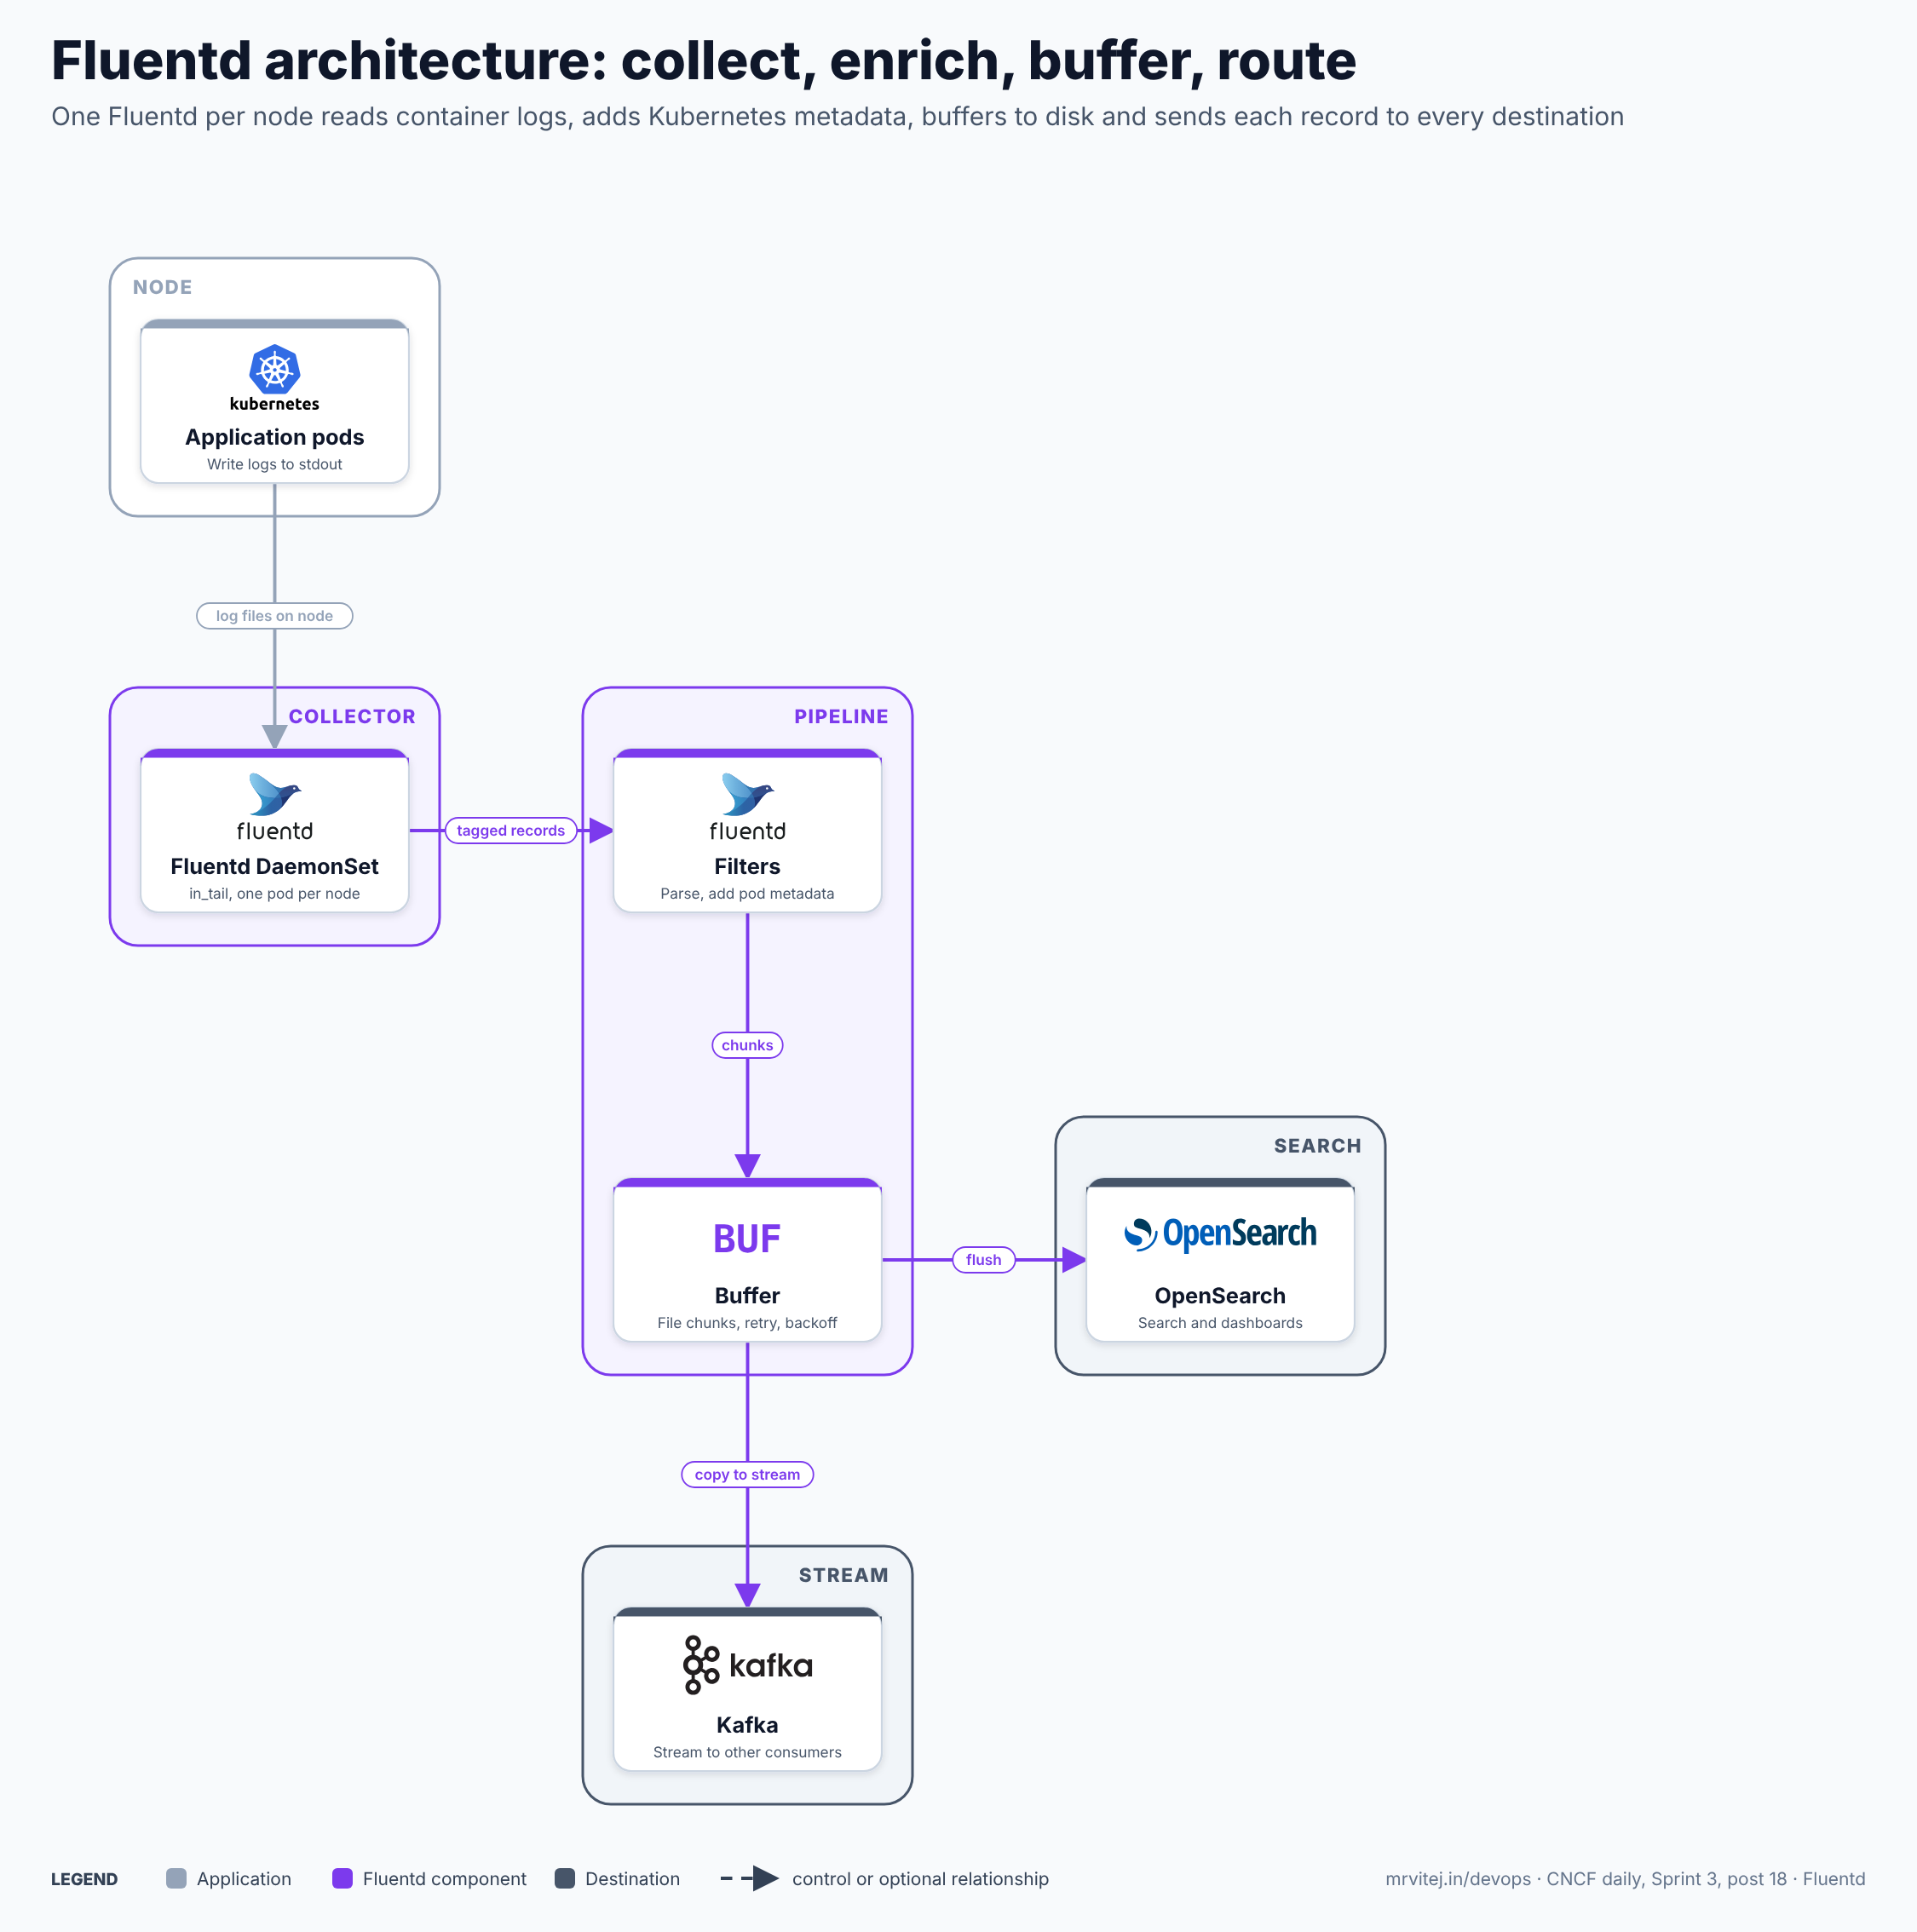
Slate is the application, purple Fluentd and dark slate the destinations. Fluentd runs as one pod per node and sends each record to every matching output. Open the zoomable diagram, or download it as SVG or PNG.
| Component | Responsibility |
|---|---|
| Application pods | Write logs to stdout and stderr; the container runtime stores them as files on the node. |
| Fluentd DaemonSet | Runs on every node and reads the files with the in_tail input plugin, tagging each record. |
| Filters | Parse text into fields and add Kubernetes metadata such as namespace, pod and labels (the kubernetes_metadata filter plugin). |
| Buffer | Holds records in chunks, in memory or in files, and retries failed flushes with backoff. |
| OpenSearch | A search and analytics backend that receives bulk index requests. |
| Kafka | A stream that other consumers can read, so one collection serves several uses. |
Design principle. Decouple sources from destinations. Applications keep writing plain logs, and the routing, parsing and delivery guarantees are configured in one place.
Request flow
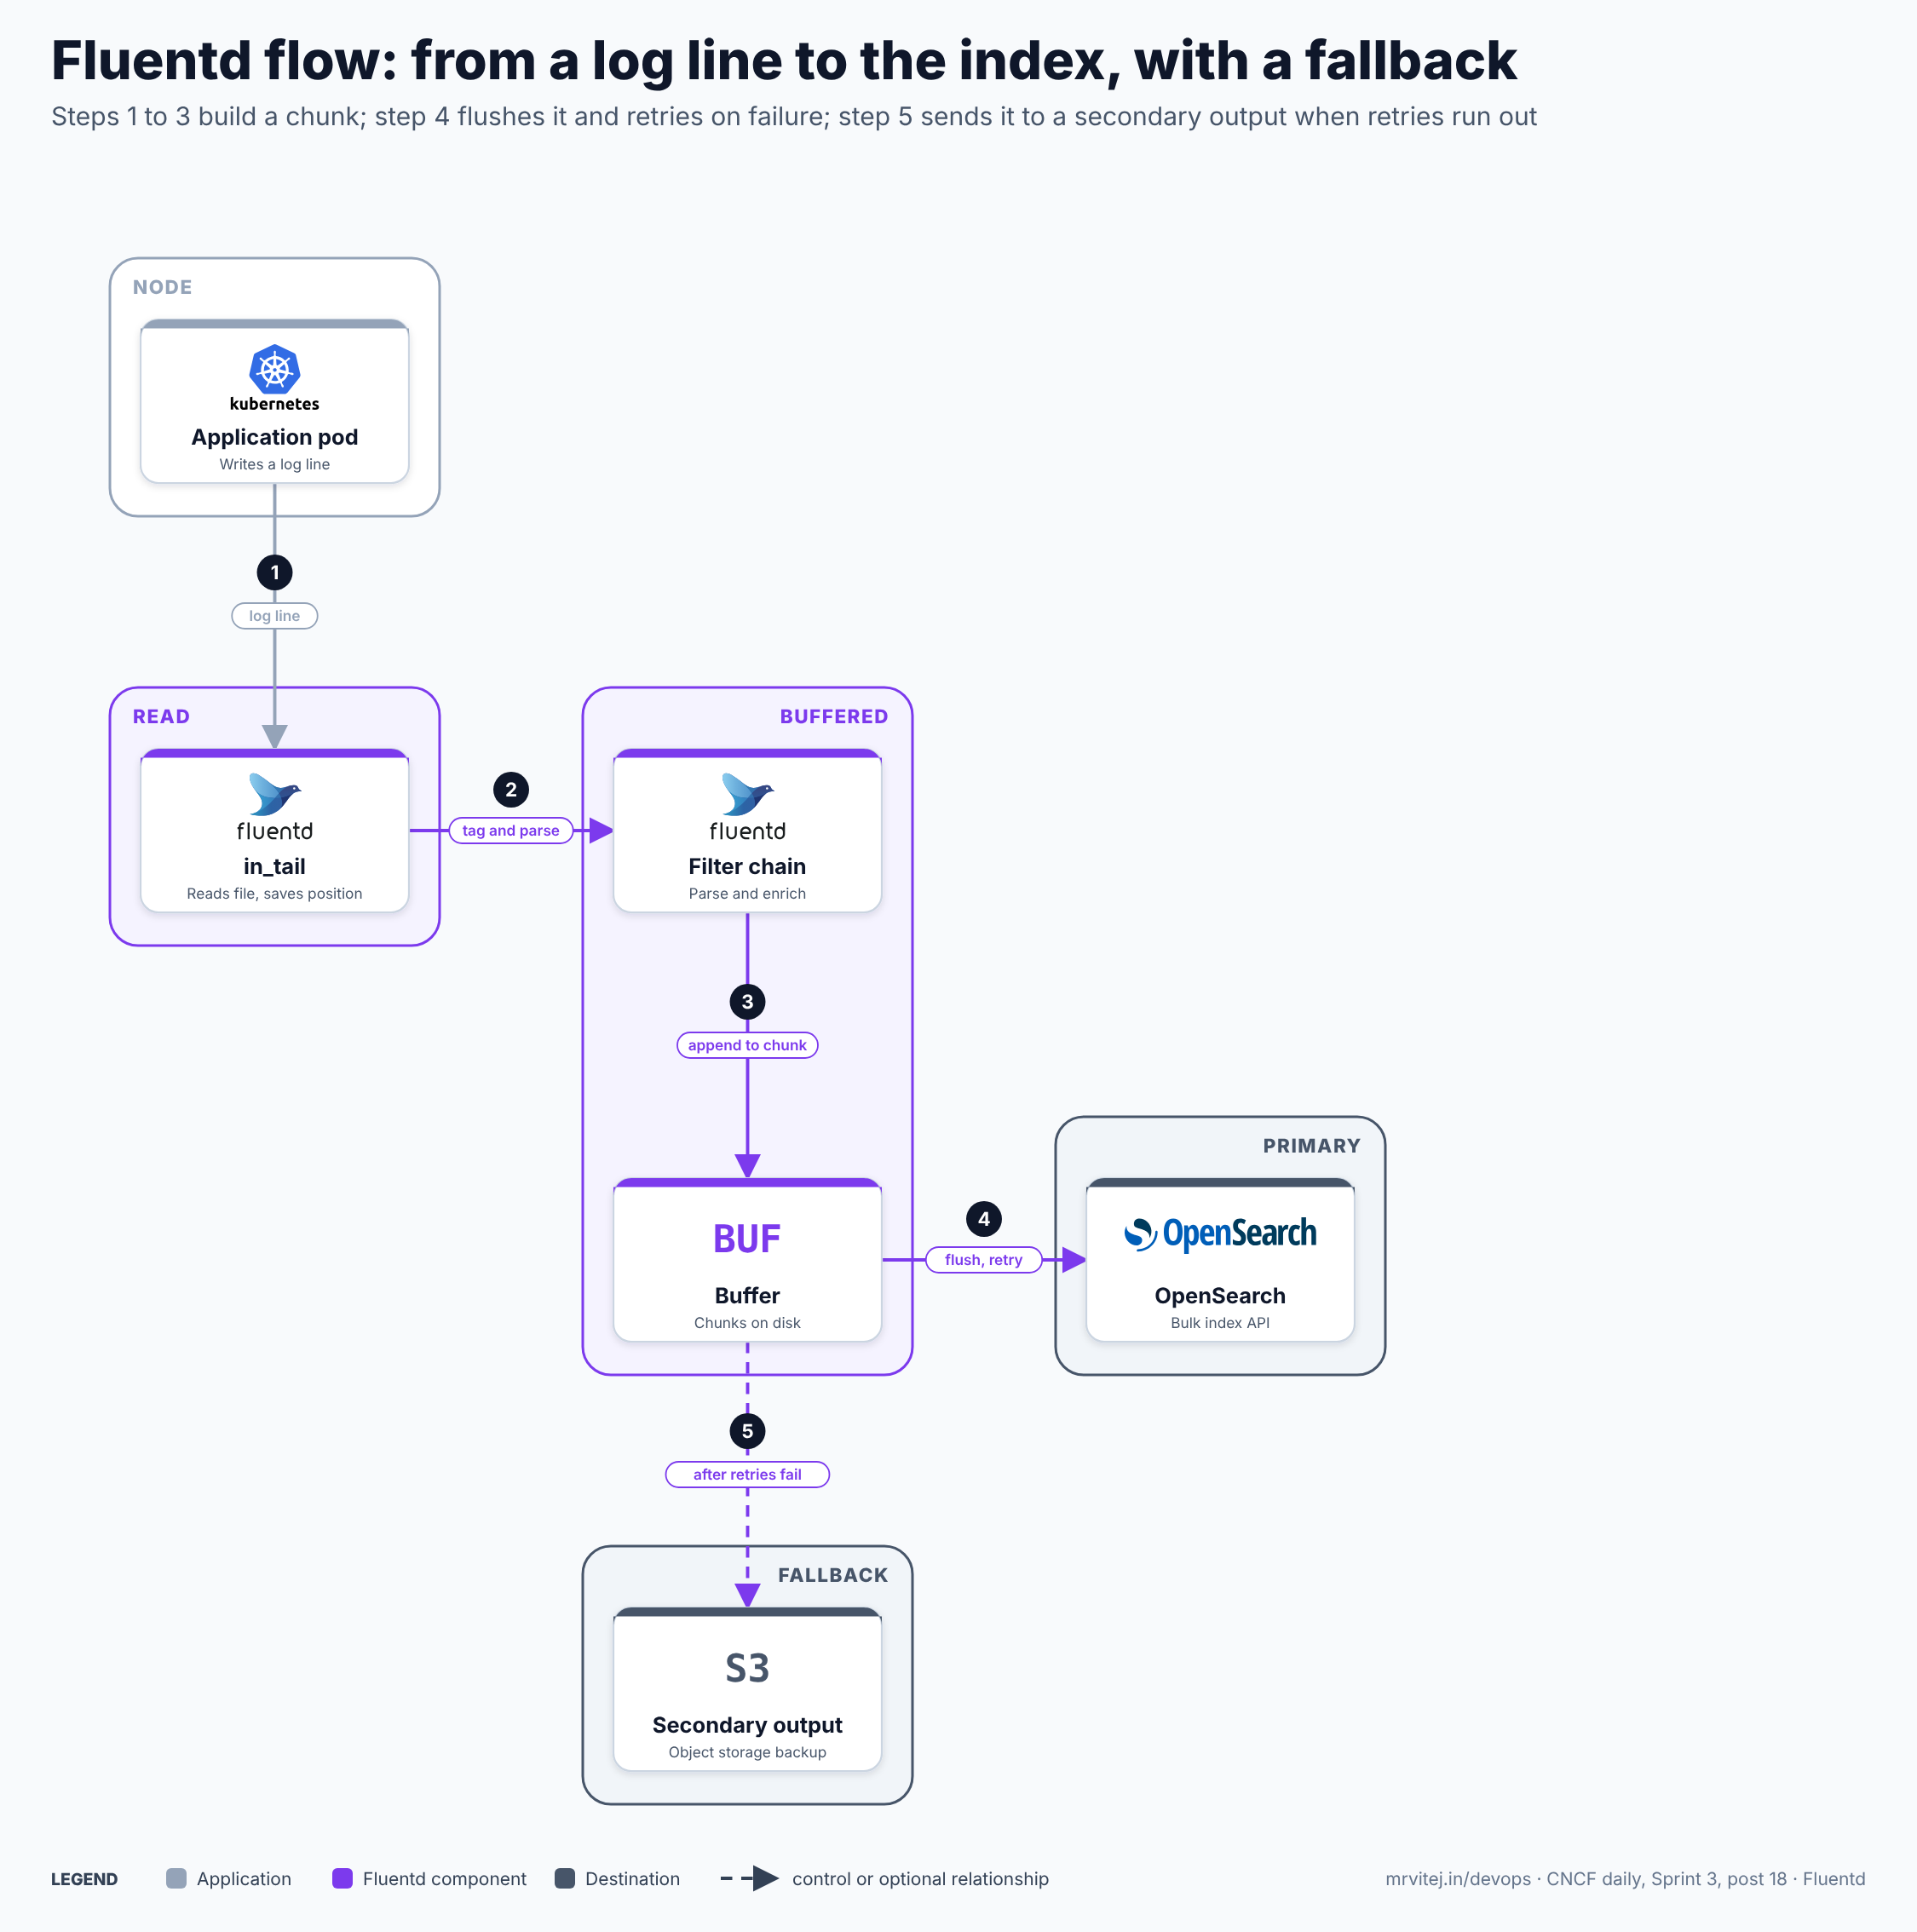
- Log line. A pod writes a line to stdout. The runtime appends it to a file on the node.
- Tag and parse.
in_tailreads new lines, saves its position in a file so a restart does not re-read or skip data, and tags the record, for examplekubernetes.var.log.containers.*. - Append to a chunk. Filters parse the line and add pod metadata, then the record is appended to a buffer chunk.
- Flush and retry. When a chunk is full or its flush interval passes, the output sends it to OpenSearch. On failure Fluentd retries with exponential backoff.
- After retries fail. When retries are exhausted, a
<secondary>output can write the chunk to another place such as object storage, so data is not simply dropped.
Open the zoomable flow diagram, or download it as SVG or PNG.
Production reference design
This Sprint 3 design runs Fluentd as a DaemonSet in each cluster on Google Compute Engine (self-managed Kubernetes with Calico), including the edge clusters, and ships logs to one central backend.
- Deploy the DaemonSet with the project’s Kubernetes DaemonSet manifests or a Helm chart, mounting
/var/logfrom the node. Set resource requests and limits. - Configure the source and filter:
<source> @type tail path /var/log/containers/*.log pos_file /var/log/fluentd-containers.log.pos tag kubernetes.* <parse> @type cri </parse> </source> <filter kubernetes.**> @type kubernetes_metadata </filter> - Configure a file buffer on the output so records survive a restart:
<match kubernetes.**> @type opensearch host logs.example.internal <buffer> @type file path /var/log/fluentd-buffers/opensearch flush_interval 5s retry_max_interval 60s overflow_action block total_limit_size 2GB </buffer> </match> - Plan the edge path. For edge clusters with an unreliable link, give the buffer enough disk to cover the longest expected outage, or send to a local aggregator first. (GCP) In the cloud cluster, an internal Cloud Load Balancing endpoint can front the aggregator or the backend.
- Protect the endpoints. Use
shared_keyand TLS onin_forward, keep the Monitor Agent API on localhost or behind a network policy, and restrict who can change the Fluentd ConfigMap. - Watch the pipeline. Export Fluentd’s own metrics to Prometheus and alert on buffer queue length, retry counts and output errors.
Typical uses include collecting Kubernetes container logs, forwarding to Elasticsearch or OpenSearch, archiving to object storage and feeding streams into Kafka.
Operational considerations
- Security release. Fluentd v1.19.3, bundled in
fluent-packagev6.0.4 (26 June 2026), fixes six vulnerabilities, including a critical remote code execution issue (CVE-2026-44024, via the${tag}placeholder) and denial of service issues inin_http,in_forwardandin_opentelemetry. Versions before v1.19.3 are affected, so check what you run and upgrade. - Buffer sizing. A full buffer either blocks input or drops data, depending on
overflow_action. Sizetotal_limit_sizefor your longest outage and put the buffer on a disk that will not fill the node. - Memory use. Ruby with many plugins uses more memory than lighter agents. Many teams run Fluent Bit on nodes and Fluentd as an aggregator for heavier processing.
- Single-threaded parts. Heavy parsing can become the bottleneck. Use multiple workers and keep regular expressions simple.
- Plugin quality. Plugins vary in maintenance. Pin versions and test upgrades.
- Packaging.
td-agenthas been replaced byfluent-package; plan the upgrade path and the LTS channel in your fleet.
Adoption
- The project’s graduation announcement named Microsoft, Red Hat and Google among organisations using or building on Fluentd.
- Fluentd is widely used as the log collector in Kubernetes distributions and managed logging services, and it has a very large plugin ecosystem. At graduation the project reported more than 900 plugins and more than 100,000 downloads a day.
- For current named users, check the project’s website and repository.
Alternatives
| Solution | Model | Best suited to |
|---|---|---|
| Fluent Bit | Lightweight C agent from the same project family | Node agents with low memory, with Fluentd as an optional aggregator |
| OpenTelemetry Collector (CNCF Graduated) | Vendor-neutral collector for logs, metrics and traces | Teams standardising all three signals on OpenTelemetry |
| Vector | Rust-based collector and router | High throughput with a typed transform language |
| Logstash | JVM pipeline in the Elastic stack | Existing Elastic estates |
| Promtail / Grafana Alloy | Agents for Grafana Loki | Loki-based logging |
Strengths and limitations
| Strengths | Limitations |
|---|---|
| CNCF Graduated, with a very large plugin ecosystem | Higher memory use than lighter agents |
| Disk buffering, retries and secondary outputs protect data | Ruby runtime; heavy parsing can limit throughput |
| Tag-based routing sends one record to many destinations | Configuration grows complex in large pipelines |
| Apache 2.0, with an LTS packaging channel | Plugin quality varies |
| Mature and widely documented | A June 2026 security release shows endpoints need hardening and prompt upgrades |
Recommendation
Adopt for platform teams that need a flexible log pipeline with strong delivery guarantees and many destinations, especially when logs go to more than one place. Put Fluent Bit on nodes where memory is tight, keep Fluentd as an aggregator, and make the upgrade to v1.19.3 or later part of your routine. Teams that want one collector for logs, metrics and traces should evaluate the OpenTelemetry Collector alongside it.
References: Fluentd website · Graduation announcement · fluent-package v6.0.4 release notes · fluent-package v6.0.0 release notes · Fluentd repository · CNCF project page