
Kube-burner is a Kubernetes performance and scale test orchestration tool. You write a short YAML file that says what to create (namespaces, pods, services, anything you can template), how many iterations, and how fast. Kube-burner creates the objects through the API, waits for them, measures how long things took, queries Prometheus for cluster metrics over the test window, evaluates your alert expressions, and sends the results to a store such as OpenSearch or local files.
The result is a repeatable answer to “does this cluster still behave when it holds ten thousand pods?”, with numbers you can compare between runs, versions or node sizes.
CNCF daily · Sprint 5, post 13 of 14 · Continuous Integration & Delivery
At a glance
| Category | App Definition and Development, subcategory Continuous Integration & Delivery (CNCF Landscape) |
| CNCF status | Sandbox. The CNCF project page says it was accepted on 18 December 2023 at the Sandbox maturity level |
| Origin | Created by Red Hat performance and scale engineers for Kubernetes and OpenShift testing; the repository has since moved to a dedicated kube-burner GitHub organization |
| Written in | Go, using the official client-go library. A static binary |
| License | Apache-2.0 |
| Distribution | Pre-compiled binaries on the GitHub releases page and a container image on Quay |
| Latest release | Not confirmed in this pass. Check the releases page and pin a version |
| Job types | create, delete, read, patch, kubevirt |
| Measurements | podLatency, jobLatency, nodeLatency, pvcLatency, serviceLatency, netpolLatency, volumeSnapshotLatency, dataVolumeLatency, vmiLatency, vmimLatency, pprof |
| Indexers | opensearch, elastic (Elasticsearch 7), local files, tsdb |
| Wrapper | kube-burner-ocp, an OpenShift-focused wrapper with ready-made workloads. The core tool works on any Kubernetes cluster |
| State | None kept by the tool. Each run has a UUID that tags its results |
The problem Kube-burner solves
“It works with 50 pods” tells you little. Control-plane and network problems appear at scale: API server latency, scheduler throughput, etcd size, controller backlogs, DNS and service programming delays.
Ad-hoc scripts are not benchmarks. A shell loop that applies manifests has no rate limit, no readiness accounting, no latency numbers and no comparison across runs.
Performance regressions need evidence. After a Kubernetes, CNI or node-size change you want to know whether pod startup got slower, not guess.
Kube-burner standardizes the load shape, rate and collection so results from different runs can be compared.
Key concepts
| Term | Meaning |
|---|---|
| Job | One unit of load. It has a type, iteration count, rate limits and a list of objects |
| Iteration | One repetition of a job. By default each iteration gets its own namespace |
| Object | A template (a file path or URL) for a Kubernetes resource and how many replicas of it to create per iteration |
| Churn | Deleting and recreating a share of objects for a period, to test cluster behaviour under change, not just growth |
| Measurement | A latency or profiling collector that runs alongside the jobs, such as pod startup latency |
| Metrics profile | A list of PromQL queries run after the jobs; each entry has a query and a metricName |
| Alert profile | A list of PromQL expressions with a severity and a description; error and critical alerts fail the run |
| Indexer | Where documents go: OpenSearch, Elasticsearch, local files or Prometheus TSDB blocks |
| UUID | Identifier for one run, added to every indexed document |
| Wrapper | A binary such as kube-burner-ocp that embeds ready-made workloads and flags |
Architecture
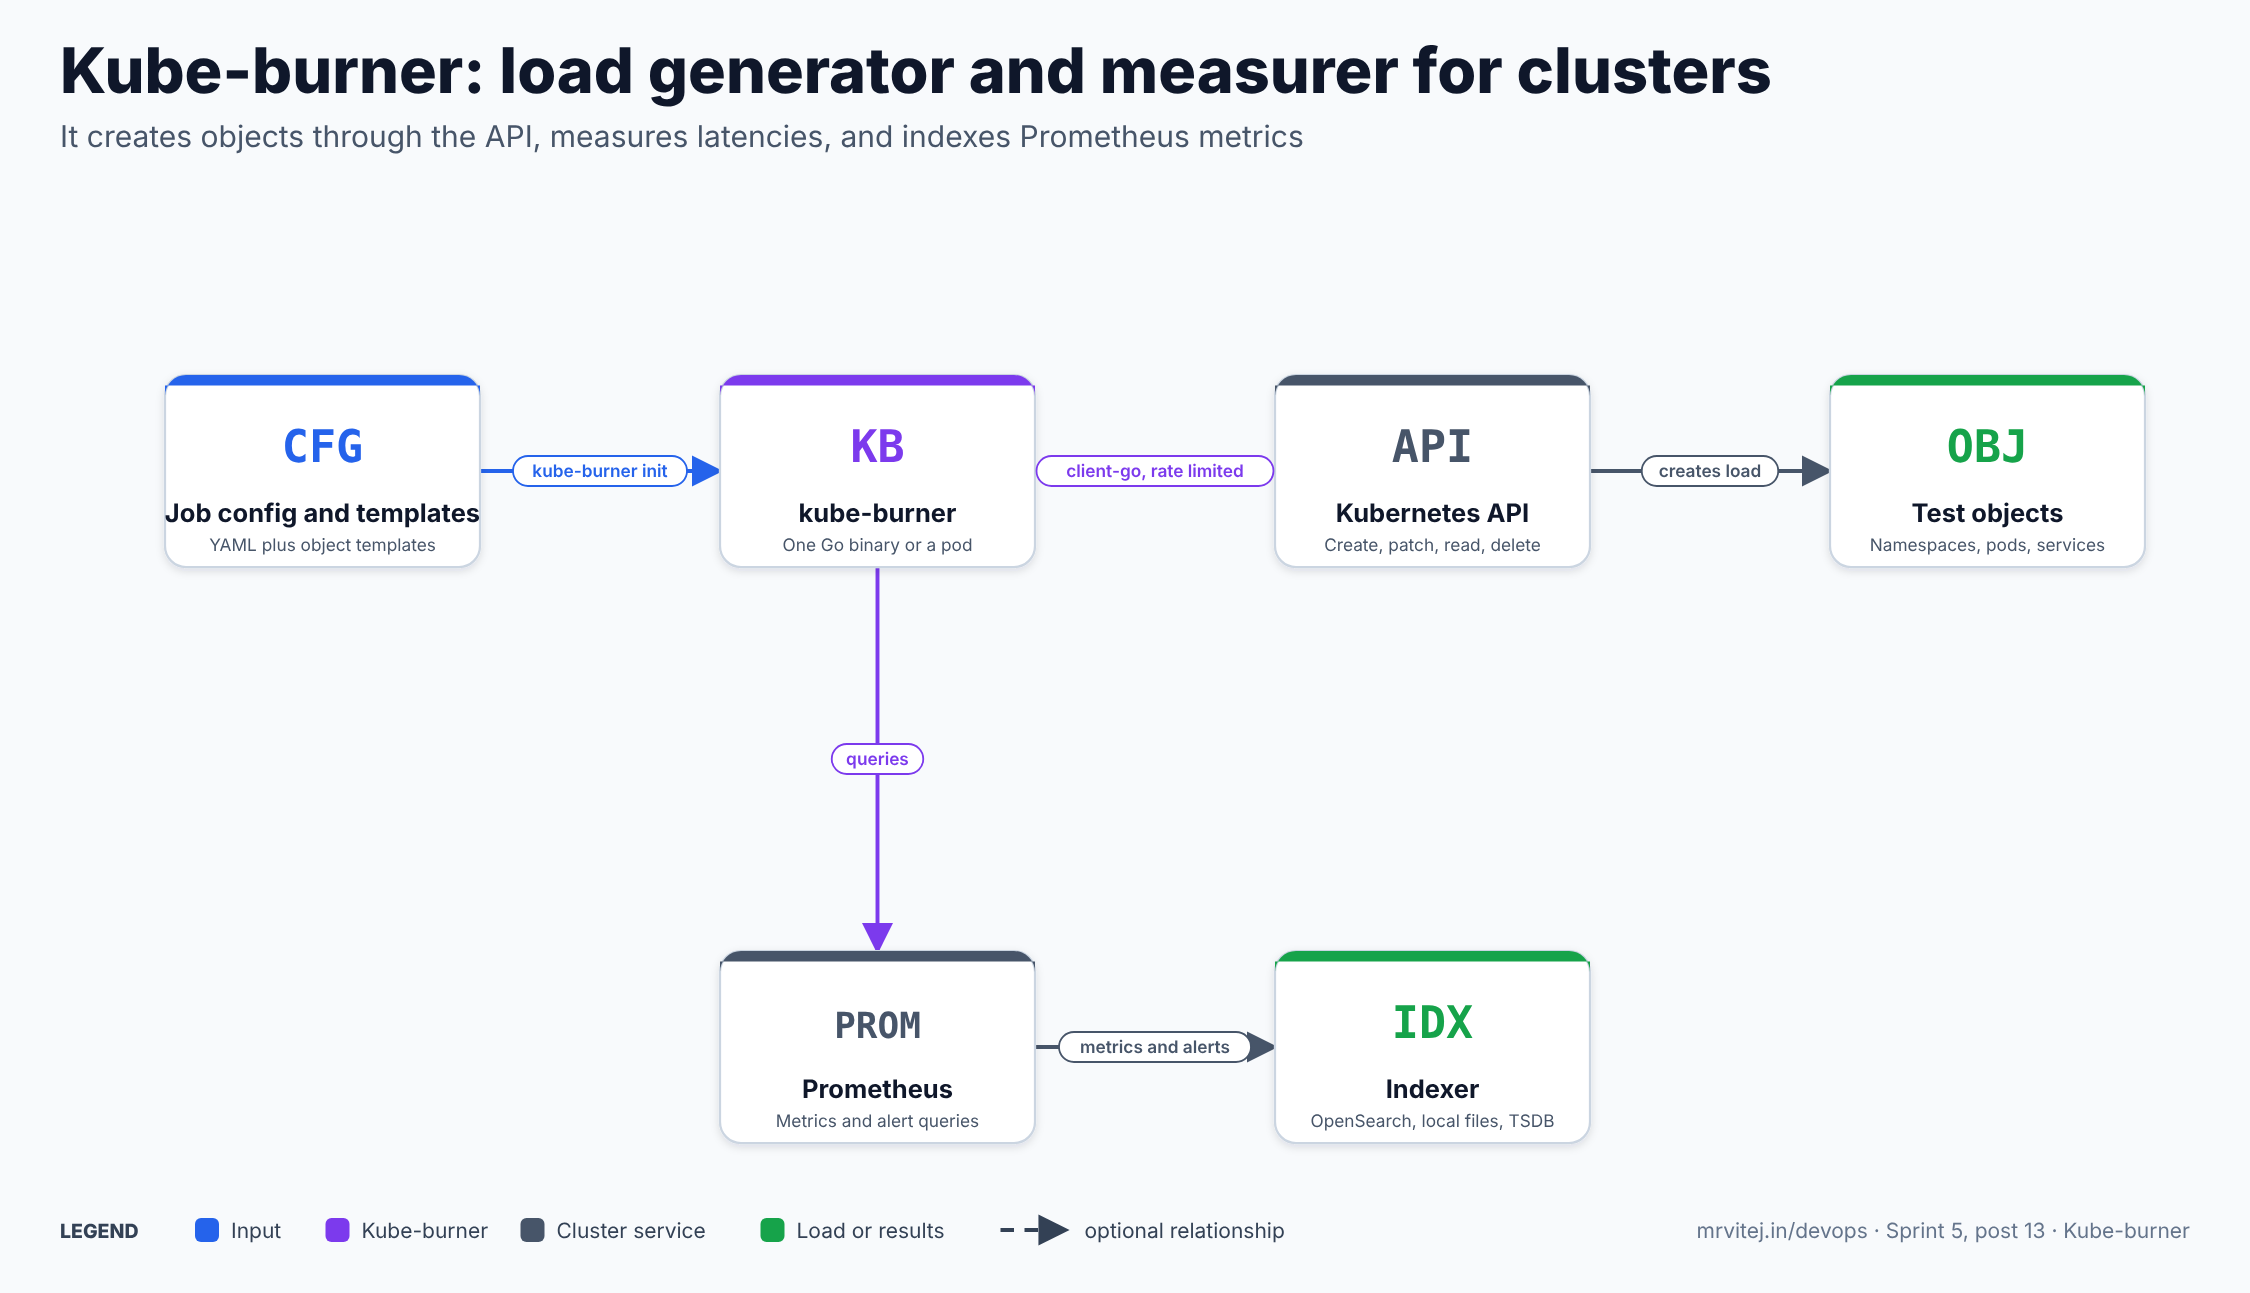
Kube-burner creates load through the API, measures it, and indexes Prometheus metrics. Blue is input, purple is kube-burner, grey is a cluster service and green is load or results. Open the zoomable diagram, or download it as SVG or PNG.
| Component | Responsibility |
|---|---|
| Configuration and templates | Describe jobs, measurements and object templates; the config file itself can be templated with Go templates and environment variables |
| kube-burner binary | Runs jobs, rate-limits requests, waits for readiness, collects measurements and metrics |
| Kubernetes API server | Receives the load. Kube-burner holds no cluster-side component for the core run |
| Prometheus | Source of cluster and node metrics and the engine for alert expressions |
| Indexer | Stores per-run documents for later comparison and dashboards |
| Helper pods | Some features create pods in the cluster: image preloading with a DaemonSet, and the pod used for service latency checks in a kube-burner-service-latency namespace |
Design principle. Keep the load generator outside the cluster’s control path, use only the public API, and treat measurements and Prometheus data as first-class outputs, so a run is a benchmark and not just a burst of requests.
One benchmark run
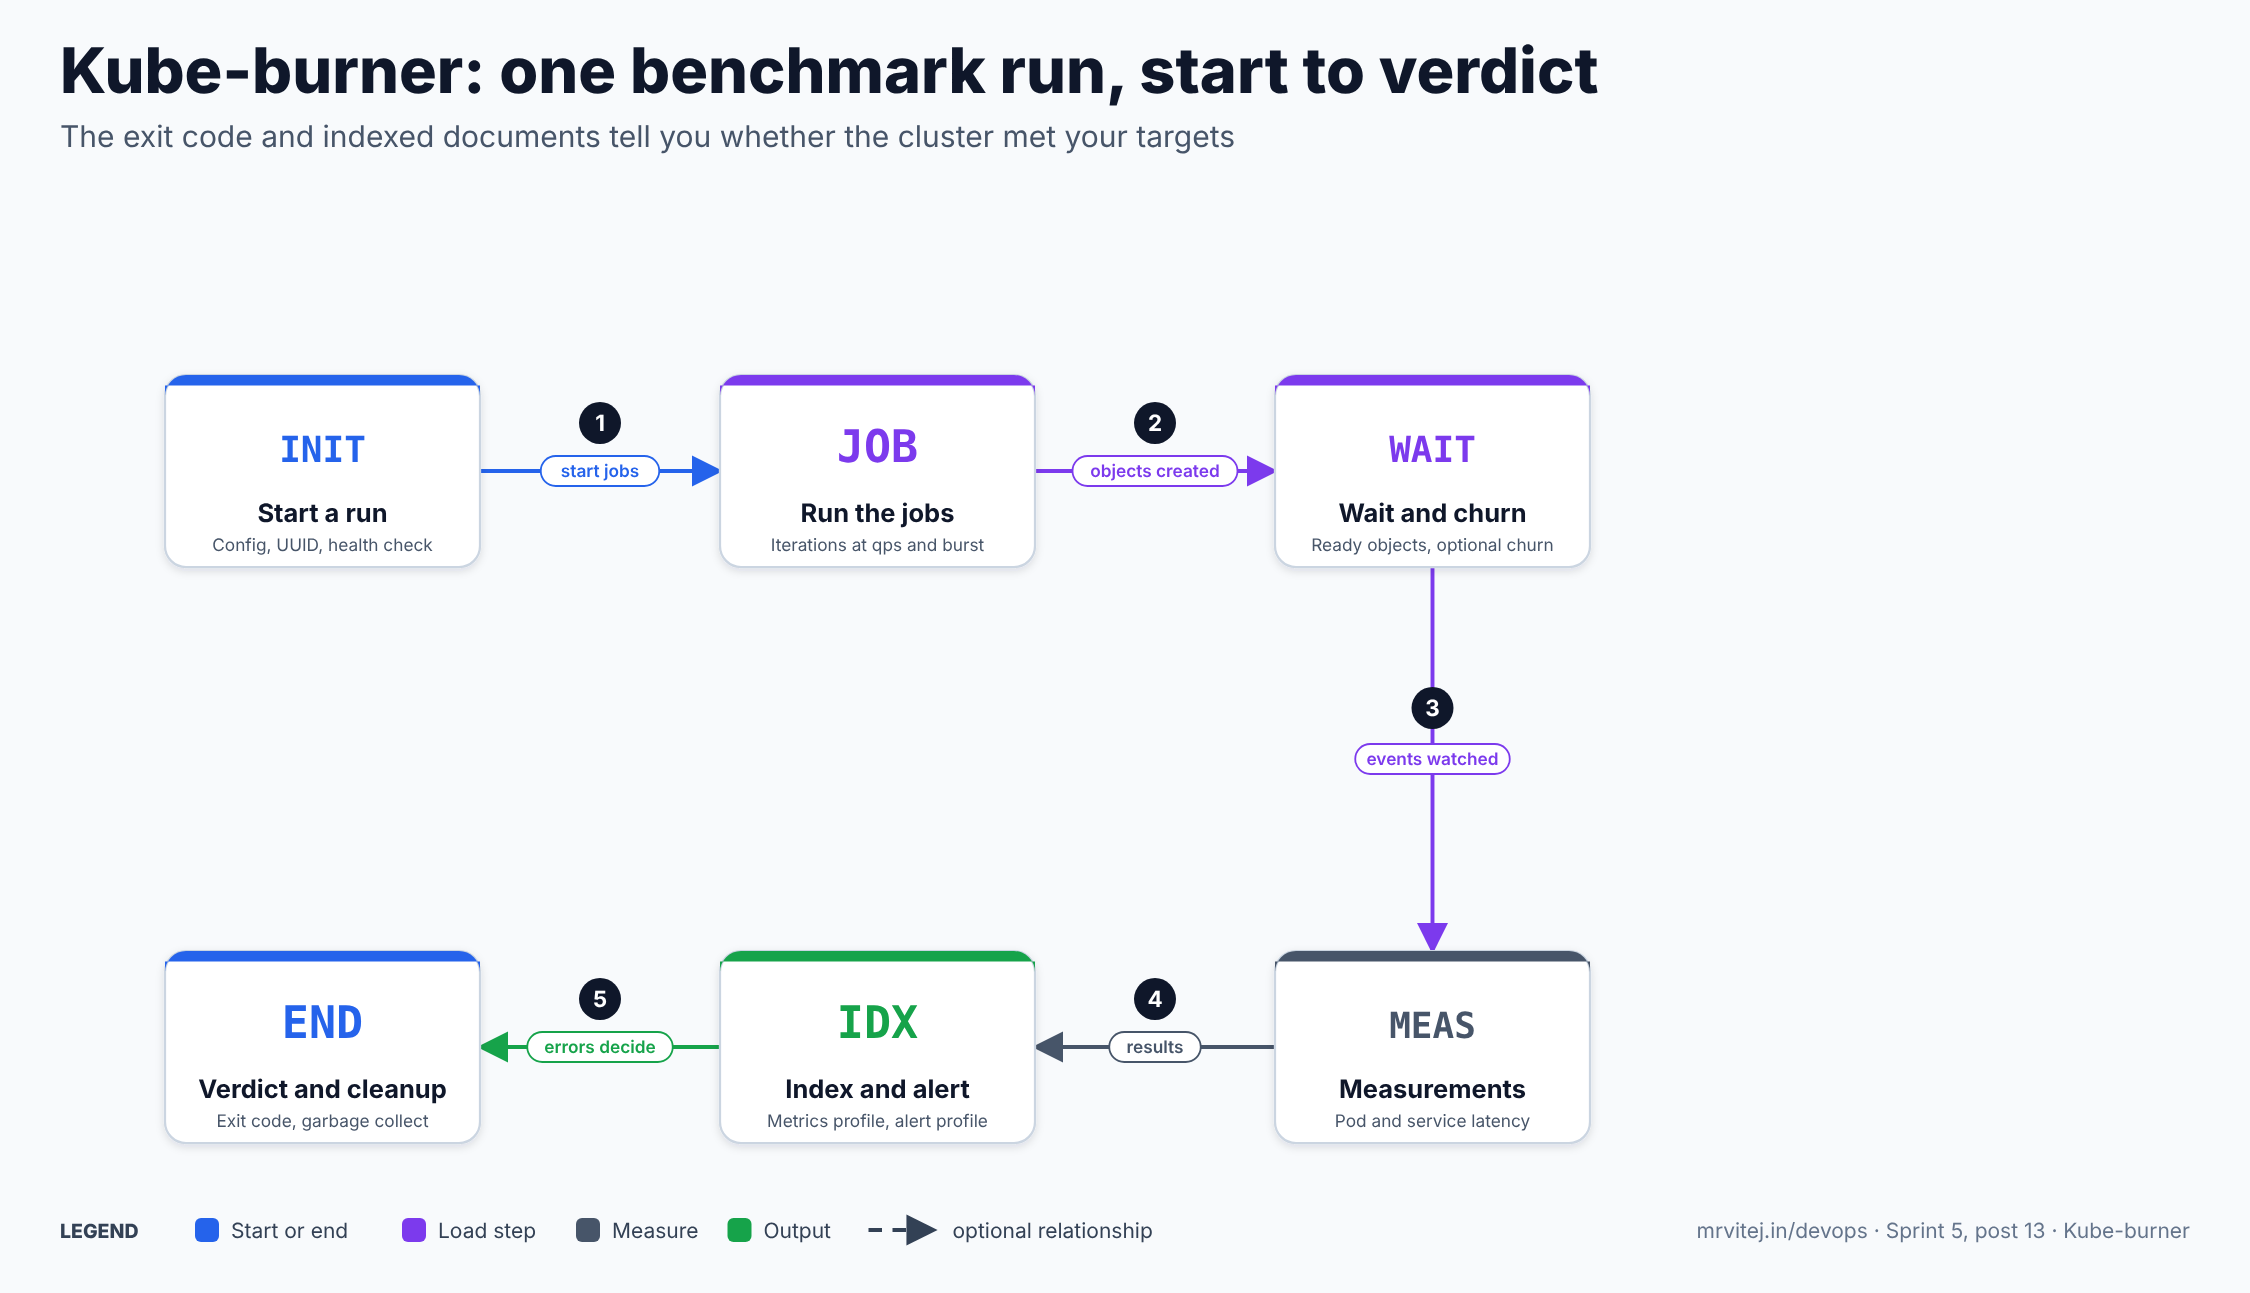
The exit code and indexed documents tell you whether the cluster met your targets. Open the zoomable diagram, or download it as SVG or PNG.
kube-burner initloads the config. WithclusterHealthenabled it first checks that all nodes are Ready.- Each job runs its iterations, creating objects at the configured
qpsandburst. - The run waits for objects to become ready (depending on the wait settings) and, if configured, churns objects.
- Measurements such as
podLatencycollect timings while this happens. - After the jobs finish, the metrics profile queries run against Prometheus and the alert profile is evaluated. Documents are indexed, with a job summary document at the end.
- A latency threshold breach, a failed object verification, or an
errororcriticalalert makes kube-burner exit with code 1. Created namespaces can be garbage collected.
Install Kube-burner
Commands follow the project’s documentation and guides. I did not run them here. Pin versions.
Binary
Download a release for your platform from the project’s GitHub releases page, make it executable and put it on your PATH. The project README also describes an install script that installs to ~/.local/bin by default (set INSTALL_DIR to change it); review any script before running it.
kube-burner version
kube-burner --help
Container image
A container image is published on Quay (quay.io/kube-burner/kube-burner). Use it to run kube-burner as a Job or pod inside or next to the cluster. Prefer a pinned tag over latest.
Prerequisites
- A kubeconfig for the cluster, with permission to create and delete the objects in your jobs (cluster-admin is common for lab clusters; scope it down for shared ones).
- Optional: a Prometheus endpoint (and token) for metrics and alerts, and an OpenSearch or Elasticsearch endpoint if you want to index results.
Using Kube-burner
Snippets are adapted from the documentation and project guides and are untested here. Template variable names follow the project’s examples; check the reference for your version.
A first job
global:
  measurements:
    - name: podLatency

jobs:
  - name: pause-pods
    jobType: create
    jobIterations: 10
    qps: 20
    burst: 40
    namespace: kb-demo
    namespacedIterations: true
    cleanup: true
    podWait: false
    waitWhenFinished: true
    objects:
      - objectTemplate: pod.yml
        replicas: 5
pod.yml is an ordinary Pod manifest, rendered as a Go template for each iteration and replica (the project examples use variables such as the iteration number and replica number in names). A pause container keeps the test about the platform, not the workload.
Run it
kube-burner init -c config.ymlWith metrics and indexing, pass a metrics endpoints file:
kube-burner init -c config.yml -e metrics-endpoints.yml# metrics-endpoints.yml
- endpoint: http://localhost:9090
token: <token>
metrics: [metrics.yml]
alerts: [alerts.yml]
indexer:
type: local
metricsDirectory: collected-metricsNewer configuration files can also embed a metricsEndpoints list with prometheusURL, metrics, alerts and indexer fields; the reference page shows both styles.
A metrics profile
# metrics.yml
- query: sum(irate(node_cpu_seconds_total[2m])) by (mode,instance)
  metricName: nodeCPU

- query: kube_node_role
  metricName: nodeRoles
  instant: true
  captureStart: true
Range queries use the benchmark (or job) start and end time; instant: true runs an instant query at the last timestamp of each job; captureStart adds a document from the first timestamp with a -start suffix on the metric name.
An alert profile
# alerts.yml
- expr: avg_over_time(histogram_quantile(0.99, rate(apiserver_request_duration_seconds_bucket{verb!~"WATCH|CONNECT"}[2m]))[{{ .elapsed }}:]) > 1
  description: 99th percentile API request latency above 1 second
  severity: error
{{ .elapsed }} is the job duration (or the range passed to check-alerts). Descriptions can include {{$labels.<name>}} and {{$value}}.
Fail a run on slow pod startup
global:
  measurements:
    - name: podLatency
      thresholds:
        - conditionType: Ready
          metric: P99
          threshold: 30s
A threshold breach makes kube-burner exit with code 1, which is what lets a CI job fail on a performance regression.
Re-check alerts later
kube-burner check-alerts -u https://prometheus.example -t "$TOKEN" -a alerts.yml
kube-burner index ...   # collect and index metrics for a past time range
kube-burner measure ... # collect podLatency for resources that still exist
The check-alerts, index and measure subcommands let you evaluate alerts, index metrics or collect pod latency for a past run. Check --help for the exact flags in your version.
Churn
jobs:
  - name: churn-demo
    jobIterations: 20
    churnConfig:
      percent: 10
      cycles: 3
      duration: 10m
      delay: 30s
      mode: namespaces
Churn applies to create jobs and stops when either cycles or duration is reached first. Set cycles: 0 to use only the duration.
Features
| Area | What you get |
|---|---|
| Job types | Create, delete, read and patch objects, plus a kubevirt job type for virtual machine operations |
| Rate control | qps and burst limit request rates; requestTimeout bounds each client call |
| Templating | Go templates in object files and in the configuration; function templates can be shared; inputVars inject extra values per object |
| Waiting | Per-object wait with custom waitOptions, per-iteration podWait, per-job and global waitWhenFinished (global overrides job, which overrides podWait) |
| Verification | verifyObjects and errorOnVerify check object counts after each job |
| Churn | Namespace- or object-level churn with percent, cycles, duration and delays |
| Image preload | preLoadImages pre-pulls job images with a DaemonSet so pull time does not distort results |
| Measurements | Latency collectors for pods, jobs, nodes, PVCs, services, network policies, VolumeSnapshots, DataVolumes, VMIs and VM migrations, plus pprof profile capture |
| Metrics | PromQL profiles, range or instant queries, multiple Prometheus endpoints |
| Alerting | PromQL alert expressions with info, warning, error, critical severities |
| Indexing | OpenSearch, Elasticsearch 7, local files (optionally a tarball) and Prometheus TSDB blocks; a job summary document per job |
| Hooks | Global and job hooks run before or after jobs |
| Cluster health and cleanup | clusterHealth check before the run; gc to remove created namespaces |
| Extensibility | Custom measurements by implementing the Measurement interface; the core code can be used as a library |
| OpenShift wrapper | kube-burner-ocp bundles workloads such as cluster-density and node-density, with health checks and OpenShift metric profiles |
Configuration reference
| Setting | Level | Purpose and default |
|---|---|---|
measurements |
global or job | List of measurements; job-level overrides global |
requestTimeout |
global | Client-go request timeout, default 60s |
gc, gcMetrics |
global | Garbage collect namespaces; collect metrics during collection. Both default false. Global waitWhenFinished and job gc cannot both be on |
clusterHealth |
global | Check all nodes are Ready; default false |
timeout |
global | Whole-benchmark timeout, default 4hr |
deletionStrategy |
global | default or gvr |
jobType |
job | create (default), delete, read, patch, kubevirt |
jobIterations |
job | Number of executions, default 1 |
namespace, namespacedIterations |
job | Base namespace name; one namespace per iteration, default true |
cleanup |
job | Remove old namespaces first, default true |
qps, burst |
job | Request rate limits, default 0 (unset) |
waitWhenFinished, podWait, maxWaitTimeout |
job | Wait behaviour; default max wait 4h |
preLoadImages |
job | Pre-pull images, default true |
jobPause |
job | Pause after the job, default 0s |
verifyObjects, errorOnVerify |
job | Count verification, both default true |
churnConfig |
job | percent, cycles, duration, delay, deleteDelay, mode |
objects[] |
job | objectTemplate, replicas, kind, apiVersion, inputVars, wait, waitOptions, runOnce, labelSelector, patchType |
kube-burner init flags |
CLI | -c config, -e metrics endpoints, plus log level and others; see --help |
| Indexer fields | metrics endpoint | type, esServers, defaultIndex, insecureSkipVerify, metricsDirectory, createTarball, tarballName |
Production reference design
- Test a copy of production, not production. A scale test is a deliberate stress. Use a dedicated cluster built like the real one (same instance types, add-ons and CNI) and discard it afterwards.
- Run from outside the cluster under test (a CI runner or separate node) so the load generator is not competing for the resources you measure.
- Always collect Prometheus metrics. Latency numbers without API server, etcd and node metrics tell you something is slow but not why.
- Fix the workload shape (iterations, replicas, qps, burst) and version the config in Git, so runs are comparable.
- Preload images so image pulls do not dominate pod latency.
- Set thresholds and alerts for your SLOs so CI fails on regression.
- Index every run with its UUID and compare against a baseline run.
- Clean up. Enable
gcor delete the test namespaces, and destroy dedicated clusters. - Start small, then ramp. Run at a tenth of target scale first to validate the config.
Security
| Area | What to know |
|---|---|
| Cluster permissions | Kube-burner creates and deletes objects with your kubeconfig. Use a dedicated test cluster and a scoped service account where possible |
| Destructive by design | cleanup and gc delete namespaces. Check names and labels so they never match real workloads |
| Prometheus access | A bearer token or basic auth is used to query metrics. Keep tokens out of the config file and Git |
| Indexer credentials | OpenSearch or Elasticsearch credentials can be part of the server URL. Use secrets management and avoid committing them |
| TLS | insecureSkipVerify exists for lab endpoints; keep it false elsewhere |
| Templates from URLs | Object templates can be loaded from a URL; only use sources you trust |
| Images | Job pods pull images you choose. Pin and scan them, and consider a private mirror for large tests |
| Cost and quota | Large tests consume real cloud resources and can hit API rate limits or service quotas |
Monitoring and day-2 operations
| Task | How |
|---|---|
| Follow a run | Kube-burner logs progress; with indexing on, query documents by UUID |
| Compare runs | Index into OpenSearch and compare latency quantiles and metrics between UUIDs |
| Re-evaluate alerts | kube-burner check-alerts with a Prometheus URL and an alert profile |
| Index a past window | The index subcommand collects and indexes metrics for a time range |
| Clean up leftovers | kube-burner destroy with the run’s UUID, or delete the labelled namespaces |
| Upgrade | Download a newer binary or image; re-run a baseline to separate tool changes from cluster changes |
| Add a metric | Add an entry to the metrics profile |
| CI integration | Run kube-burner init in a pipeline and rely on its exit code |
| Symptom | First checks |
|---|---|
| Run exits with code 1 | Look for a threshold breach, an error or critical alert, or failed object verification |
| Objects never become ready | Image pulls, scheduling capacity, quotas; check maxWaitTimeout |
| Throttling or timeouts | qps, burst and requestTimeout; API server saturation |
| No metrics indexed | Prometheus endpoint and token, metrics profile path, indexer settings |
| Service latency measurements missing | The measurement creates a pod in kube-burner-service-latency; check it can start |
| Leftover namespaces | cleanup and gc settings; run destroy for the UUID |
pprof files missing |
Targets need curl in the pods, plus correct URL and credentials |
Usage cases
- Control-plane scale tests. Create thousands of pods, services and ConfigMaps and watch API server, etcd and scheduler behaviour.
- Regression gates. Fail a pipeline when pod startup latency or API latency exceeds a threshold after a version change.
- Comparing configurations. Same workload on different node sizes, CNIs or Kubernetes versions.
- Network and storage checks. Network policy, service and PVC or snapshot latency measurements.
- Virtualization workloads.
kubevirtjobs and VM latency measurements. - Profiling. Capture heap and CPU profiles from control-plane components during load.
- Cold-chain sprint project. A fleet-scale load test of the Sprint 5 final project’s platform, simulating a large number of devices and workloads.
Operational considerations
- It generates real load. Never point it at a cluster that serves users.
- Results depend on the whole setup. Node types, networking, add-ons and Prometheus scrape settings change the numbers, so compare like with like.
- Cluster-level, not application-level. It tests the platform’s ability to create and run objects; it does not model user traffic to your services. Use an application load tool for that.
- Docs and flags change. The configuration format evolved (for example metrics endpoint handling), so follow the documentation for the version you pin.
- OpenShift focus in places. The wrapper and some metric profiles target OpenShift; the core tool is generic.
- Sandbox maturity. Smaller governance and adoption evidence than graduated tools.
Adoption
Kube-burner was built by Red Hat performance and scale engineers and is used for Kubernetes and OpenShift scale testing. Red Hat’s announcement of the Sandbox acceptance describes it as the first and only performance and scale testing tool to reach that status; that is the vendor’s claim. A 2024 ICPE companion paper presents a benchmarking case study using it, and a DevConf.US 2025 session covers it alongside ClusterLoader2. I did not find a public adopters list in the pages I read, so I am not naming adopters.
Alternatives
| Solution | Model | Best suited to |
|---|---|---|
| ClusterLoader2 | The official Kubernetes scalability and performance test framework; YAML tests in a semi-declarative style | Upstream-style scalability testing and comparisons with Kubernetes project results |
| KWOK | Simulates nodes and pods without running kubelets | Testing control-plane and client behaviour at huge scale cheaply; it does not run real workloads, and it can be combined with a load driver |
| k6, JMeter, Locust | Application and HTTP load | Testing your service’s performance, not the cluster’s object-handling |
Shell scripts and kubectl loops |
DIY | Quick smoke tests; no rate control, measurements or comparison |
| Cloud-provider scale testing guidance | Provider documentation | Understanding managed-service limits such as EKS quotas |
Strengths and limitations
| Strengths | Limitations |
|---|---|
| Repeatable, rate-controlled load with built-in measurements | You must design a realistic workload shape |
| Prometheus metrics and alerts tied to each run | Needs Prometheus (and an indexer) for full value |
| Exit code works as a CI gate | Can damage a cluster if pointed at the wrong one |
| Many job types and latency measurements | Configuration format changes between versions |
| Single binary, any Kubernetes cluster | Not a user-traffic or application load tool |
| OpenShift wrapper with ready workloads | Sandbox project with a smaller community |
Project status and roadmap
Kube-burner started in 2020 as a Red Hat performance tool, was accepted into the CNCF Sandbox on 18 December 2023, and has continued to add measurements and job types (the docs now list kubevirt, VolumeSnapshot, DataVolume and network policy measurements). I did not find a published roadmap page in this pass, so I am not stating one; follow the releases page and the CNCF project page.
Recommendation
Trial Kube-burner if you run Kubernetes clusters that must hold a known number of pods, services or nodes and you want repeatable evidence: start with one create job and podLatency, add Prometheus metrics and one alert, then wire the exit code into CI. Adopt it as a regression gate once the workload shape and thresholds match your SLOs and a baseline is indexed. Assess ClusterLoader2 if you want the upstream Kubernetes scalability methodology, KWOK if you need to simulate very large node counts cheaply, and an application load tool for service-level performance. Before a big run: use a dedicated test cluster, fix the config in Git, preload images, collect Prometheus metrics, set thresholds, and plan cleanup.
References: Kube-burner documentation · Configuration reference · Measurements · Indexing · Metrics profiles · Alerting · Command line · kube-burner-ocp · CNCF project page · Red Hat: kube-burner joins the CNCF Sandbox · Red Hat: Test Kubernetes performance and scale with kube-burner · Red Hat: Introducing kube-burner · InfoQ: new CNCF Sandbox projects · ICPE 2024 companion paper · ClusterLoader2