
Most monitoring tells you what components report about themselves. Kuberhealthy checks what a user or another service would actually experience. You describe a check as a Kubernetes resource (a HealthCheck): which container to run, how often, and how long to wait. The operator starts that container as a short-lived pod on schedule, the container tries the real thing (resolve a name, call an API, create a Deployment, read a queue) and reports pass or fail, and the verdict is shown on a status page and exported to Prometheus.
That makes the monitoring itself a set of Kubernetes manifests you can keep in Git, review and deploy like any other workload.
CNCF daily · Sprint 5, post 14 of 14 · Observability
At a glance
| Category | Observability and Analysis, subcategory Observability (CNCF Landscape) |
| CNCF status | Sandbox. The CNCF project page says it was accepted on 30 March 2021 at the Sandbox maturity level |
| Origin | Started at Comcast and now hosted in the kuberhealthy GitHub organization |
| Written in | Go. Check clients exist for Go, Python, TypeScript, JavaScript, Rust, Ruby, Java and Bash |
| Current line | v3, a complete rewrite. The repository page shows v3.0.0 dated 2 June 2026; the newest patch I found is v3.0.20 (scheduler wake-up fix). Confirm the latest on the releases page |
| Main resource | HealthCheck (one custom resource that is either a single-use check or a scheduled one, and holds its own status) |
| Outputs | Status UI, a /json endpoint and a /metrics endpoint for Prometheus |
| Install routes | Helm chart, Kustomize and an Argo CD manifest, all documented in the repository |
| State | Check status is stored on the HealthCheck resource itself |
| v2 users | v3 breaks compatibility with earlier versions; the repository has a migration guide (MIGRATING_TO_V3.md) |
The problem Kuberhealthy solves
Healthy components, broken experience. Pods can be Ready while DNS fails, a network policy blocks a path, an image registry is unreachable or storage cannot be provisioned. Resource metrics do not show that.
Failures found by users. If the only test of “can I deploy a workload and resolve a service name?” is a real deployment, you discover problems at the worst time.
Checks scattered across scripts. Cron jobs and ad-hoc probes have no common scheduling, timeout, status or metrics.
Kuberhealthy gives synthetic checks one shape: a container, a schedule, a timeout, a verdict.
Key concepts
| Term | Meaning |
|---|---|
| HealthCheck | The custom resource that defines a check: runInterval, timeout and a podSpec for the checker pod. Its status section holds results |
| Checker pod | A short-lived pod created for each run. It runs your validation logic and exits |
| Run interval | How often the check runs, such as 10m |
| Timeout | How long Kuberhealthy waits before it considers a run failed. The default checker pod run timeout is 30 seconds |
| Check client | A small library that reports ReportSuccess or ReportFailure(errors) to the controller |
| Reporting URL and run UUID | Injected into the pod so the controller can match a report to the run that produced it |
| Reaper | A controller component that removes old checker pods |
| Status UI | A live web page for all checks, with a “run now” button and running pod details |
| Check registry | A list of ready-made checks, now kept in separate repositories under the kuberhealthy organization |
Architecture
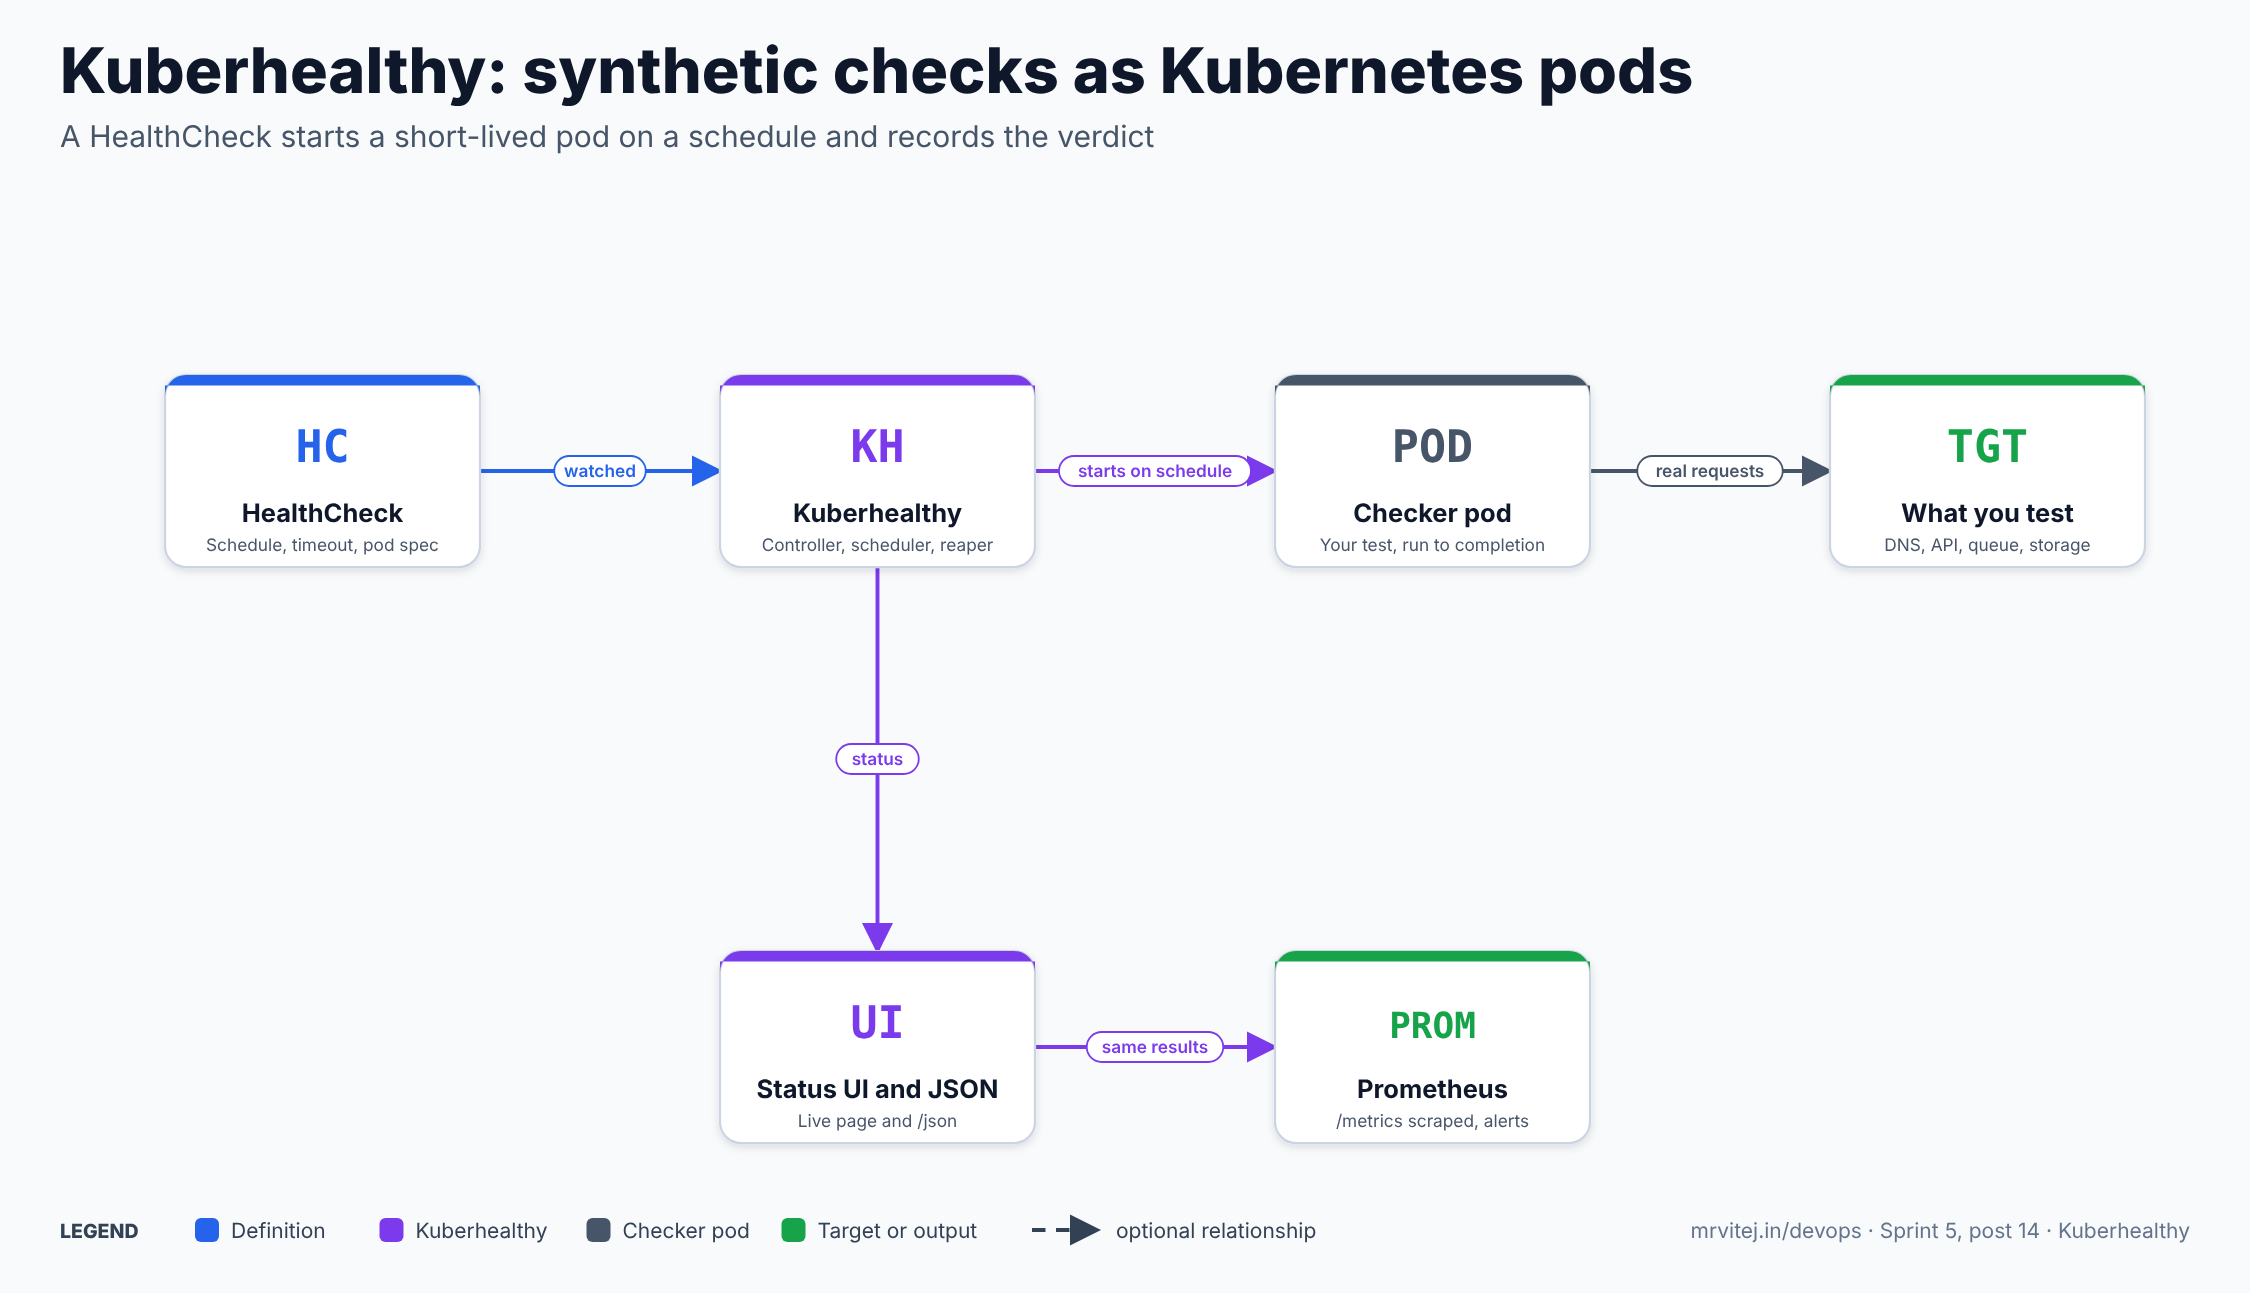
A HealthCheck starts a short-lived pod on a schedule and records the verdict. Blue is the definition, purple is Kuberhealthy, grey is the checker pod and green is the target or output. Open the zoomable diagram, or download it as SVG or PNG.
| Component | Responsibility |
|---|---|
| Controller | Watches HealthChecks, schedules runs, creates checker pods, validates reports, writes status |
| Scheduler | Wakes when a run is due; since v3.0.20 it also wakes when a HealthCheck is added, changed or deleted |
| Checker pods | Do the real test and report back |
| Reaper | Cleans up checker pods |
| Web server | Serves the status UI, /json and /metrics |
| HealthCheck CRD | Definition and status in one place |
Design principle. Treat a synthetic check as a workload: it is a container, so it can use any language, any image and normal Kubernetes scheduling, resources and service accounts.
One check run
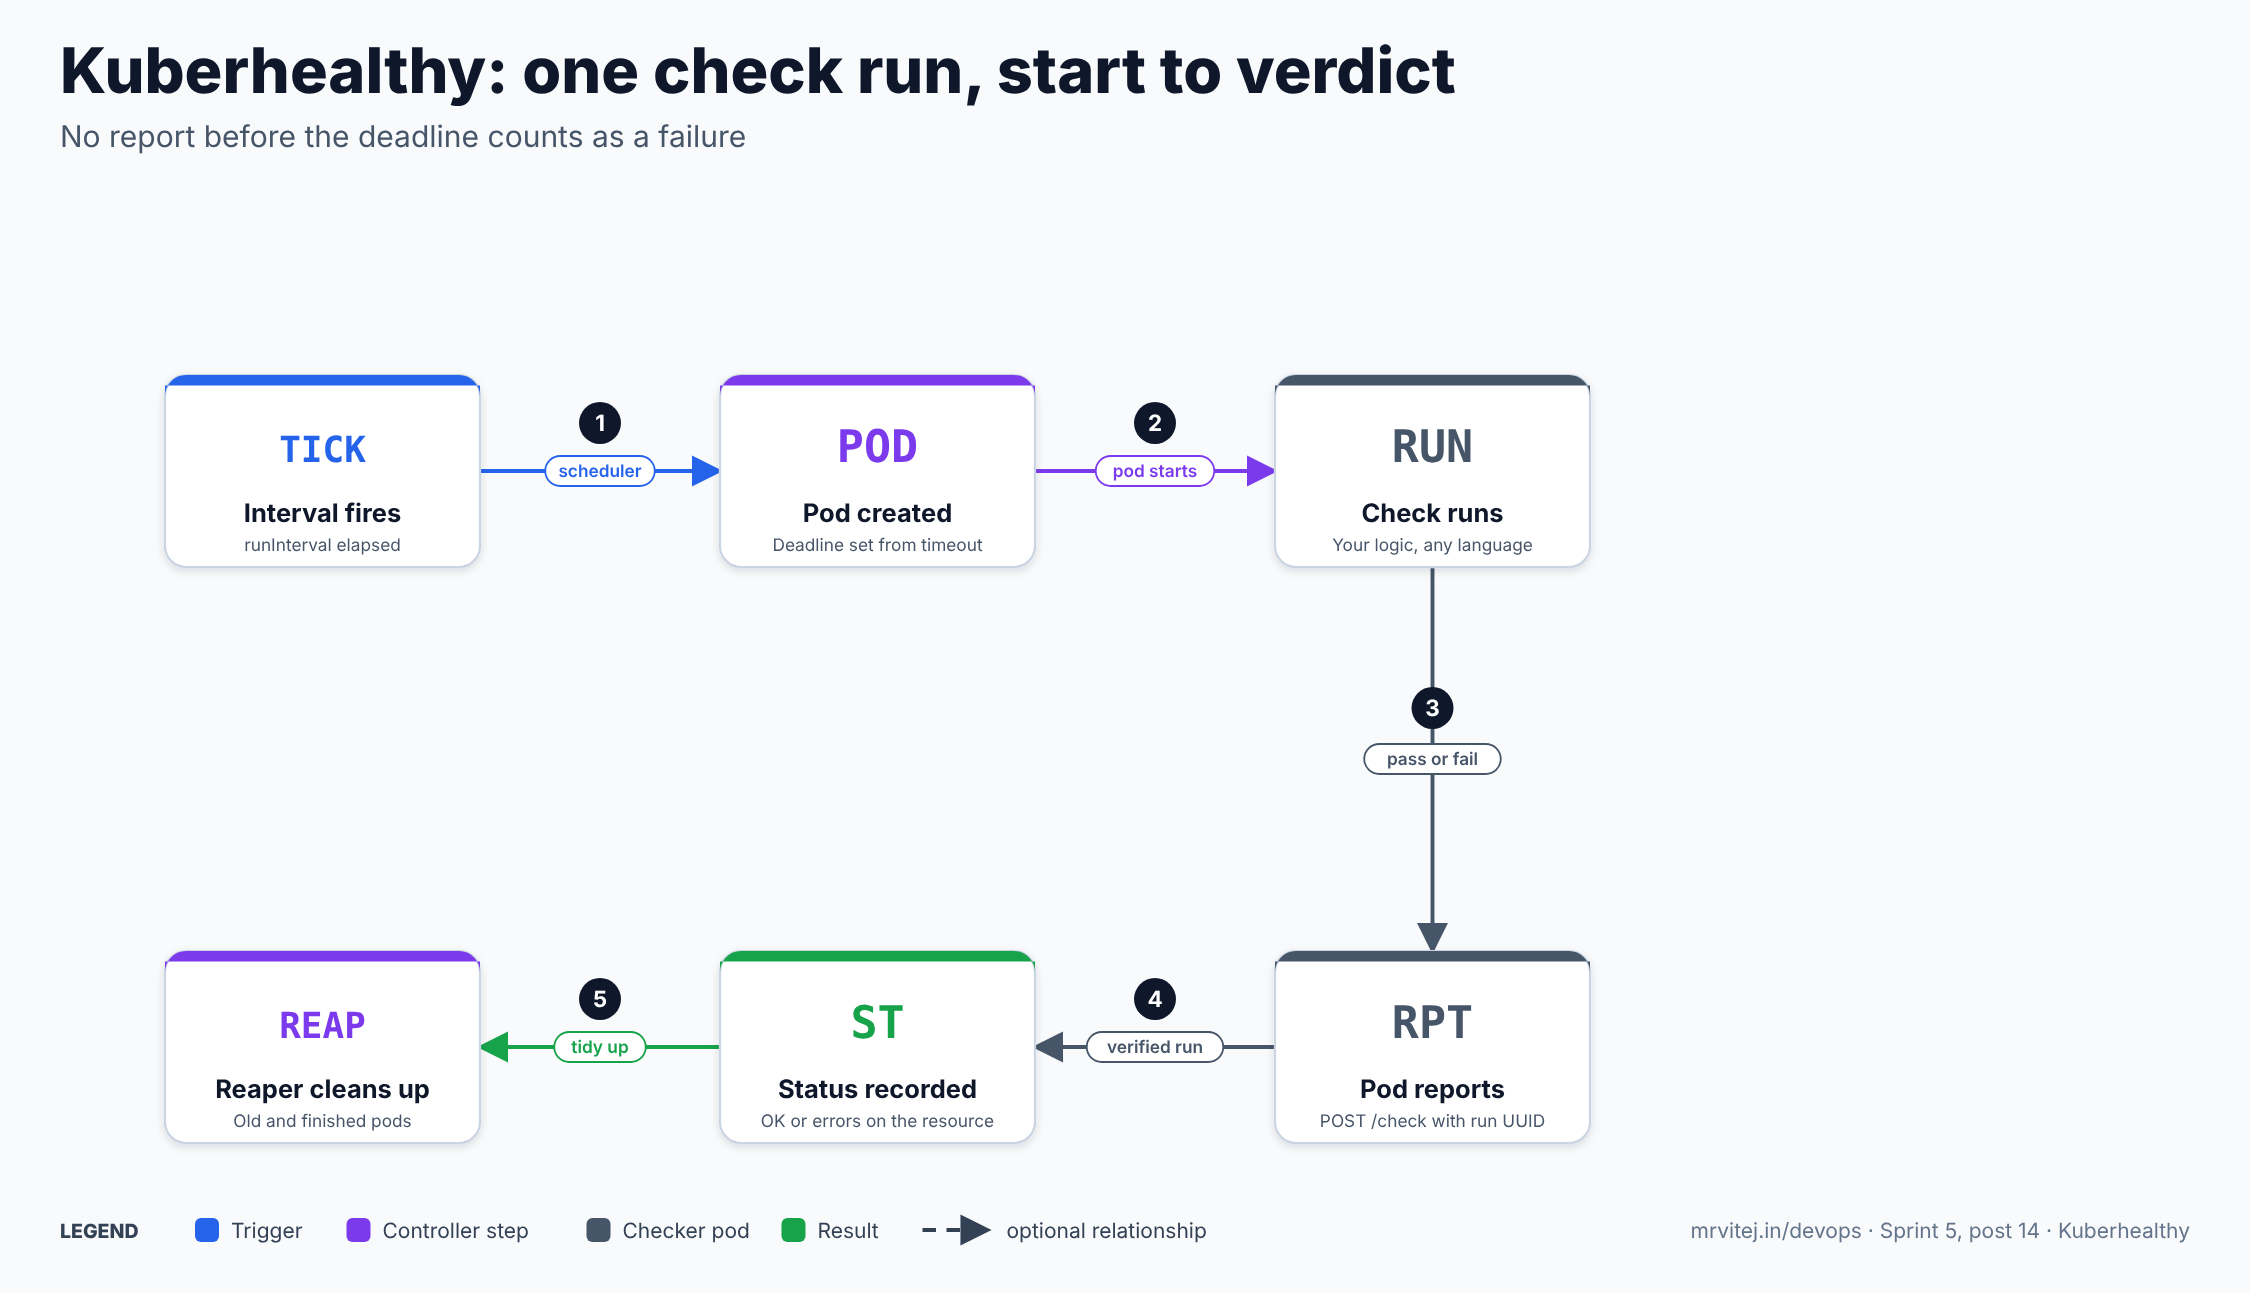
No report before the deadline counts as a failure. Open the zoomable diagram, or download it as SVG or PNG.
- The run interval elapses and the scheduler starts a run.
- The controller creates the checker pod from
spec.podSpec, with a run UUID and a deadline derived fromspec.timeout. - The pod runs your logic.
- The pod reports back to the controller (the README shows a
POST /check). The check clients handle the reporting URL, run UUID and deadline for you. - The controller records the result in the HealthCheck status. The reaper cleans up old pods.
Kuberhealthy repository and docs
Install Kuberhealthy
Commands follow the repository README. I did not run them here. Pin versions.
Helm (the README’s recommended route)
git clone https://github.com/kuberhealthy/kuberhealthy
cd kuberhealthy
helm install kuberhealthy deploy/helm/kuberhealthy -n kuberhealthy --create-namespace
The README installs from the chart directory in the repository. Older guides used a published chart repository (helm repo add kuberhealthy ...); that is v2-era, so use the v3 instructions.
Kustomize
kubectl apply -k github.com/kuberhealthy/kuberhealthy/deploy/kustomize/base?ref=mainReplace main with a release tag you have reviewed.
Argo CD
The repository includes deploy/argocd/kuberhealthy.yaml for an Argo CD application.
Look at it
kubectl -n kuberhealthy port-forward svc/kuberhealthy 8080:80
# open http://localhost:8080  (status UI)
# http://localhost:8080/json  (machine-readable status)
# http://localhost:8080/metrics (Prometheus)
kubectl -n kuberhealthy get healthcheck
Using Kuberhealthy
Snippets are adapted from the README and are untested here. The README’s example uses apiVersion: kuberhealthy.github.io/v2 for the v3 HealthCheck; confirm against your installed CRD with kubectl get crd and kubectl explain healthcheck.spec.
A built-in style check
apiVersion: kuberhealthy.github.io/v2
kind: HealthCheck
metadata:
  name: deployment
  namespace: kuberhealthy
spec:
  runInterval: 10m
  timeout: 5m
  podSpec:
    serviceAccountName: deployment-sa
    containers:
      - name: main
        image: <deployment-check image and tag>
        resources:
          requests:
            cpu: 10m
            memory: 50Mi
The deployment check creates a Deployment, waits for it to be ready and cleans up, which tests scheduling, image pulls and the API end to end. Use the image and service account from the check’s own repository.
A custom check
A custom check is any container that does a test and reports. The README’s Go example calls checkclient.ReportFailure([]string{...}) or checkclient.ReportSuccess():
package main

import (
	"time"

	// import path of the Go check client, per the Kuberhealthy docs
	"github.com/kuberhealthy/kuberhealthy/v3/pkg/checkclient"
)

func main() {
	// Example: fail if the newest record is more than 10 minutes old.
	age, err := newestRecordAge() // your own function
	if err != nil {
		_ = checkclient.ReportFailure([]string{err.Error()})
		return
	}
	if age > 10*time.Minute {
		_ = checkclient.ReportFailure([]string{"newest record is older than 10 minutes"})
		return
	}
	_ = checkclient.ReportSuccess()
}
Package it as an image and reference it:
apiVersion: kuberhealthy.github.io/v2
kind: HealthCheck
metadata:
  name: data-freshness
  namespace: kuberhealthy
spec:
  runInterval: 5m
  timeout: 1m
  podSpec:
    containers:
      - name: main
        image: <registry>/data-freshness-check:<tag>
        env:
          - name: STATUS_URL
            value: https://status.example.internal/latest
I could not read the current check creation guide in this pass (the fetch was rate limited), so the import path above and the exact reporting details are unverified. Older v2 documentation describes a non-Go route: POST JSON with an OK flag and an Errors list to the reporting URL, with the run UUID in a header and an environment variable carrying the deadline. Check the v3 guide before relying on it.
Run once
The v3 release notes describe a HealthCheck that can run once as a single-use check or repeatedly on a schedule. I did not verify the field name that selects single-run mode; check kubectl explain healthcheck.spec.
Run now
The status UI has a “run now” button that triggers a check and shows details of the running pod.
Alert on failures
kuberhealthy_check{check="kuberhealthy/deployment", status="0"} == 1kuberhealthy_check carries check, namespace and status labels. In the older Kubernetes blog’s availability query a status of 0 marks a failing run; confirm the label values on your version before alerting.
Features
| Area | What you get |
|---|---|
| One resource | HealthCheck for scheduled and single-use checks, with status stored on the resource |
| Any language | Checks are containers; client libraries for Go, Python, TypeScript, JavaScript, Rust, Ruby, Java and Bash |
| Scheduling and timeouts | runInterval and timeout per check; run-now from the UI |
| Status UI | A live-updating web page, served on port 80 of the service |
| JSON API | /json returns an overall ok and a checks map keyed by namespace/name with ok, errors, lastRun and runDuration |
| Metrics | kuberhealthy_check (check, namespace, status), kuberhealthy_check_duration_seconds and kuberhealthy_check_success_total, plus controller metrics |
| Events and reaping | Lifecycle events for checks and a reaper for checker pods |
| Check registry | A registry of community checks, such as AWS IAM role, AMI exists, HTTP, HTTP content and image pull checks listed in the older registry. In v3 checks live in separate repositories under the kuberhealthy organization |
| Deployment options | Helm, Kustomize, Argo CD and a local Podman-based setup for development |
| Possible built-in probes | A proposal (issue 1557) for HTTP and TCP probes run by the controller without a pod was closed as completed on 15 November 2026; I could not confirm it has shipped in a release |
Configuration reference
| Setting | Purpose |
|---|---|
spec.runInterval |
How often a scheduled check runs |
spec.timeout |
When a run counts as failed; the default checker pod run timeout is 30s |
spec.podSpec |
The checker pod template: image, env, resources, serviceAccountName, tolerations and so on |
status |
Written by the controller: outcome, errors, last run, duration and consecutive failure counts (v3.0.19 fixed consecutive failure tracking) |
| Injected environment | A reporting URL, a run UUID and a run deadline, handled by the check clients |
| Helm values | Controller image, service, ServiceMonitor and reaper settings; read deploy/helm/kuberhealthy for your version |
| Service | The controller is reached at svc/kuberhealthy on port 80 in its namespace |
| Metrics endpoint | /metrics on the controller service |
| Status endpoints | / (UI) and /json |
| v2 settings | Older docs describe maxCheckPodAge, maxCompletedPodCount and Influx forwarding in a ConfigMap; these were v2 and I did not confirm which still exist in v3 |
Production reference design
- Pick checks that match user journeys. Deploy-and-resolve, DNS, image pull, storage provisioning, and one or two checks against your own critical services.
- Keep checks cheap and idempotent. A check runs repeatedly and must clean up after itself.
- Set realistic intervals and timeouts. Short intervals create many pods; set the timeout comfortably above normal run time.
- Use least-privilege service accounts. A deployment check needs rights to create and delete Deployments in a test namespace, not cluster-admin.
- Scrape and alert. Add a ServiceMonitor or scrape annotation, and alert on consecutive failures rather than a single blip.
- Keep checks in Git next to your other manifests and deploy them with Argo CD or Flux.
- Run the controller with resource requests and a PodDisruptionBudget suited to your cluster.
- Test failure. Break a dependency in a lab and confirm the alert and status page show it.
Security
| Area | What to know |
|---|---|
| Check pods run your code | Treat check images like any workload image: pin tags, scan, and use a trusted registry |
| Service accounts | Each check can use its own service account. Grant only the verbs the check needs |
| Cross-namespace behaviour | Checks that create resources should use a dedicated namespace with quotas |
| Status UI exposure | The service is ClusterIP by default in older docs. The UI has a run-now button, so do not expose it publicly without authentication in front |
| Secrets in checks | Pass credentials through Kubernetes Secrets, not environment values in plain YAML |
| Egress | A check that calls external endpoints needs network policy and egress rules, which are also what it tests |
| Supply chain | v3 moved checks into separate repositories; review each check’s source and image before running it |
| Project health | Sandbox maturity and a large v3 rewrite mean you should review recent activity before adopting |
Monitoring and day-2 operations
| Task | How |
|---|---|
| See all checks | Status UI, /json or kubectl get healthcheck -A |
| Inspect one | kubectl describe healthcheck <name> -n <ns> and the checker pod logs while it runs |
| Trigger now | The “run now” button in the UI |
| Change a schedule | Edit the HealthCheck; v3.0.20 makes the scheduler pick up the change immediately |
| Upgrade | Controller and UI images and CRDs together; patch releases state when no migration is needed |
| Move from v2 | Follow the migration guide; the CRD and API changed |
| Add a check | Apply a new HealthCheck manifest |
| Clean up | The reaper removes old pods; delete a HealthCheck to stop its checks |
| Symptom | First checks |
|---|---|
| Check always fails after 30s | Default timeout; raise spec.timeout |
| Check never runs | Controller logs, HealthCheck namespace and service account, scheduler after a recent change |
| Pod fails to start | Image pull, resources, service account and quotas |
| Metrics missing | Prometheus scrape of /metrics and the service monitor |
| Wrong status after timeout | Check pod finished late; compare run duration with the deadline |
| Too many finished pods | Reaper behaviour and check frequency |
| Upgrade from v2 broke checks | v3 changed the CRD; migrate checks |
Usage cases
- Cluster basics. Deploy a workload, resolve DNS, pull an image, provision a volume, on every cluster you run.
- Platform guardrails. Check that a network policy still allows the paths it should.
- Dependency checks. HTTP, queue or database reachability from inside the cluster.
- AWS-specific checks. The older registry lists an IAM role check (can pods call AWS APIs) and an AMI exists check.
- Release verification. Run a check after an upgrade as a gate.
- Cold-chain sprint project. Synthetic checks for the Sprint 5 final project, such as confirming that no vehicle has been silent for 10 minutes.
Operational considerations
- It is synthetic. It tells you the path works at the moment of the run, not what every user saw in between.
- Each run is a pod. Frequent checks create churn on the scheduler and API server.
- v3 is a rewrite. Documentation, check repositories and examples from the v2 era may not match.
- Documentation is moving. Some pages and guides still describe v2 resources and settings.
- A single controller. Plan its availability like any monitoring component.
- Check quality is on you. A weak check gives false confidence.
- Sandbox maturity. Smaller community and governance than graduated projects.
Adoption
Kuberhealthy began at Comcast, and the Kubernetes blog post that introduced its KPI approach was written by Comcast engineers. The repository has an ADOPTERS.md, which I did not read in this pass, so I am not naming adopters here.
Alternatives
| Solution | Model | Best suited to |
|---|---|---|
| Prometheus Blackbox Exporter | Probes HTTP, TCP, DNS and ICMP endpoints from an exporter | Endpoint probing when you do not need checks that create Kubernetes resources |
| Grafana Cloud synthetic monitoring | Hosted probes and agents | Teams already on Grafana Cloud who want external probe locations |
| Commercial synthetic monitoring (Datadog, New Relic and others) | SaaS | Teams that prefer a managed service |
| Kubernetes CronJobs with scripts | DIY | Simple one-off checks; no common status or metrics |
| Argo Workflows or Tekton on a schedule | Workflow engines | Multi-step test pipelines |
| End-to-end test suites | CI-driven | Pre-release validation rather than continuous production checks |
Strengths and limitations
| Strengths | Limitations |
|---|---|
| Checks are Kubernetes manifests in Git | v3 is new; docs and tooling still catching up |
| Any language and any container | Each run creates a pod |
| One resource holds definition and status | Single controller to run and protect |
| Status page, JSON and Prometheus metrics | Synthetic, so it samples rather than observes every request |
| Strong fit for cluster-level validation | You write and maintain the checks |
| CNCF Sandbox project | Smaller community than graduated tools |
Project status and roadmap
Kuberhealthy began at Comcast, was accepted into the CNCF Sandbox on 30 March 2021, and was completely rewritten for v3, which has one HealthCheck resource, a live status UI, a reaper, Prometheus metrics and new deployment options. Patch releases since then fix scheduler and failure-tracking behaviour. I did not find a published roadmap page in this pass. The repository has a TODO.md that, according to an issue, listed ideas such as port and HTTP content checks, but I did not read it.
Recommendation
Trial Kuberhealthy if you run Kubernetes clusters and want continuous end-to-end validation (deploy, DNS, image pull, storage, key service paths) expressed as manifests with Prometheus alerts. Adopt it for a defined set of cluster-level checks once the failure alerts are tested and the check images and service accounts are reviewed. Assess Blackbox Exporter if you only need endpoint probing, a hosted synthetic service if you want external vantage points, and a workflow engine if checks are long multi-step pipelines. Before production: confirm the v3 install and CRD version, set realistic timeouts, scope service accounts, scrape the metrics, alert on consecutive failures, and test one failure end to end.
References: Kuberhealthy repository · v3.0.0 release notes · v3.0.5 release notes · v3.0.20 release · v3.0.19 release · HTTP and TCP check proposal · Scheduler wake issue · CNCF project page · Check creation guide (v2 era) · Checks registry · Kubernetes blog: K8s KPIs with Kuberhealthy · InfraCloud: synthetic monitoring with Kuberhealthy