openGemini is an open-source time-series database for telemetry: metrics, device readings and logs that arrive continuously, carry a timestamp and are queried mostly by time range. It was created by Huawei Cloud’s database team, open-sourced in 2022 and accepted into the CNCF at the Sandbox level on July 9, 2024. It is written in Go under the Apache-2.0 licence. You write to it with the InfluxDB v1 line protocol, query it with InfluxQL (or PromQL), and it is built to scale out as a cluster of three kinds of process. This brief explains the project from the problem it solves to installing, configuring, securing and operating it, and is honest about where its documentation and community are thin.
CNCF daily · Sprint 5, post 5 of 14 · Database
At a glance
| Category | App Definition and Development, subcategory Database (CNCF Landscape) |
| CNCF status | Sandbox, accepted July 9, 2024 |
| Written in | Go (go.mod on main targets Go 1.26) |
| License | Apache-2.0 |
| Origin and maintainers | Created by Huawei Cloud; the six maintainers in MAINTAINERS.md are all Huawei-affiliated |
| Architecture | Three components: ts-sql (stateless access and query), ts-meta (metadata, Raft) and ts-store (LSM storage). ts-server bundles all three for one node |
| Write interfaces | InfluxDB line protocol over HTTP /write, Prometheus remote write, a record (column) write protocol, an Arrow Flight column protocol (off by default) |
| Query interfaces | InfluxQL-style language (“GeminiQL”) over HTTP /query and a CLI; PromQL since v1.3.0 |
| Default ports | ts-sql HTTP 8086, Flight 8087; ts-meta 8088, 8091 (HTTP), 8092 (RPC) |
| Releases | Stable tags v1.5.0, v1.5.1 and v1.5.2; v1.5.3 was at release candidate 5 when I checked. Check the releases page for the current one |
| Install | Release tarball and ts-server, gemix (cluster), an operator for Kubernetes, or build from source |
The problem openGemini solves
A time-series workload has an awkward shape. Writes are constant, append-only and bursty. Each point is tiny, but there are very many of them. Queries ask for a time window, usually filtered by a few labels such as a device or a site, and often downsampled. Data ages: yesterday’s readings matter in full detail, last year’s only as hourly averages, and some data must simply expire.
A general-purpose relational database can store this, but you end up hand-building partitioning by time, expiry jobs and rollups. A single-node time-series database handles the shape well until the write rate, the number of distinct series or the retention outgrow one machine. openGemini targets that second step: it keeps the InfluxDB v1 ecosystem (line protocol, InfluxQL, existing client libraries and agents such as Telegraf) but spreads storage and query across nodes, and adds features for large series counts, downsampling and retention.
Key concepts
| Term | Meaning |
|---|---|
| Measurement | The “table”: a named set of points, for example readings. |
| Tag | An indexed label (device_id, site). Each unique tag combination in a measurement is one series. |
| Field | The measured values (temp_c, door_open). Fields are not indexed. |
| Point | One row: measurement, tags, fields and a timestamp. One line of line protocol is one point. |
| Series cardinality | The number of unique series. Very high cardinality is the classic way to overload a time-series index. |
| Database and retention policy | A database holds measurements. A retention policy (RP) sets how long data is kept, the shard duration and the replication factor; every database has a default RP named autogen. |
| Shard and shard group | Data is partitioned first by time into shard groups, then spread over ts-store nodes. Dropping an expired time range means dropping whole shards. |
| Shard key | An optional key that spreads a measurement’s data across stores. Without it, series are hashed by name. |
| Continuous query (CQ) | A stored query that runs on a schedule and writes aggregates into another measurement or RP, for downsampling. |
| Subscription | A rule that forwards writes arriving at the cluster to other HTTP endpoints. |
Architecture
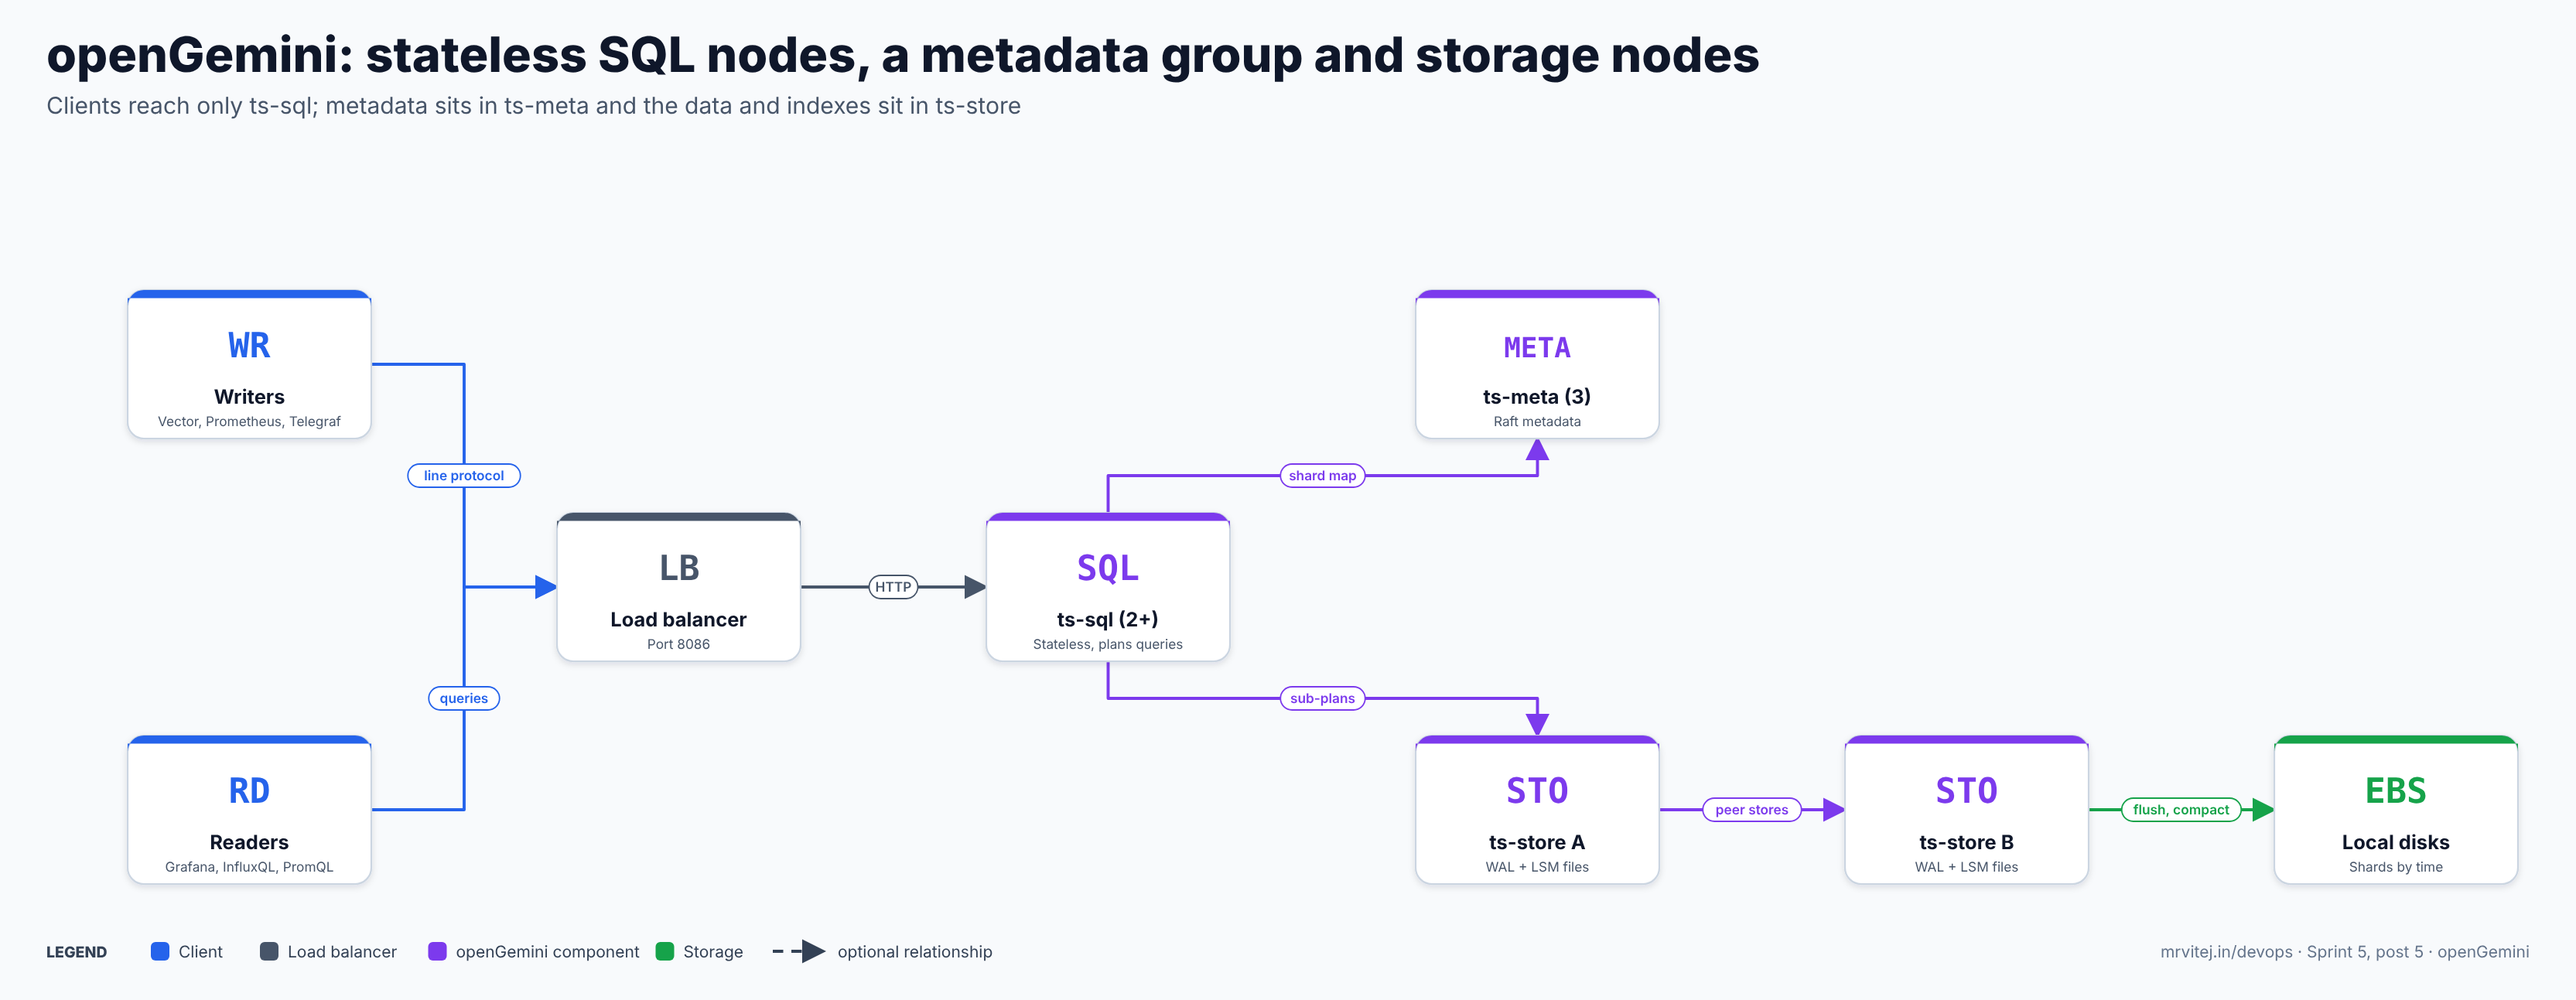
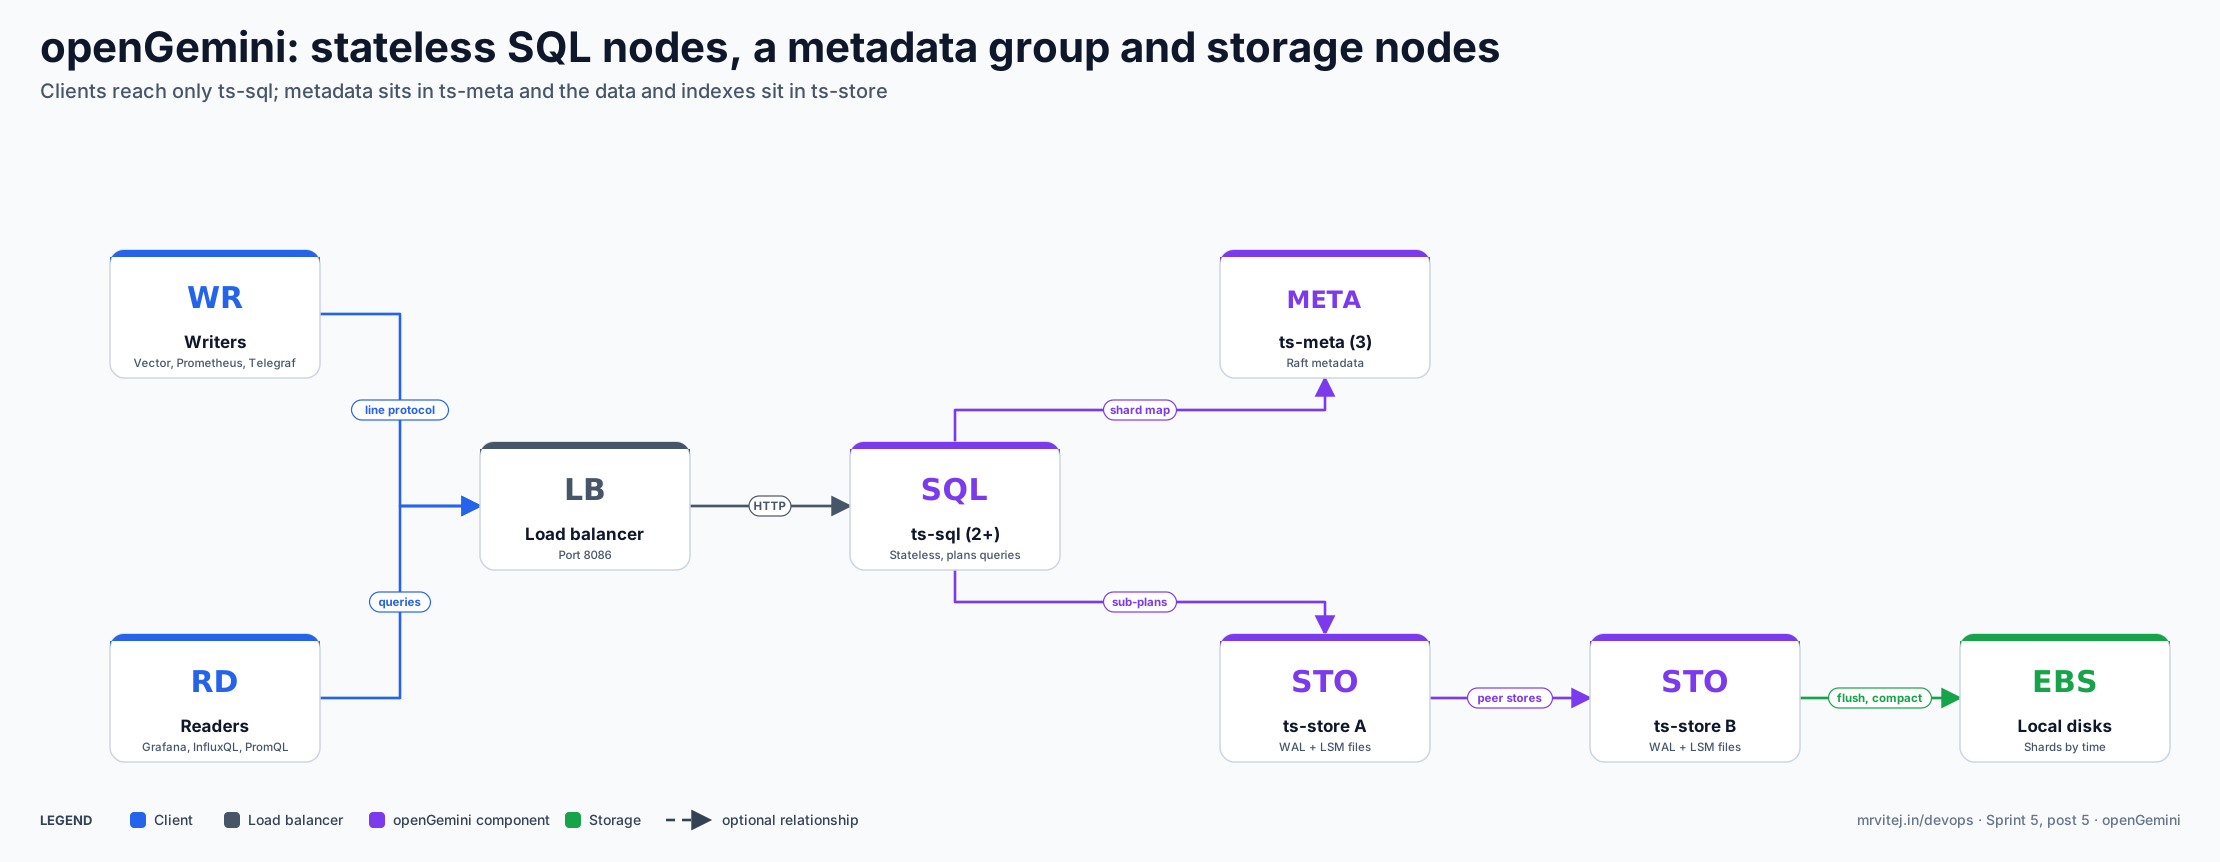
Clients talk only to ts-sql. ts-meta holds the cluster map and ts-store holds the data. Green is a destination, purple is an openGemini component, blue is a client and dark grey is the load balancer. Open the zoomable diagram, or download it as SVG or PNG.
| Component | Responsibility |
|---|---|
ts-sql |
The single front door for reads and writes. On a write it validates the format, hashes the data by series and forwards it to the right ts-store. On a query it builds a distributed plan, sends sub-plans to the stores and merges the results. It is stateless, so you scale it out behind a load balancer. |
ts-meta |
Holds metadata: databases, measurements, retention policies, shard layout and cluster membership. The documented cluster layout uses three ts-meta nodes. |
ts-store |
Stores and queries the data. It appends writes to a write-ahead log and an in-memory buffer, flushes to an LSM-tree layout on disk with compaction, and uses an inverted index to find the series involved in a query. It scales out. |
ts-server |
A single binary that runs a ts-sql, a ts-meta and a ts-store together, for one node. |
ts-monitor |
An optional agent that reports process and disk metrics and error logs from each node. |
Design principle. Separate the stateless front door from the stateful storage. Because ts-sql holds no data, you can add or lose query nodes freely, and because ts-store owns time-partitioned shards, expiry and rollups work on whole shards instead of row by row.
From a raw reading to a stored point
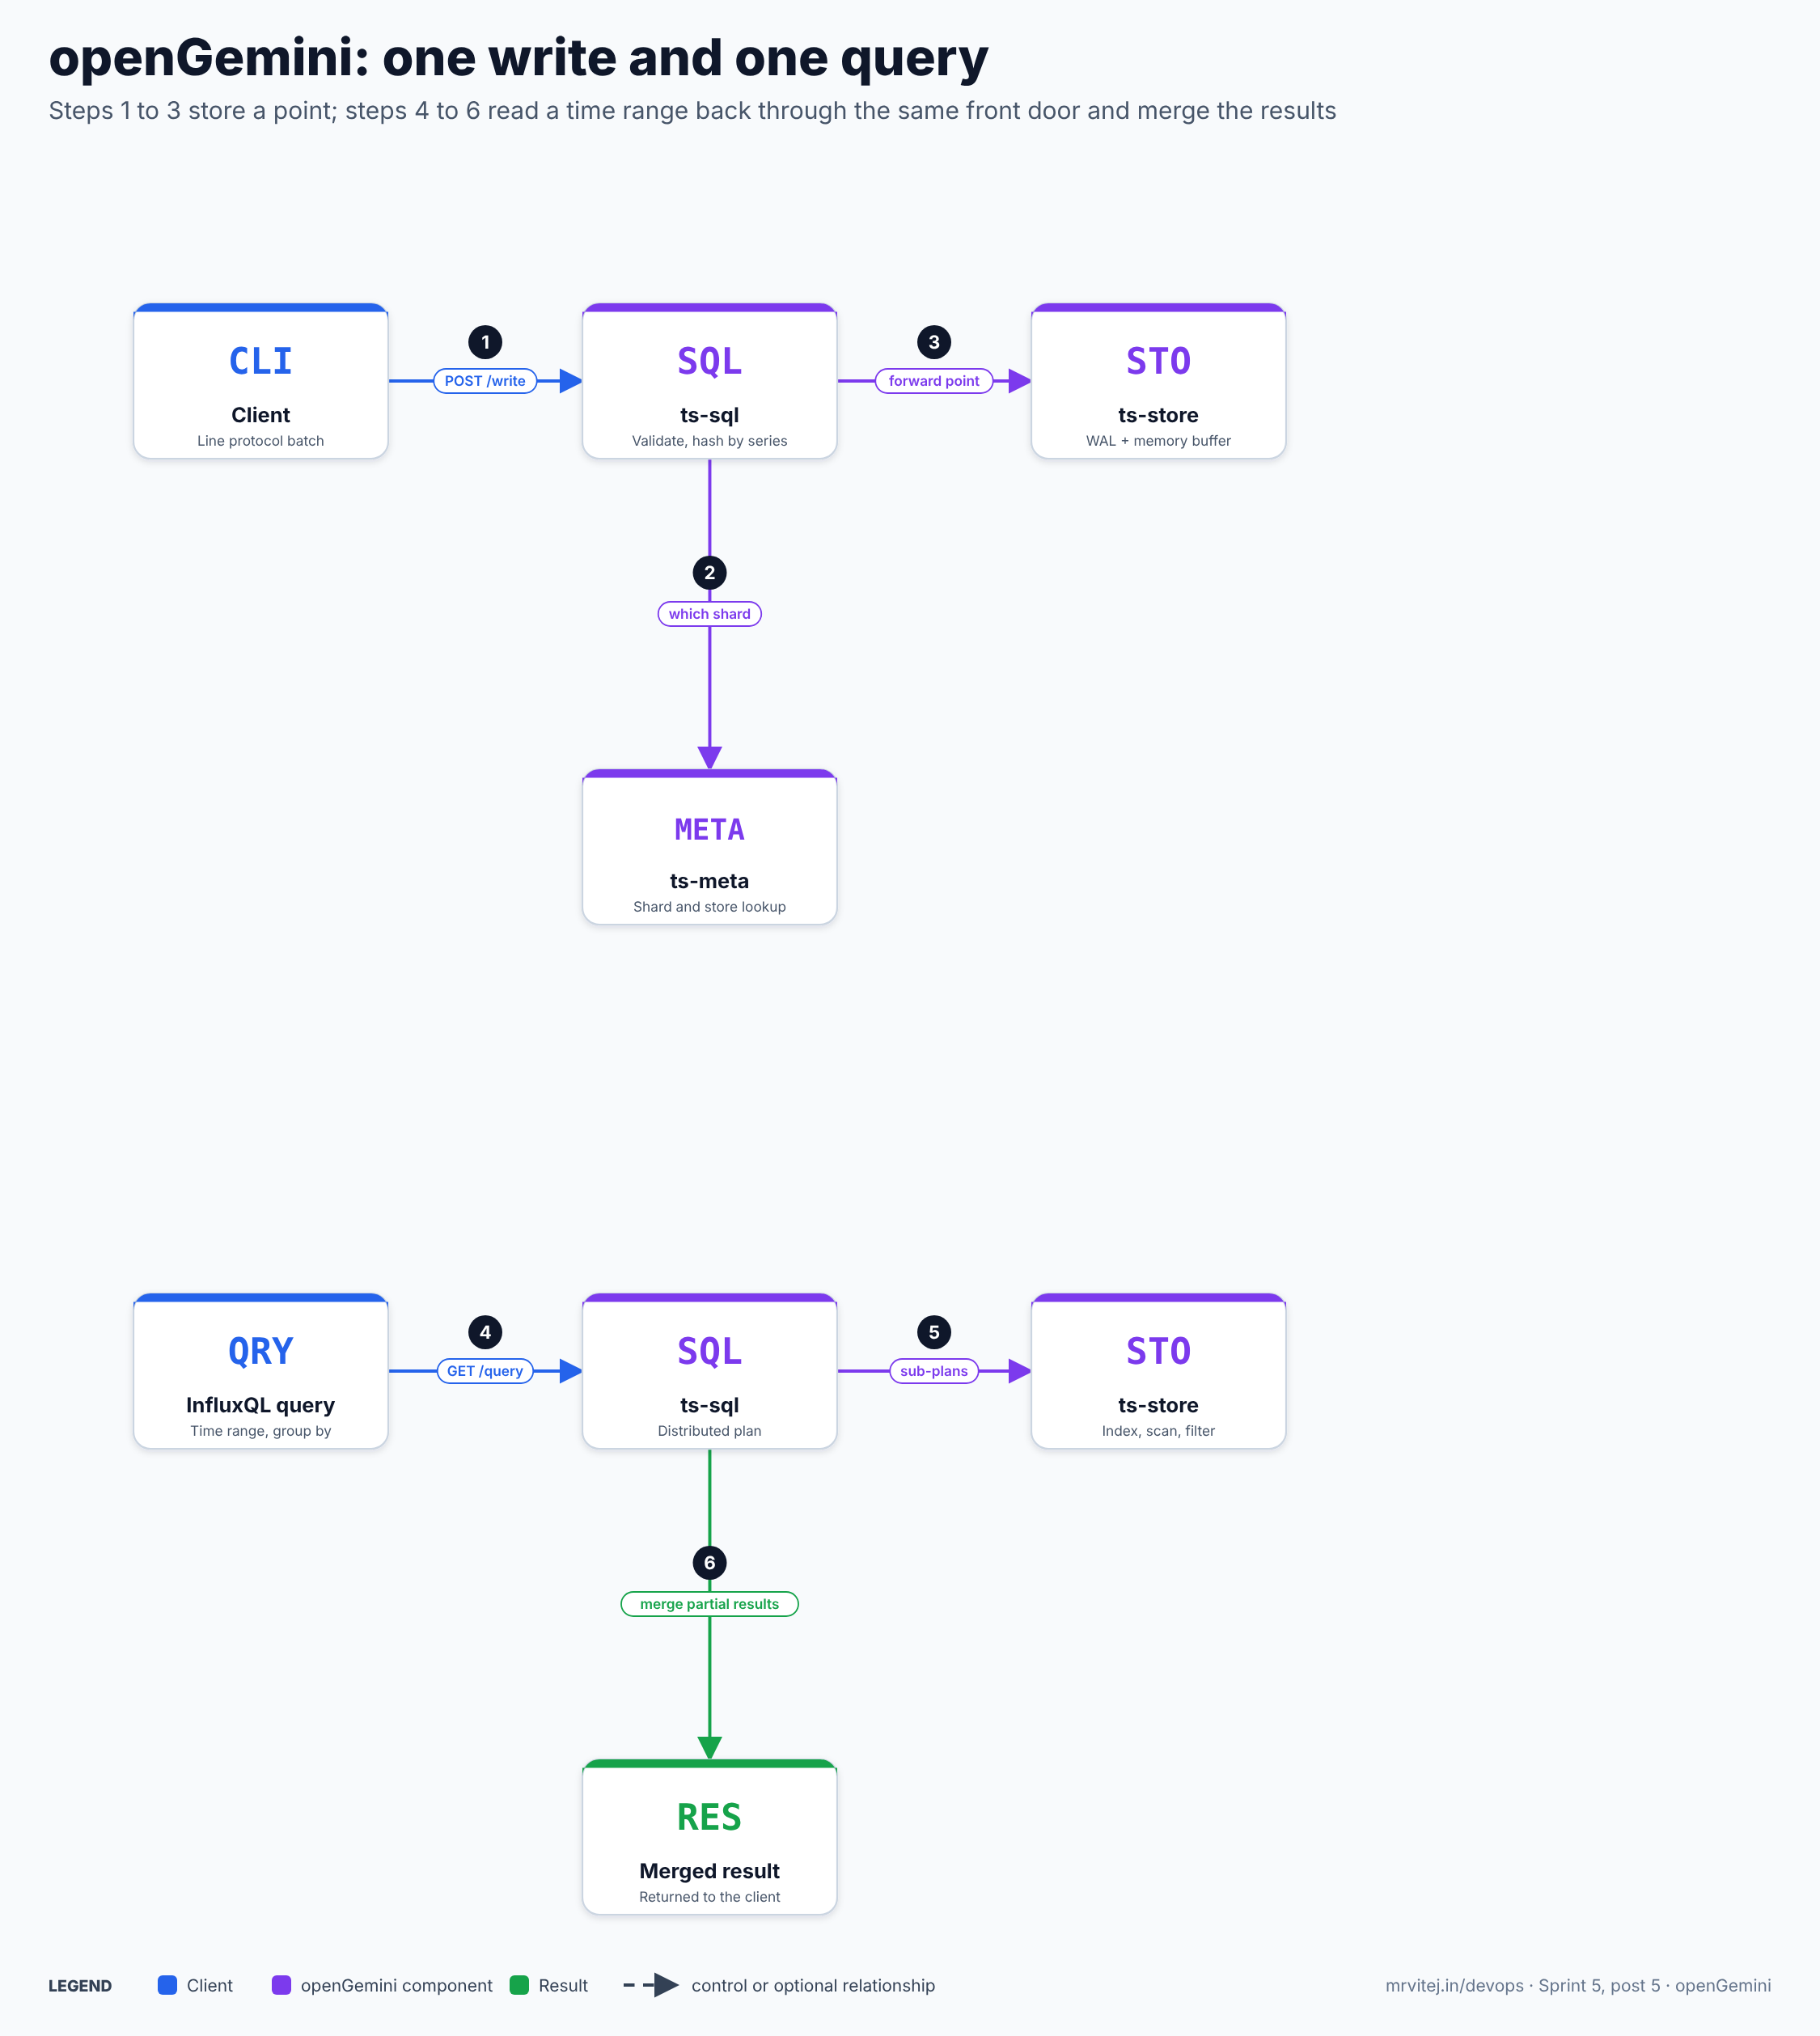
One write and one query. Open the zoomable diagram, or download it as SVG or PNG.
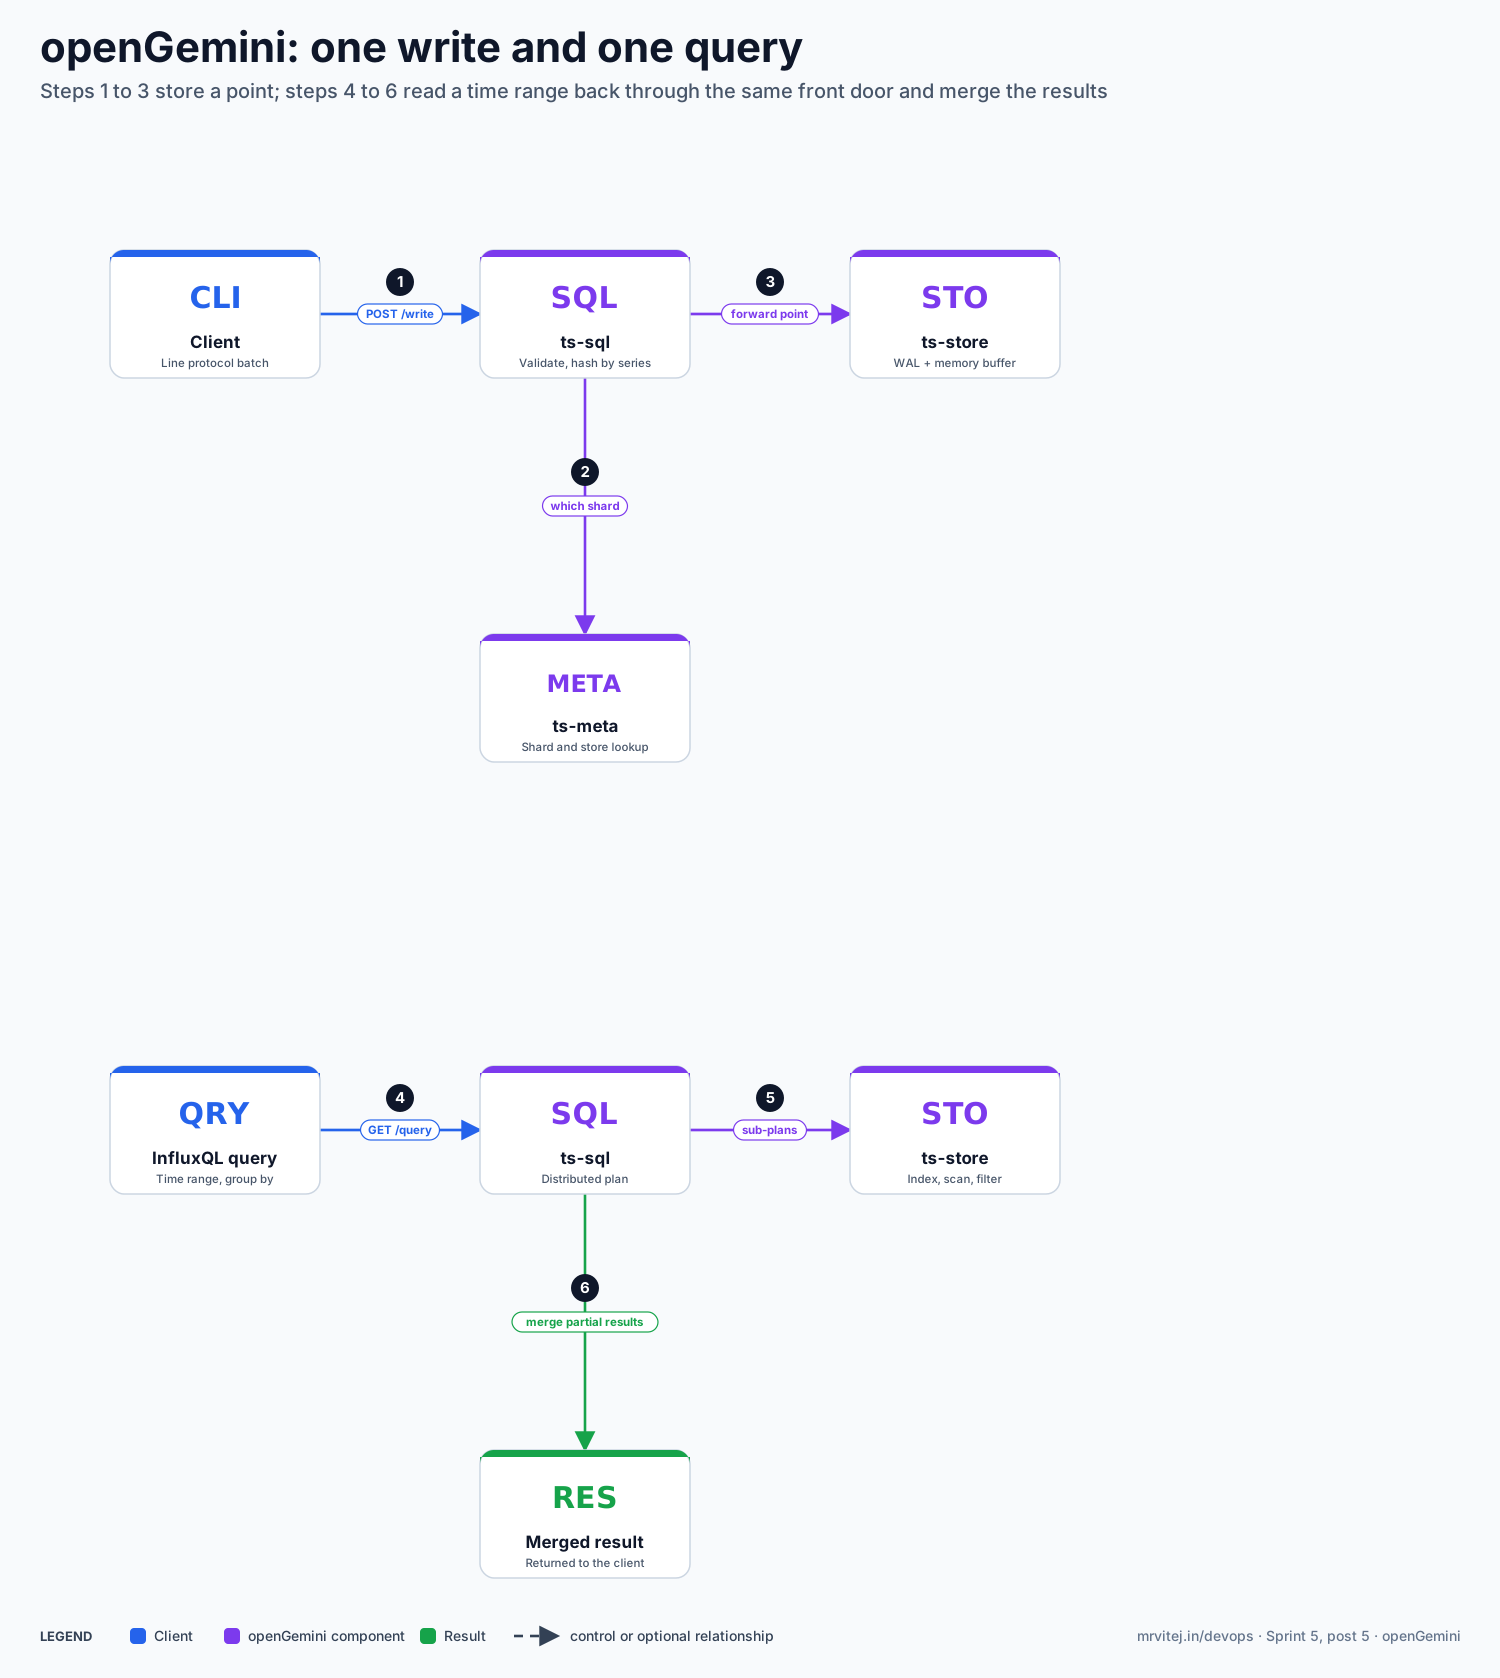
- A client sends
POST /write?db=telemetrywith line protocol to anyts-sqlnode. ts-sqlparses and validates the lines, then looks up which retention policy and shard group the timestamps fall into.- It hashes each point by its series (or shard key) and picks the owning
ts-store. - The store appends the point to its write-ahead log and in-memory buffer and answers success.
- Later the buffer is flushed to immutable files and compacted in the background.
- A query (
SELECT mean(temp_c) FROM readings ... GROUP BY time(5m)) reachests-sql, which sends sub-queries to the stores holding the relevant shards and merges what comes back.
The flow is my reading of the documented architecture; exact internals (such as batching and acknowledgement timing) vary with configuration and version.
Cluster architecture in the docs
Install openGemini
The official documentation offers several routes. Pick by purpose:
| Route | Use it for |
|---|---|
Release tarball and ts-server |
A single node for learning and tests |
gemix |
Installing and managing a multi-node cluster on VMs or servers; the docs call it the recommended cluster route |
Manual ts-meta, ts-store, ts-sql |
Understanding how the pieces start; the docs themselves say it is not recommended |
| openGemini operator | Kubernetes; a separate project from the main repository |
| Build from source | Contributors; requires a recent Go toolchain and Python for the build script |
Single node
The quick start downloads the release tarball for your platform, unpacks it and starts the standalone binary. Replace <version> with a release you chose from the releases page:
wget https://github.com/openGemini/openGemini/releases/download/v<version>/openGemini-<version>-linux-amd64.tar.gz
tar -xzf openGemini-<version>-linux-amd64.tar.gz
# ts-server reads openGemini.singlenode.conf
./usr/bin/ts-server -config etc/openGemini.singlenode.conf
The paths inside the tarball and the exact flags change between versions, so follow the quick start for the version you downloaded. Two defaults matter: it listens on 127.0.0.1:8086, and data and logs go to /tmp/openGemini. Change both before you keep anything you care about. The repository also has scripts/install.sh and scripts/install_cluster.sh for local single-node and “pseudo-cluster” runs.
The CLI
The bundled ts-cli was removed from the main repository in November 2026; it now lives in its own repository, openGemini-cli, and installs with Go:
go install github.com/openGemini/openGemini-cli/cmd/ts-cli@latest
ts-cli --host 127.0.0.1 --port 8086
Older tarballs still contain a ts-cli. Any InfluxDB v1 client and plain curl also work against the HTTP API.
A cluster
A minimal documented topology is three ts-meta, two ts-sql and two ts-store, each component on its own node so the ports do not clash. Nodes find the metadata group through meta-join:
[common]
  meta-join = ["10.0.1.11:8092", "10.0.1.12:8092", "10.0.1.13:8092"]
Start ts-meta first, then ts-store, then ts-sql. Use gemix for anything beyond a lab, and use host names rather than raw IPs if node addresses can change.
Using openGemini
Examples below use neutral sensor data. I have not run these against a live cluster; they follow the official documentation, so check them against your version.
Create a database with retention
CREATE DATABASE telemetry WITH DURATION 90d REPLICATION 1 SHARD DURATION 1d NAME rp90dOmit the WITH clause and you get the default autogen policy with unlimited duration. Shard duration defaults depend on the retention duration (one hour under two days, one day up to about six months, seven days beyond that).
Write line protocol over HTTP
curl -i -XPOST "http://localhost:8086/write?db=telemetry&precision=s" --data-binary '
readings,device_id=d001,site=depot-a temp_c=4.1,door_open=false 1799884800
readings,device_id=d002,site=depot-a temp_c=3.8,door_open=false 1799884800
'
A successful write returns 204. The docs show exactly this endpoint shape (/write?db=... with --data-binary). Write in batches, not one point per request.
Query with InfluxQL
curl -G "http://localhost:8086/query" \
  --data-urlencode "db=telemetry" \
  --data-urlencode "q=SELECT mean(temp_c) FROM readings WHERE time > now() - 1h GROUP BY time(5m), device_id"
Explicit tables and shard keys
The README also describes creating a measurement explicitly and naming a shard key, so data is partitioned by time first and by your key second:
CREATE MEASUREMENT readings WITH SHARDKEY siteChoose a shard key with enough distinct values to spread load, and avoid one with a handful of values.
Downsample with a continuous query
CREATE CONTINUOUS QUERY cq_hourly ON telemetry
BEGIN
  SELECT mean(temp_c) INTO telemetry.rp90d.temp_hourly FROM readings GROUP BY time(1h), device_id
END
Create the target retention policy before the CQ. A reported 2024 issue (on v1.2.0) showed a CQ pointing at a missing retention policy stopping ts-sql; I did not check whether it is fixed in the current release, so create targets first and test on your version.
Prometheus remote write and PromQL
remote_write:
  - url: "http://127.0.0.1:8086/api/v1/prom/write?db=prometheus"
remote_read:
  - url: "http://127.0.0.1:8086/api/v1/prom/read?db=prometheus"
Create the database first. PromQL queries (instant and range, label and series metadata) have been supported since v1.3.0. The docs ask you to read and write through the same API family: data written with /api/v1/prom/write is read with /api/v1/prom/read or /api/v1/query.
Send data from Vector
Vector’s influxdb_logs sink emits line protocol, so pointing its endpoint at ts-sql on 8086 with database: telemetry is the intended path. This was not tested in the Vector brief or here, and the sprint’s final project (Part 2) must verify it, including how the sink maps event fields to tags and fields.
Features
| Feature | What it gives you |
|---|---|
| InfluxDB v1 compatibility | Line protocol, InfluxQL and existing client libraries and agents work with little or no change |
| Prometheus remote read/write and PromQL | Use it as long-term storage for Prometheus, or query with PromQL |
| Distributed MPP layout | Scale query nodes and storage nodes independently |
| LSM storage with columnar compression | Append-heavy writes and compressed storage; the project claims large compression ratios |
| High-cardinality engine | A separate storage engine for very large series counts, with its own feature limits (for example, it does not support Prometheus remote read/write) |
| Retention policies and table-level TTL | Whole-shard expiry |
| Multi-level downsampling and continuous queries | Keep detail short term and aggregates long term |
| Subscriptions | Forward writes to other HTTP endpoints |
| Data replication | Added in the v1.3 line; read the replication section of the docs for the exact guarantees and limits |
| Monitoring | Built-in metrics and ts-monitor; metrics can be written into an _internal database |
| Stream computing and anomaly detection | Optional analysis features described in the docs; check maturity before relying on them |
The documentation claims large performance gains over InfluxDB for some queries. Treat vendor benchmarks as a starting point and measure your own workload.
Production reference design
This is a design suggestion for AWS, not an official reference architecture, and I have not deployed it.
| Layer | Suggestion |
|---|---|
ts-meta |
Three small EC2 instances in three Availability Zones, each with its own gp3 volume for the metadata directory |
ts-store |
Two or more instances sized for memory and IOPS, local NVMe or gp3 EBS for store-data-dir, and a separate volume for the write-ahead log directory |
ts-sql |
Two or more stateless instances behind a Network Load Balancer on port 8086, scaled on CPU |
| Network | Private subnets, security groups that allow 8086 only from known clients and the meta and store ports only between cluster nodes |
| Placement | Use stable host names (a private Route 53 zone) for meta-join, so instance replacement does not break discovery |
| Backups | EBS snapshots of the data volumes, and a tested restore; copy snapshots to another Region if required |
| Sizing | Start from your points per second and series count, then load test; do not size from the headline claims |
Security
Treat the defaults as a lab setup.
| Control | Detail |
|---|---|
| Authentication | auth-enabled = false by default. Create an administrator account first, then enable it in the [http] section and restart. Passwords must be 8 to 256 characters with mixed character classes, and a weak-password list is checked |
| TLS | https-enabled = false by default. Set https-enabled, https-certificate and https-private-key in [http]; a [tls] section can set the minimum version (the docs suggest TLS 1.2) and ciphers |
| Authorisation | Per-database READ, WRITE or ALL privileges for ordinary users; admin users for the rest |
| Credentials in URLs | Prometheus examples put u= and p= in the URL. Prefer Basic auth over TLS and keep secrets out of logs |
| Column and record write paths | Separate flags (flight-auth-enabled, [record-write] with its own TLS and mutual TLS) that are also off by default |
| Network | Keep 8086 off the internet; put a load balancer or private link in front, and restrict the internal ports |
| Subscriptions | Basic auth in the destination URL is supported; avoid sending data to unauthenticated endpoints |
I did not find a published security audit for openGemini in the sources I read.
Monitoring and day-2 operations
| Task | How |
|---|---|
| Health and metrics | Enable the [monitor] section to write node metrics into _internal, and run ts-monitor for disk, process and error-log reports; the docs list more than 260 metrics |
| Capacity | Watch disk, memory and compaction; set max-concurrent-write-limit and max-concurrent-query-limit to protect nodes |
| Scale out | Add ts-sql nodes freely; add ts-store nodes and check how shards rebalance on your version |
| Upgrades | Read release notes first; upgrade ts-meta, then stores, then SQL nodes, and test on a copy |
| Retention and downsampling | Review SHOW RETENTION POLICIES and CQs; the retention and downsample services check on a timer (30 minutes by default) |
| Debug | /debug/ctrl endpoints control compaction, snapshots and flushing; use them carefully |
| Symptom | First checks |
|---|---|
| Writes slow or rejected | Batch size, concurrent write limit, store disk latency and compaction backlog |
| Queries slow | Time range, tag filters, series cardinality, shard duration, result cache settings |
| Node does not rejoin | meta-join addresses, host name resolution, firewall between nodes |
| Disk growing | Retention duration, a DURATION 0s policy, failed or missing downsampling |
ts-sql exits on a CQ |
Missing target retention policy; check logs |
Usage cases
- Device and sensor telemetry. Store high-frequency readings tagged by device and site, query by time window, and keep raw data short and aggregates long.
- Infrastructure monitoring. Use it as remote storage for Prometheus, or as the backend for InfluxDB-style agents.
- Long-term metrics. Offload Prometheus history so a local Prometheus can stay small.
- Industrial and vehicle data. The project’s adopters list names IIoT and smart-energy scenarios.
- Cold-chain sprint project. The Sprint 5 final project keeps a time-series history of every reading in openGemini, queried alongside alerts.
Operational considerations
- Docs age. Several documentation pages I read show page ages of about 1,000 days; defaults and syntax may have moved. Read the docs that match your release and the
config/openGemini.confin that tag. - Dependencies. No external coordination service is needed; metadata uses its own
ts-metagroup. - Replication. Some older doc pages say replication supports only a factor of 1. Replication was added in v1.3; verify current behaviour before promising durability.
- Series design. Keep tags low-cardinality unless you adopt the high-cardinality engine, and know its feature differences.
- Query surface. InfluxQL compatibility is for the v1 language; do not expect Flux or InfluxDB 2.x and 3.x APIs.
- Time source. Points carry client timestamps; keep devices on reliable time and decide how to handle late data.
- Single-node paths. Move data and logs off
/tmp.
Adoption
The project’s own ADOPTERS.md lists seven entries: Huawei Cloud Eye Service, Huawei Cloud IIoT, Huawei Cloud CloudScope, Yinhehangtian, Databuff, Yunnan Yuntianhua and Kehua, across cloud-service monitoring, IT operations monitoring and industrial use. Most are Huawei or China-based. A Huawei Cloud Developer Alliance article on a community live session reports about 25 production clusters inside Huawei Cloud, the largest at 70 nodes handling 20 TB a day; it is vendor-reported and I could not verify it independently. I found no public adopter list outside that region.
Alternatives
| Solution | Model | Best suited to |
|---|---|---|
| InfluxDB (v1, 2.x, 3) | Time-series database | The reference for line protocol and InfluxQL; check licensing of the edition you need |
| TimescaleDB | PostgreSQL extension | SQL and joins with relational data |
| Prometheus with Thanos or Mimir | Pull-based metrics with long-term storage | Pure metrics, PromQL-first teams |
| VictoriaMetrics | Time-series database | Prometheus-compatible, simple operation |
| Apache Druid or ClickHouse | Analytical column stores | Large-scale analytics over events |
| Amazon Timestream | Managed service | Teams that want no database operations on AWS (check current availability and pricing) |
Strengths and limitations
| Strengths | Limitations |
|---|---|
| InfluxDB v1 and Prometheus compatibility eases migration | Sandbox project with all listed maintainers from one company |
| Stateless SQL layer and separate storage layer | Documentation pages are old and partly Chinese-only |
| Retention, downsampling and subscriptions built in | Small public adopter list, mostly in one region |
Single binary for small installs, gemix for clusters |
Authentication and TLS off by default |
Active development on main |
Release candidates and no recent stable since January; track the next release |
| High-cardinality engine for very large series counts | That engine has feature limits (no Prometheus remote read/write) |
Project status and roadmap
openGemini is a CNCF Sandbox project (accepted July 9, 2024). On November 5, 2026 the main branch still received commits (CI, dependency and test changes, a Go 1.26 upgrade and the move of the CLI to its own repository). Stable tags are v1.5.0, v1.5.1 and v1.5.2, with v1.5.3 at release candidate 5. Third-party mirrors report roughly 1,200 GitHub stars; I could not confirm the current count from GitHub itself. The repository’s ROADMAP.md lists shipped features through v1.4.1 (IP index, PromQL, record write protocol). I did not rely on any unlisted future plans.
Recommendation
Assess for a first project, Trial if you want an InfluxDB-compatible store that scales out and you can live with Sandbox maturity. openGemini fits a pipeline that writes sensor or metric data through line protocol and queries it with InfluxQL or PromQL. Start with a single ts-server, load representative data through the HTTP API, then build a three-meta cluster, turn on authentication and TLS, and test failure and restore before trusting it. Read the documentation for your exact version.
References: openGemini documentation · openGemini repository · Cluster architecture · Install and deployment · Line protocol insert · Prometheus remote read/write · Use PromQL · Retention policy · Continuous queries · User management · Use HTTPS · CNCF project page