A cluster that survives its own test environment has not been tested. Pods are rescheduled in staging because nothing ever kills the node they run on; failover works in a diagram because nobody has cut the zone it depends on. Chaos engineering closes that gap by injecting a failure on purpose, in a controlled way, while measuring whether the system behaves as claimed.
Krkn (also written Kraken) is a chaos and resiliency testing tool for Kubernetes. Its distinguishing design choice is that the tool runs outside the cluster it is testing, so it can take things down and still collect logs and results afterwards.
CNCF daily · Sprint 4, post 14 of 15 · Chaos Engineering
At a glance
| Category | Observability and Analysis › Chaos Engineering |
| CNCF status | Sandbox (Landscape: accepted 19 December 2023) |
| Written in | Python for the core and scenarios; Go for the krknctl CLI; Bash for container scripts |
| License | Apache 2.0 |
| Latest versions I found | krkn v5.2.14, krkn-lib v7.0.3, krkn-hub v1.1.1, krknctl v0.14.2-beta (git tags; I did not confirm release dates) |
| Runs | As a Python program, as a krkn-hub container, or through the krknctl CLI; an operator with a web console also exists |
| Install | git clone plus pip install -r requirements.txt (tested up to Python 3.11), a container image, or the krknctl install script |
| Fault families | Pod, container, node, network, time, application outage, zone outage, CPU, memory and IO hogs, PVC, DNS, service hijacking, SYN flood, HTTP load, and KubeVirt scenarios |
| Cloud node faults | AWS, Azure, GCP, OpenStack, VMware, Alibaba, IBM Cloud, bare metal and Docker |
| Pass or fail signals | Recovery checks, health checks, Prometheus SLOs, Cerberus go or no-go, exit code, resiliency score |
| Project links | krkn-chaos.dev; #krkn on Kubernetes Slack; monthly office hours |
The problem
Distributed systems fail in ways that diagrams hide. Krkn’s own overview lists the assumptions that cause outages: the network is reliable, latency is zero, bandwidth is infinite, topology never changes, resource usage has no spikes, and shared resources are reachable from everywhere. Each one is false, and each one has caused real incidents.
Chaos engineering tests those assumptions on purpose. A useful chaos tool has to do more than kill things. It has to:
- state what “healthy” means before the fault, so the result is a comparison and not an opinion;
- limit what the fault can touch, so a test does not become an outage;
- observe the system during and after the fault, with checks the team trusts;
- undo what it changed, even when the run itself fails;
- produce a result that a pipeline can act on.
Krkn’s authors give several reasons for building it: to run outside the cluster, so taking a cluster down does not take the tool with it; to cover both cloud-level and Kubernetes-level scenarios; and to check performance and alerts during and after chaos, not only whether pods came back.
Key concepts
- Scenario. One kind of fault with its parameters, described in a YAML file, for example “kill one pod matching this label”. Scenarios are grouped by type in the config.
- Krkn core. The Python program that reads a config and its scenario files, applies faults, runs checks and writes results. The docs call it the brain of the project.
- krkn-lib. The library of Kubernetes helper functions and data models that the scenarios are built on.
- krkn-hub. Container images, one per scenario, that take scenario parameters as environment variables. They suit CI because there are no config files to carry around.
- krknctl. A CLI that runs krkn-hub images through Podman or Docker, with scenario discovery, input validation and shell completion. It can also run several scenarios in a dependency graph.
- Cerberus. A separate watcher that monitors a cluster’s nodes and components and publishes a go or no-go signal that Krkn can read after each scenario.
- Health checks. Plugins that probe HTTP endpoints, Prometheus expressions, Kubernetes object conditions, or KubeVirt VMs before, during or after chaos, and record the results in telemetry.
- Resiliency score. A percentage computed from weighted SLO checks over the chaos window.
- Rollback. A file-based mechanism that records changes before a scenario makes them, so they can be reverted even if Krkn crashes.
- Signal. An HTTP endpoint that lets a CI job or an operator pause, resume or stop a run.
Architecture
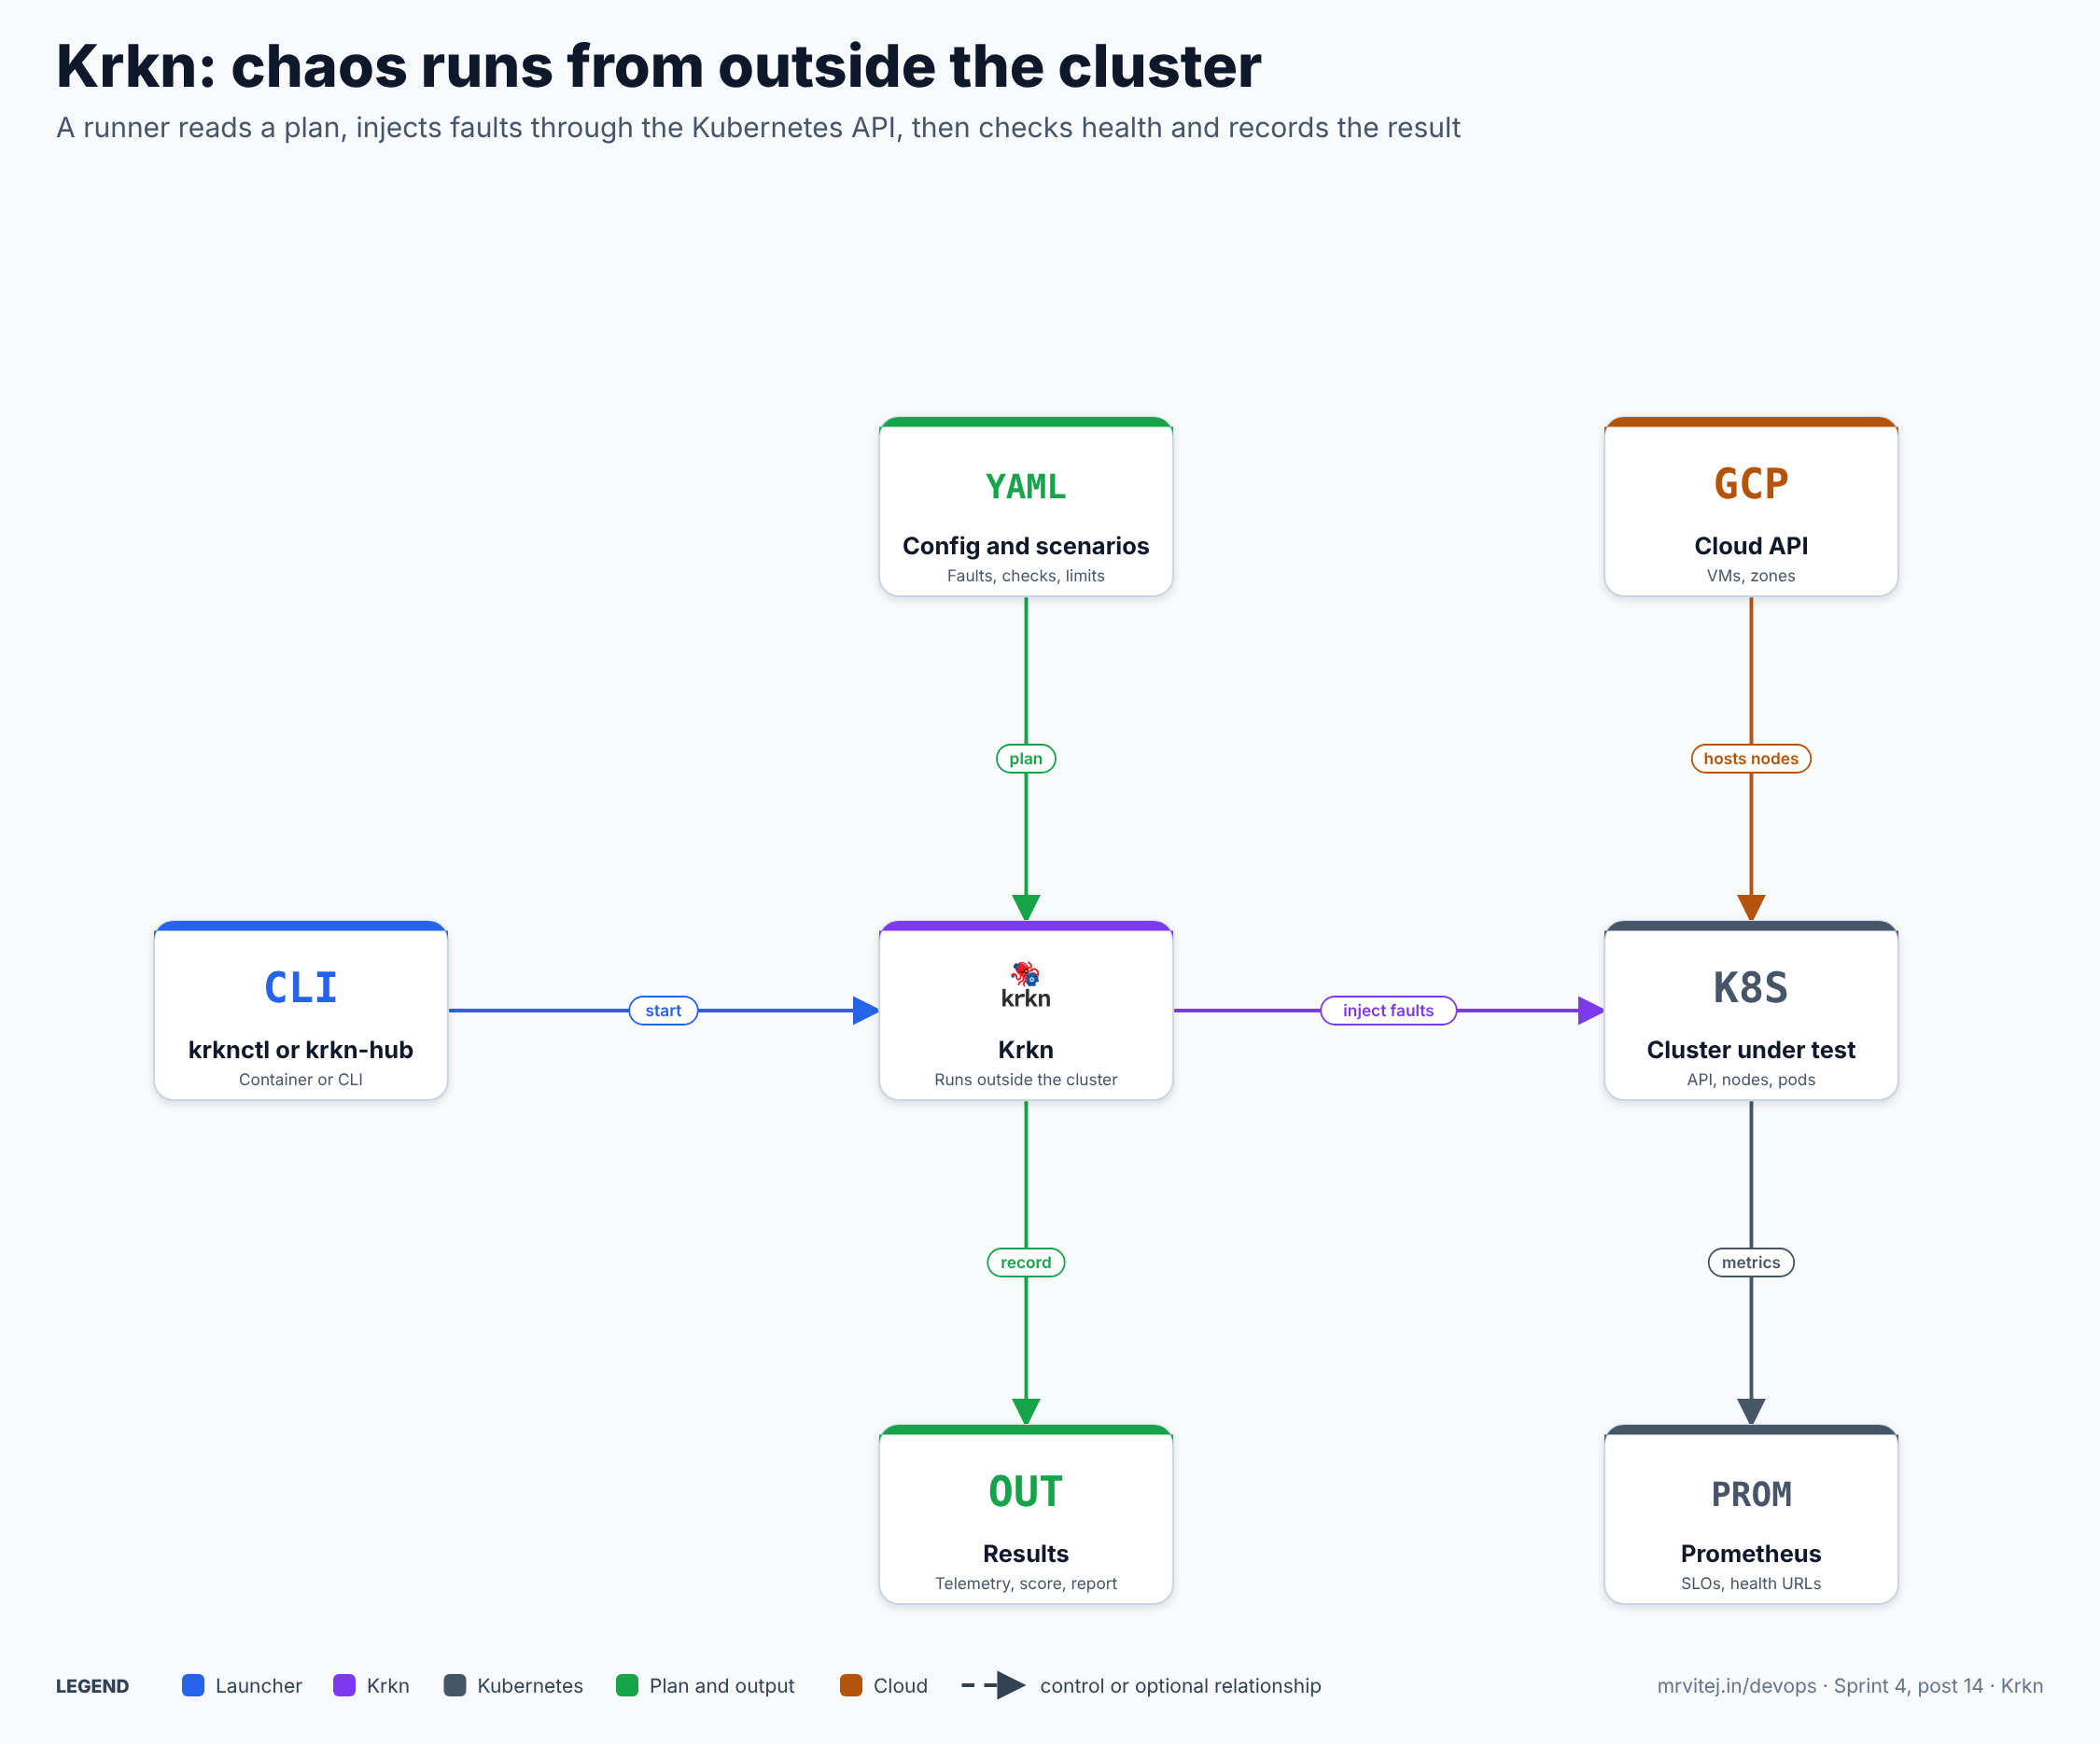
Krkn is a client program. It authenticates to the cluster with a kubeconfig, and the overview describes it as a lightweight application that runs outside the cluster. Some scenarios also create helper workloads in the cluster, for example the network and hog sample files reference a workload image, and those are meant to exist only for the test.
Three consequences follow from this design:
- The tool survives the fault. If a scenario takes down a control plane component or an entire node pool, Krkn is still running somewhere else and can report what happened.
- Access is the kubeconfig and cloud credentials you give it. For node and zone scenarios, Krkn calls the cloud provider directly to stop, start or reboot instances, so it needs credentials for that provider as well as cluster access.
- Telemetry stays outside. Run results can be written to the run output, to Elasticsearch or to an S3 bucket, so they are not stored in the cluster being tested.
The project is split into repositories that build on each other: krkn-lib at the bottom, krkn on top of it, krkn-hub wrapping scenarios as containers, and krknctl driving those containers. Pick the layer that fits: the core for writing and iterating on scenarios, krkn-hub for CI, krknctl for a hand-run or scripted command line.
One chaos run
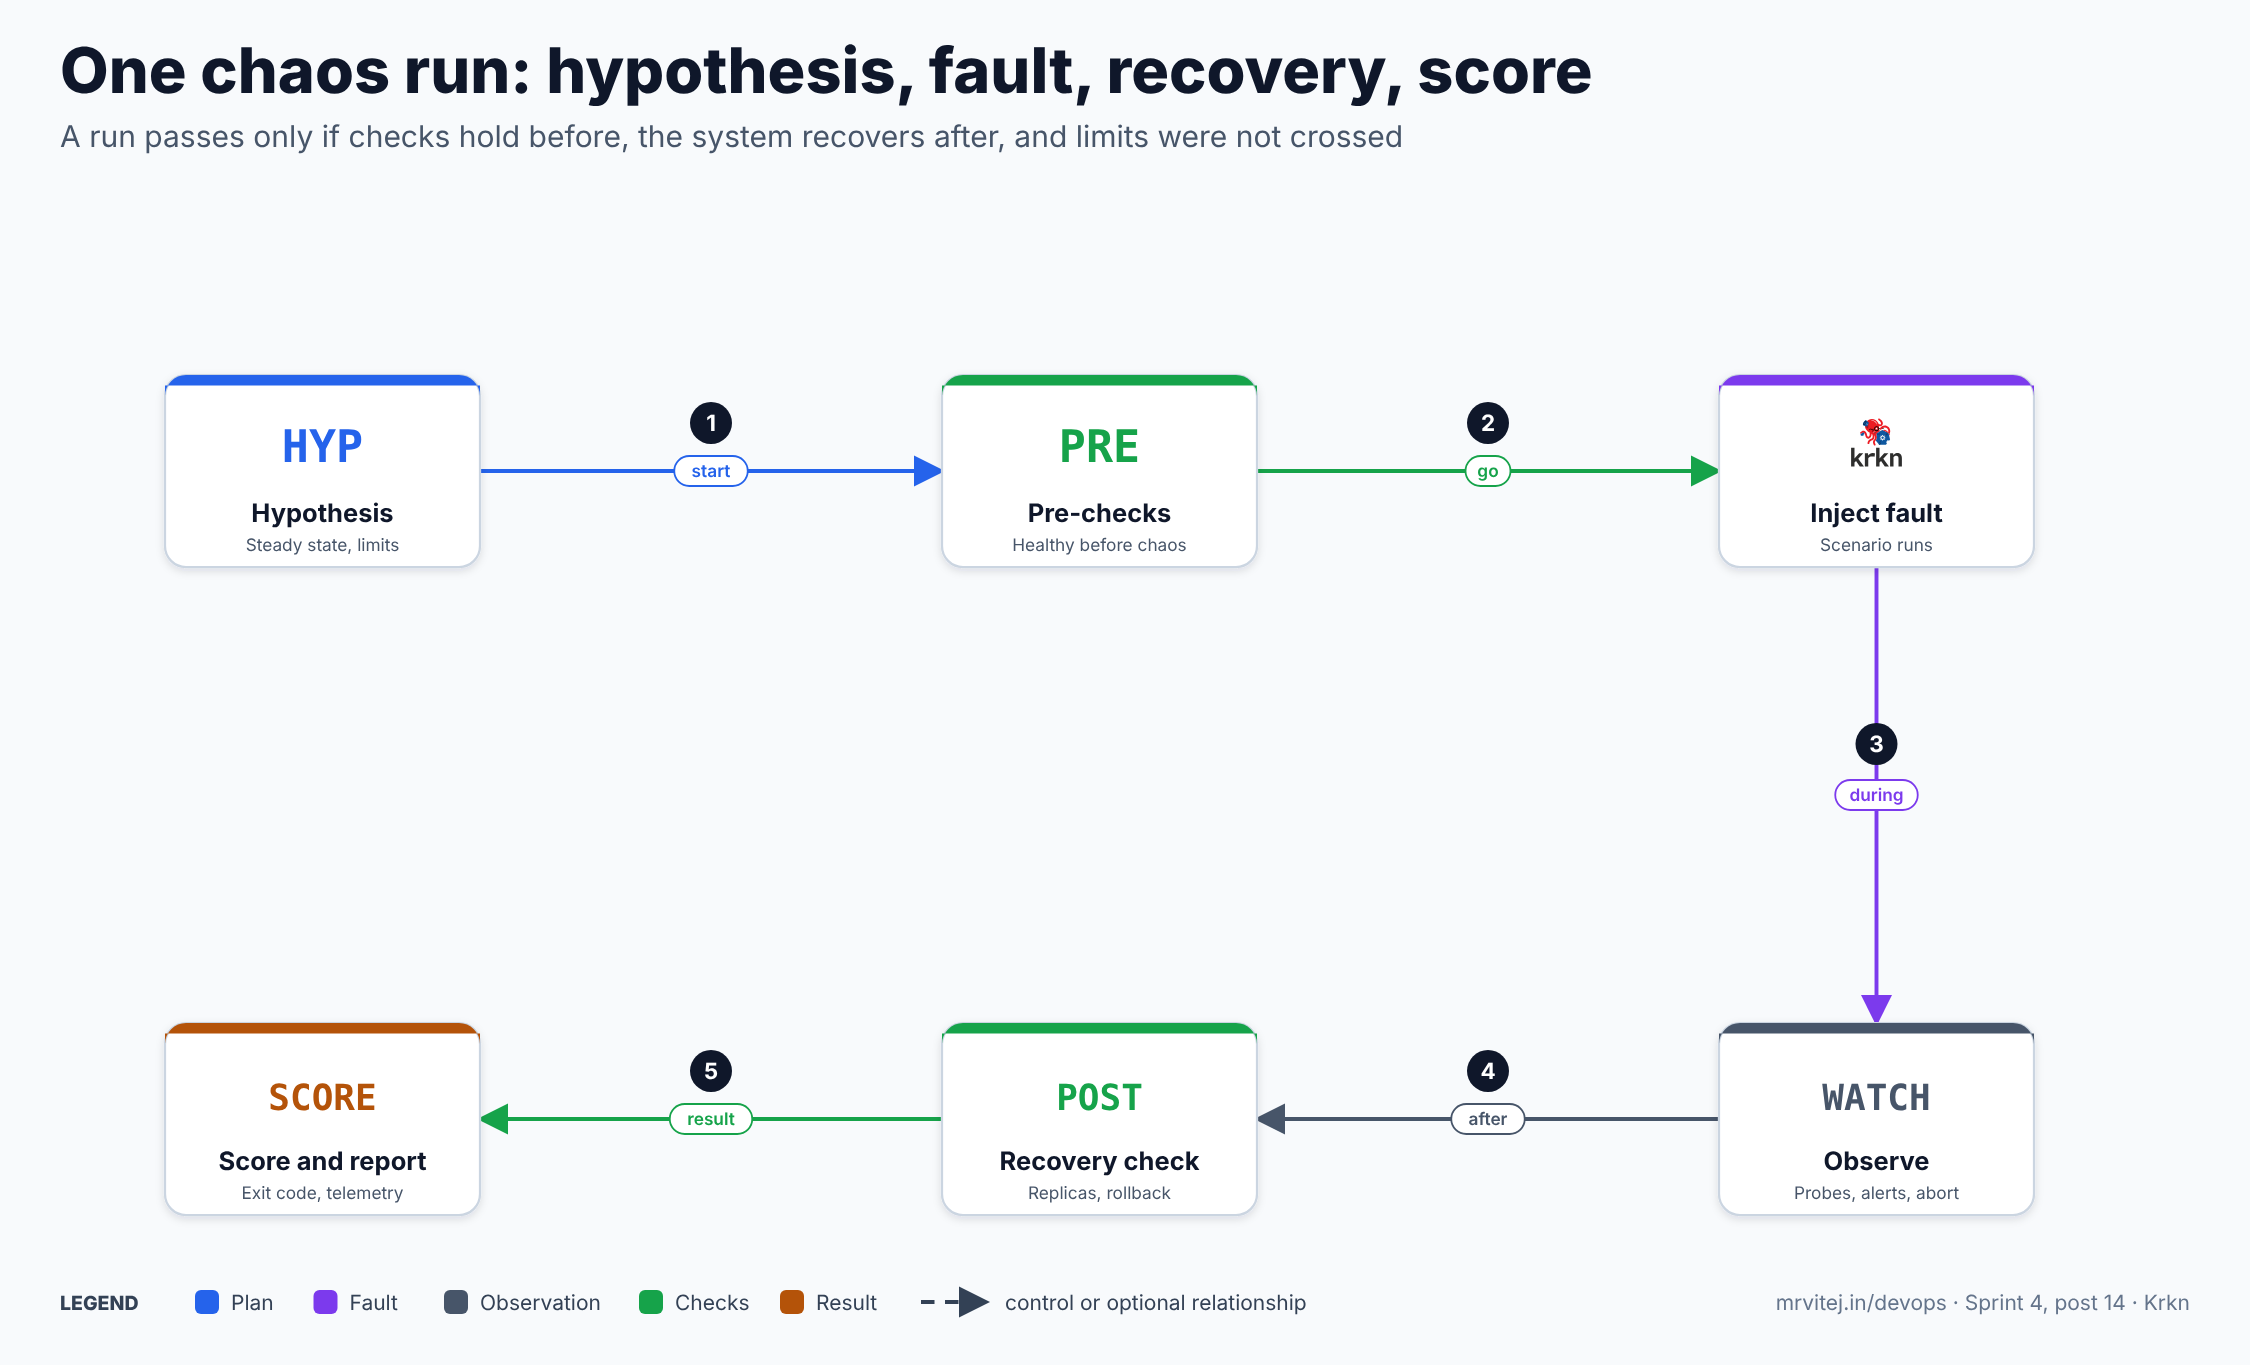
- Hypothesis. Before running anything, write down what should happen: “if one replica of the checkout service is deleted, requests keep succeeding and a replacement is Ready within 60 seconds”.
- Pre-checks. Health checks and SLO queries confirm that the system is healthy before chaos starts. With
exit_on_failureset, a failing pre-check blocks the run, which stops you from learning nothing by breaking something already broken. - Fault. The scenario runs: a pod is deleted, a node is stopped, a network rule is applied.
- Observation. Health checks probe at an interval, alert expressions are evaluated, and the signal endpoint lets a person or a pipeline stop the run.
- Recovery and rollback. Krkn checks that replicas or nodes are back, runs post-checks, and reverts any changes it tracked.
- Result. The run exits with a code, writes telemetry, and can generate a PDF or HTML report and a resiliency score.
Install and first run
Run the core
git clone https://github.com/krkn-chaos/krkn.git --branch <release version>
cd krkn
python3.11 -m venv chaos && source chaos/bin/activate
pip install -r requirements.txt
python run_kraken.py --config config/config.yaml
The docs say they have tested up to Python 3.11, and recommend a virtual environment so Krkn’s dependencies do not interfere with others. Use a release tag, not main, for anything repeatable.
Run a scenario with krknctl
curl -fsSL https://raw.githubusercontent.com/krkn-chaos/krknctl/refs/heads/main/install.sh | bash
krknctl --version
krknctl list available
krknctl describe pod-scenarios
krknctl run pod-scenarios --help
describe explains what a scenario does and lists its flags. run starts the matching krkn-hub container through Podman or Docker. The kubeconfig is flattened with its certificates inlined and copied to the working directory, because the container cannot see certificate files on the host, so keep that directory private. --dry-run validates a scenario’s configuration without cluster access or execution, which makes it a good first step in a pipeline.
Run a scenario with krkn-hub
podman run \
  --name=pod-chaos \
  --net=host \
  --pull=always \
  --env-host=true \
  -v ~/.kube/config:/home/krkn/.kube/config:Z \
  -d containers.krkn-chaos.dev/krkn-chaos/krkn-hub:pod-scenarios

podman logs -f pod-chaos
podman inspect pod-chaos --format "{{.State.ExitCode}}"
The exit code is the pass or fail result, so a CI job can use it directly. Variables for the pod scenario include NAMESPACE, POD_LABEL, EXCLUDE_LABEL, NAME_PATTERN, DISRUPTION_COUNT, EXECUTION, KILL_TIMEOUT, EXPECTED_RECOVERY_TIME and DURATION. With Docker, each variable is passed with -e, and a helper script can build the argument string. The container runs as a non-root user, so the kubeconfig you mount must be readable by it.
Scenarios, by fault family
The scenario catalogue is the heart of Krkn. In the core, scenarios are listed in config.yaml under chaos_scenarios, grouped by type, and run one after another. Each type points at one or more scenario files. The type names include pod_disruption_scenarios, container_scenarios, node_scenarios, application_outages_scenarios, time_scenarios, network_chaos_scenarios, network_chaos_ng_scenarios, hog_scenarios, zone_outages_scenarios, pvc_scenarios, service_disruption_scenarios, service_hijacking_scenarios, syn_flood_scenarios and http_load_scenarios. The same type can appear more than once, and types can be mixed in one run.
The examples below are adapted from the project’s own sample files. The namespaces and labels are placeholders to replace with your own.
Pod faults
Delete pods that match a pattern or label, and verify that they come back:
# yaml-language-server: $schema=../plugin.schema.json
- id: kill-pods
  config:
    namespace_pattern: ^shop$
    label_selector: app=checkout
    exclude_label: 'chaos=exempt'   # pods with this label are never touched
    kill: 1                         # how many pods to disrupt
    execution: serial               # serial or parallel
    timeout: 120                    # wait this long for deletion
    duration: 10                    # wait before checking recovery
    krkn_pod_recovery_time: 120     # fail if pods are not back in this time
    force: false                    # true skips the termination grace period
The mechanism matters: pods are selected by namespace pattern plus label selector (or by name pattern), then anything matching exclude_label is removed from the list before deletion. That is how you attack the stateless tier while keeping a database replica safe. node_label_selector and node_names restrict the targets to pods on particular nodes.
What this tests: whether the Deployment replaces the pod, whether readiness probes and disruption budgets are right, and how long recovery takes. The telemetry reports recovery times.
Node faults
Node scenarios stop, start, reboot, terminate or crash nodes, stop or restart the kubelet, and more. Some need cloud access, and some (such as restarting the kubelet or crashing a node) work with a generic cloud type. A Google Cloud example from the project’s sample file:
node_scenarios:
  - actions:
    - node_reboot_scenario
    label_selector: node-role.kubernetes.io/worker
    instance_count: 1
    timeout: 120
    cloud_type: gcp
    parallel: true
    kube_check: true          # watch the Kubernetes API for the node's state
  - actions:
    - node_stop_start_scenario
    label_selector: node-role.kubernetes.io/worker
    instance_count: 1
    timeout: 360
    duration: 120             # how long the node stays stopped
    cloud_type: gcp
instance_count limits how many matching nodes are hit, and exclude_label can protect some of them. The docs note that if a node does not recover from node_crash_scenario, rebooting it brings it back to Ready, which is one reason to run that scenario only on disposable nodes.
Network faults
Two generations of network scenarios exist. The newer “network chaos NG” family includes a pod network filter, a node network filter, node interface down, pod and node network chaos, and KubeVirt VM variants. Two pod-level examples from the sample files:
- id: pod_network_filter          # block specific ports with iptables
  image: "quay.io/krkn-chaos/krkn-hub-multiarch:workload-krkn-network-chaos"
  test_duration: 60
  namespace: 'shop'
  label_selector: "app=checkout"
  instance_count: 1
  execution: parallel
  ingress: false
  egress: true
  protocols: [tcp, udp]
  ports: [53]                     # block DNS lookups from the pod

- id: pod_network_chaos           # shape traffic with tc
  image: "quay.io/krkn-chaos/krkn-hub-multiarch:workload-krkn-network-chaos"
  test_duration: 60
  namespace: 'shop'
  label_selector: "app=checkout"
  instance_count: 1
  ingress: true
  egress: true
  latency: 100ms                  # units: us, ms, s
  loss: 10                        # percent
  bandwidth: 1gbit
The filter blocks traffic on chosen ports and protocols using iptables rules; the chaos scenario adds latency, packet loss or a bandwidth limit using Linux traffic control. Blocking port 53 for one pod is a cheap way to find out how an application behaves when DNS is slow or gone.
Time faults
A time scenario skews the clock for pods or nodes. The sample file uses skew_time for a container and skew_date for nodes:
time_scenarios:
  - action: skew_time
    object_type: pod
    namespace: shop
    label_selector: app=checkout
    container_name: checkout
  - action: skew_date
    object_type: node
    label_selector: node-role.kubernetes.io/worker
Clock problems cause real failures: expired certificate checks, token validation errors, cache expiry, and scheduling logic. This scenario shows which of your services depend on a trustworthy clock without having to break NTP in production.
Application outage
This scenario blocks ingress, egress or both for the pods matching a selector, for a set duration:
application_outage:
  duration: 300
  namespace: shop
  pod_selector: {app: payments}
  exclude_label: ""
  block: [Ingress, Egress]
Krkn implements it by creating a network policy named kraken-deny in the target namespace. If a run fails before it reverts the policy, the docs say to delete it manually (kubectl delete networkpolicy/kraken-deny -n <namespace>). Application outage supports rollback, and putting the application’s URL in the health checks measures the downtime it caused. It is the right scenario for the question “what happens to everything that depends on this service when it disappears?”.
Resource, storage and zone faults
- Hog scenarios consume CPU, memory or IO on nodes, so you can see how the cluster behaves under noisy-neighbour pressure. A sample CPU hog sets the load percentage, duration, node selector and number of nodes.
- PVC and storage scenarios fill or throttle storage.
- Zone outages take a zone out. On AWS, Krkn changes the network ACL of the zone. On GCP, it finds the nodes in the chosen zone and stops them for the set duration, then starts them again. The docs explain that the GCP version works through the nodes because editing them requires them to be stopped first. This is the scenario that tests whether your cluster and your workloads really are spread across zones.
- Service disruption deletes the objects in a namespace, service hijacking replaces a service’s responses with controlled ones, SYN flood and HTTP load generate traffic, and KubeVirt scenarios target virtual machines.
Hypothesis, blast radius and abort criteria
Krkn gives you the mechanisms, and the discipline is yours. A workable template for every experiment, written before the run:
| Item | Example |
|---|---|
| Hypothesis | Deleting one checkout pod keeps the success rate above 99 percent and a replacement is Ready within 60 seconds |
| Steady state | A health check on the checkout URL returns 200; alert expressions for errors and latency are quiet |
| Blast radius | One pod, one namespace, a non-production cluster; exclude_label protects stateful pods |
| Abort criteria | Stop if the health check fails for longer than a set time, if a critical alert fires, or if a person sends STOP |
| Rollback | Rollback enabled; the manual command for kraken-deny known in advance |
| Result | Recovery time, the health-check record and the resiliency score are filed with the run |
Krkn’s controls map to the rows:
- Blast radius is controlled by the scenario parameters:
kill,instance_count, selectors,exclude_label,namespace_patternandduration. Start with1. - Steady state is verified by the pre-phase of the health checks. With
exit_on_failure: True, a failing pre-check stops the run before chaos starts. - Abort can be automatic or manual.
exit_on_failureends the run when a post-action check, a Cerberus signal or a critical alert fails. For manual or pipeline control, the signal server acceptsPAUSE,RUNandSTOP. - Duration is bounded in every scenario, and application and zone outages revert after the duration you give them.
A note on honesty in the controls: the during phase of Prometheus alert checks is not polled on an interval. The docs say that after chaos completes and wait_duration elapses, each expression is queried once over the whole chaos window. If you need continuous probing while the fault is active, use the HTTP health check, which does poll at an interval.
Health checks and reporting
Health checks are configured in config.yaml. The shipped file shows the shapes:
health_checks:
  interval: 2                    # seconds between probes during chaos
  run_during: ["pre", "during", "post"]
  exit_on_failure: True          # failing pre-checks block chaos; failing post-checks fail the run
  only_failures: False
  config:
    - url: https://shop.example.com/healthz
      bearer_token:              # optional

object_state_checks:
  interval: 2
  run_during: ["pre", "post"]
  exit_on_failure: True
  config:
    - name: checkout-ready
      kind: Deployment
      object_name: checkout
      namespace: shop
      condition:
        type: Available
        status: "True"
The HTTP check records a 200 as healthy and anything else as a failure, which gives downtime duration in telemetry. The object-state check watches a Kubernetes condition such as Pod Ready or Deployment Available. A KubeVirt check tests SSH access to virtual machines, and custom health-check plugins can be written.
Prometheus checks use an alert profile. Each entry has an expression, a description and a severity:
- expr: sum(rate(apiserver_request_total{code=~"5.."}[5m])) > 0
  description: Kubernetes API server returned errors
severity: criticalperformance_monitoring:
prometheus_url: "http://prometheus.example.com"
enable_alerts: True
alert_profile: config/alerts.yaml
run_during: ["pre", "during", "post"]
exit_on_failure: True
check_critical_alerts: TrueOn a plain Kubernetes cluster you must set the Prometheus URL and bearer token yourself, since they are only discovered automatically on OpenShift. critical and error severities fail the run when exit_on_failure is on, while warning and info are recorded without failing it.
Resiliency score
The resiliency score, which the docs mark as a beta feature, turns the SLO results into a percentage. Each SLO has a severity: warning is worth one point by default and critical three, or a custom weight can be set. The score is the share of points not lost to failing SLOs. A run with 5 critical and 15 warning SLOs has 30 points; if one critical and four warning SLOs fail, 7 points are lost, giving about 77 percent. A pass or fail verdict hides the difference between “perfect” and “barely”, and the score shows it. With krknctl graph, scenarios can have weights, so a critical service counts for more in the combined score.
Telemetry and visualisation
At the end of each run, Krkn prints a telemetry summary: cluster configuration, the scenarios run, recovery times, and health-check results. It can be stored in an S3 bucket or Elasticsearch for long-term analysis, and Elasticsearch indexes for metrics, alerts and telemetry are configurable. A separate dashboard and visualisation tooling exist for those results. Reports can be generated as PDF or HTML with report_formats.
Running at scale
- A graph of scenarios.
krknctl graph scaffoldgenerates a JSON plan for several scenarios, withdepends_onto make them serial, parallel or layered. Adummy-scenarioacts as a root node for full parallelism.krknctl graph runexecutes the plan and writes a log file per scenario. Graphs cannot contain cycles. - Randomised testing. The
randomsubcommands scaffold and run large numbers of scenarios from a seed file. - Triggers. A
triggersblock in a scenario can delay chaos until conditions are met: a command that exits zero, an HTTP endpoint returning an expected status, or a Kubernetes object condition. Settings includemode(all_oforany_of),timeout,intervalandon_timeout(skip,failorrun_anyway). - Krkn-AI. A companion project that uses an evolutionary algorithm over Krkn scenarios, guided by SLOs and health checks, to find the experiments that hurt most. It begins with a
discovercommand that generates a config. - Krkn Operator. A Kubernetes-native platform with a web console to manage users, clusters and permissions, and to run scenarios across one or more clusters at once, with optional discovery through Open Cluster Management.
Security
Chaos tools carry unusual power, so the security model deserves attention.
- A chaos run is a privileged operation. Krkn deletes pods, stops nodes and changes network rules. Whoever holds its kubeconfig and cloud credentials can do the same. Give it its own service account and keep it away from production unless that is a deliberate decision.
- Use least-privilege RBAC. The docs provide two shapes: a namespace-scoped role limited to pods, services, deployments, statefulsets and jobs in one namespace, and a privileged cluster role that adds nodes and cluster-wide access. Use the namespace role where the scenario allows it.
- Cloud permissions. Node and zone scenarios need cloud rights to stop and start instances. Scope those to the node pool under test.
- Image signature verification. The shipped config contains
image_signature_verification_enabledand animage_signature_public_key(cosign.pub) for verifying the workload images that scenarios deploy, which is worth leaving on. - Kubeconfig handling.
krknctlcopies a flattened kubeconfig into the working directory. Treat it as a secret and clean it up. - Supply chain. The project’s self-assessment lists software bills of materials for its repositories, dependency monitoring with Snyk and Dependabot, and CI scanning of the base image. It also names its own known weaknesses, such as missing static analysis for the Python core and about 50 percent test coverage for
krknctl, which is the kind of candour worth appreciating. - Not a security tool. The self-assessment says Krkn is not a security provider, and that rollback cannot guarantee recovery from highly disruptive scenarios, so the target system’s integrity is outside its goals.
Monitoring and day-2 operations
- Pin versions. Run a release tag of the core, and a fixed tag of krkn-hub images, so results are comparable between runs.
krknctlis still on beta tags, so watch its release notes. - Run from a stable place. A CI runner or a small VM outside the cluster, with network access to the API server, the cloud API and Prometheus.
- Give each run an identity. Each chaos run should have its own UUID, which is generated by default. Add a run tag when sending telemetry, so runs group sensibly.
- Store results. Send telemetry to Elasticsearch or an S3 bucket and keep the PDF or HTML report with the change ticket.
- Rollback list. The core has
list-rollbackandexecute-rollbackcommands. Scenarios with rollback support are application outages, hog scenarios, PVC scenarios, service hijacking, SYN flood and GCP zone outage. Scenarios not on that list need a manual clean-up plan. - Know the manual cleanups. The
kraken-denynetwork policy for application outages is the main example. - Schedule runs. Run low-risk scenarios (pod kills with
kill: 1) on a schedule in a test cluster to catch regressions, and keep node and zone scenarios for planned game days.
Limits worth knowing
- Sandbox maturity. The tool is fast-moving,
krknctlcarries beta version tags, and the resiliency score is labelled beta in the docs. - Python core, many moving parts. Core, library, hub images, CLI and operator are separate components with their own versions.
- Scenarios run in sequence. In the core, scenarios run one after another and the run exits if one fails without continuing to the next, unless you use the
krknctlgraph for parallelism. - No hypothesis language. Steady state and abort criteria are encoded through health checks, alerts and exit codes. There is no built-in experiment object that states a hypothesis.
- Cloud coverage varies. Not every action works on every provider; check the table for yours.
- Part of the scenario catalogue is OpenShift-centric. Many sample files target OpenShift components, so on other distributions you write your own.
- Rollback is partial. Only some scenarios support it, and some faults can leave a cluster in a state that needs manual repair.
- Outside-in access is a trade-off. Running outside the cluster is a strength for survivability, and it means credentials for the cluster and cloud live wherever Krkn runs.
Usage cases
- Platform regression testing. Run a standard set of pod, node and network scenarios against every new cluster version before promoting it.
- Service teams proving their claims. Replicas, probes, disruption budgets and retries are tested by deleting pods and blocking dependencies.
- Game days. Node, zone and application outage scenarios, with a signal endpoint to stop the exercise at any moment.
- CI gates. A krkn-hub container in a pipeline, with the exit code as the verdict.
- Cluster upgrade rehearsals. Time skew and node stop-and-start scenarios expose assumptions before a real upgrade does.
- Industrial edge platforms. In the pharmaceutical-plant machine monitoring design on Google Cloud, Krkn could stop worker nodes and pods in a test cluster to check that data collection and alerting recover on their own; the plant’s validated production systems would not be a place to run it.
Adoption
The project’s adopters file lists MarketAxess (since 2024), Red Hat OpenShift (since 2020, as part of the engineering team’s resiliency testing), IBM (since 2023, through AI-for-chaos research with the Krkn team), and DXC Technology (2026, a pilot). The entries are self-reported in the file’s own words. The README names its core maintainers, while the adopters list is short, so evaluate the tool with your own workloads.
Alternatives and neighbours
| Tool | Model | Best suited to |
|---|---|---|
| Krkn (Sandbox) | Runs outside the cluster; scenarios in YAML; health, SLO and score checks; cloud node and zone faults | Teams that want a CI-friendly runner with cluster-level and cloud-level faults |
| Chaos Mesh (Incubating) | Kubernetes-native; faults are custom resources managed by controllers and a dashboard | Teams that want declarative, in-cluster faults and a rich fault set; see the Chaos Mesh brief |
| Litmus (Incubating) | Experiments defined as resources, with a hub of ready experiments and a portal | Teams that want shareable experiment libraries and a workflow for them; see the Litmus brief |
| ChaosBlade (Sandbox) | CLI, operator and console; hosts, containers, Kubernetes and JVM | Teams that also need host and Java application faults; see the ChaosBlade brief |
| Gremlin and cloud fault services | Commercial or provider-native | Teams that want a managed service or provider-level faults |
| Chaos Toolkit | Scripted experiments | Custom experiments across platforms |
The practical difference between Krkn and the in-cluster tools is where the controller lives. Chaos Mesh and Litmus install components into the cluster and run experiments as Kubernetes resources, which fits GitOps and lets the cluster hold its own experiment history, and means the chaos controller is itself subject to the faults you inject. Krkn keeps the controller outside, which means it keeps working while the cluster is broken, and it brings its own checks. Krkn’s strengths over the others are its cloud-level node and zone faults, built-in SLO and health checks, and the scoring; its weakness is that it has no cluster-resident experiment objects to keep in Git next to the application.
Strengths and limitations
| Strengths | Limitations |
|---|---|
| Runs outside the cluster, so the tool survives the fault | Credentials for the cluster and cloud live where it runs |
| Wide catalogue: pod, node, network, time, zone, hogs and more | Rollback covers only some scenarios |
| Health checks, Prometheus SLOs, Cerberus and a resiliency score | Resiliency score is a beta feature |
| Three ways to run: core, containers, CLI; plus an operator | Several components with their own versions; krknctl is on beta tags |
| Signal endpoint, triggers and graphs for control | Core runs scenarios in sequence |
| Apache 2.0, open governance, self-assessment published | Short public adopters list; sandbox maturity |
Project status
Krkn is a CNCF Sandbox project, accepted on 19 December 2023 according to the Landscape entry, with the OpenSSF Best Practices badge and CLOMonitor listed in its README. The repositories are active (the core’s last commit that I saw was on 3 November 2026), the roadmap lists features such as security chaos scenarios, AWS-native scenarios and a unified experience under krknctl, and the project holds monthly office hours. The core is at version 5.x, with krknctl still on beta tags.
Recommendation
Trial. Krkn is a strong fit for a team that wants to start chaos testing without installing controllers into its clusters, and it deserves a place in a pre-production pipeline. Start in a disposable test cluster: install krknctl, run pod-scenarios with --dry-run and then for real against one non-critical namespace with kill: 1, and add one HTTP health check and one object-state check so a run has a verdict. Give it a dedicated service account with namespace-scoped RBAC, and keep rollback on. Then add a Prometheus alert profile with a few SLOs you already trust, capture telemetry in a bucket, and write the hypothesis, blast radius and abort criteria for each scenario before running it. Move to node and zone scenarios only after pod and network scenarios are routine, and only on node pools you can afford to lose. Treat the resiliency score as a trend line, not a certificate, and do not adopt krknctl beta tags into production pipelines without pinning and testing.
References: Krkn repository · Krkn documentation · krkn-hub · krknctl · krkn-lib · Krkn website and docs source · Adopters · CNCF project page · Chaos Mesh brief · Litmus brief · ChaosBlade brief