
Perses is a dashboard tool for observability data: you open it in a browser, choose a data source such as Prometheus, and build panels with queries, variables and layouts. What makes it different from other dashboard tools is the way it treats the dashboard itself. A Perses dashboard is a documented, versioned specification that can be validated statically, written in code with an SDK, applied with a CLI, or declared as a Kubernetes resource, so dashboards go through the same review, test and deploy path as application code. Perses began inside Amadeus, the travel technology company, to solve the problem of managing very large numbers of dashboards in a UI-first tool. It was presented at PromCon EU in 2023, joined the CNCF Sandbox on August 29, 2024, and is licensed under Apache 2.0. This brief explains Perses from the problem it solves to installing, configuring, securing and operating it, with a full dashboard-as-code workflow and a comparison with Grafana, which the Prometheus brief covers, so one read is enough to decide whether it belongs in your platform.
CNCF daily · Sprint 4, post 6 of 15 · Observability
At a glance
| Category | Observability and Analysis › Observability |
| CNCF status | Sandbox. Accepted August 29, 2024 |
| Originated at | Amadeus, with contributors from Red Hat and Chronosphere early on; later releases credit a growing community |
| Written in | Go for the server and CLI, React with TypeScript for the web UI, CUE for the schemas |
| License | Apache 2.0 |
| Data sources | Prometheus (metrics), Tempo (traces), Loki (logs) and Pyroscope (profiles); version 0.54.0 added Jaeger, GreptimeDB, Splunk, LogExplorer, Alertmanager and OpenSearch plugins |
| Latest release | 0.54.0 (29 July 2026) was the latest I could confirm; the main-branch documentation already refers to percli 0.55.0 |
| Interfaces | Web UI, REST API, percli CLI, Go and CUE SDKs, GitHub Actions, Kubernetes operator |
| Storage | Files on disk or a SQL database |
| Install options | Docker image, binaries and Homebrew, Helm chart, Perses Operator |
| Also embeddable | npm packages that embed panels or whole dashboards in other applications |
The problem Perses solves
A dashboard tool is easy to start and hard to run at scale. A team builds dashboards by hand in a UI, exports them as large JSON files, and commits the files. Then problems pile up: the files are huge and unreadable in a code review, there is no static check that a dashboard is valid before it reaches production, copy and paste replaces reuse, the same panel is rebuilt in forty dashboards, and the dashboard in production slowly drifts from the one in Git. At hundreds of dashboards this becomes a platform problem.
Perses starts from the other end. It defines the dashboard as a clean data model first, with a schema for every panel, query, variable and data source, and builds the UI on top of that model. Because the model is explicit, a CLI can validate it without a server, an SDK can generate it from reusable code, and an operator can deliver it through Kubernetes. The open specification also lets other tools read and write the same format, which is why platforms such as Red Hat OpenShift and some commercial observability vendors embed or adopt Perses components.
Key concepts
- Project. The top-level container and the unit of access control. Dashboards, data sources and variables live in a project. In the Kubernetes operator, a namespace maps to a project.
- Dashboard. A resource with a
specmade of panels, layouts, variables, datasources, a default time range (duration) and arefreshInterval. - Panel. One visualization: a plugin such as
TimeSeriesChart,StatChart,GaugeChart,Table,Markdownor a trace or log panel, with its display options and one or more queries. - Layout. A grid, up to 24 columns wide, that positions panels by reference (
$ref) to the panel entries, so a panel is defined once and placed by pointer. - Variable. A dashboard input, either a text value or a list whose values come from a query (such as the values of a Prometheus label) or a static list. Panel queries use it as
$name. - Datasource. A connection to a back end. It can be defined for a dashboard, for a project (
Datasource) or for the whole server (GlobalDatasource). The server proxies queries to it, so credentials stay on the server. - Plugin. The extension mechanism. Panels, queries, variables and data sources are all plugins, each with a CUE schema that the server and the CLI use for validation. The core plugins live in the
perses/pluginsrepository. - Dashboard-as-Code (DaC). Writing dashboards in CUE or Go with the Perses SDKs, then building them to JSON or YAML with
percli. percli. The command-line client:apply,get,delete,describe,lint,login,migrate,project,dacand more.- Operator. A Kubernetes controller that deploys Perses and syncs
PersesDashboardandPersesDatasourceresources to it.
Architecture
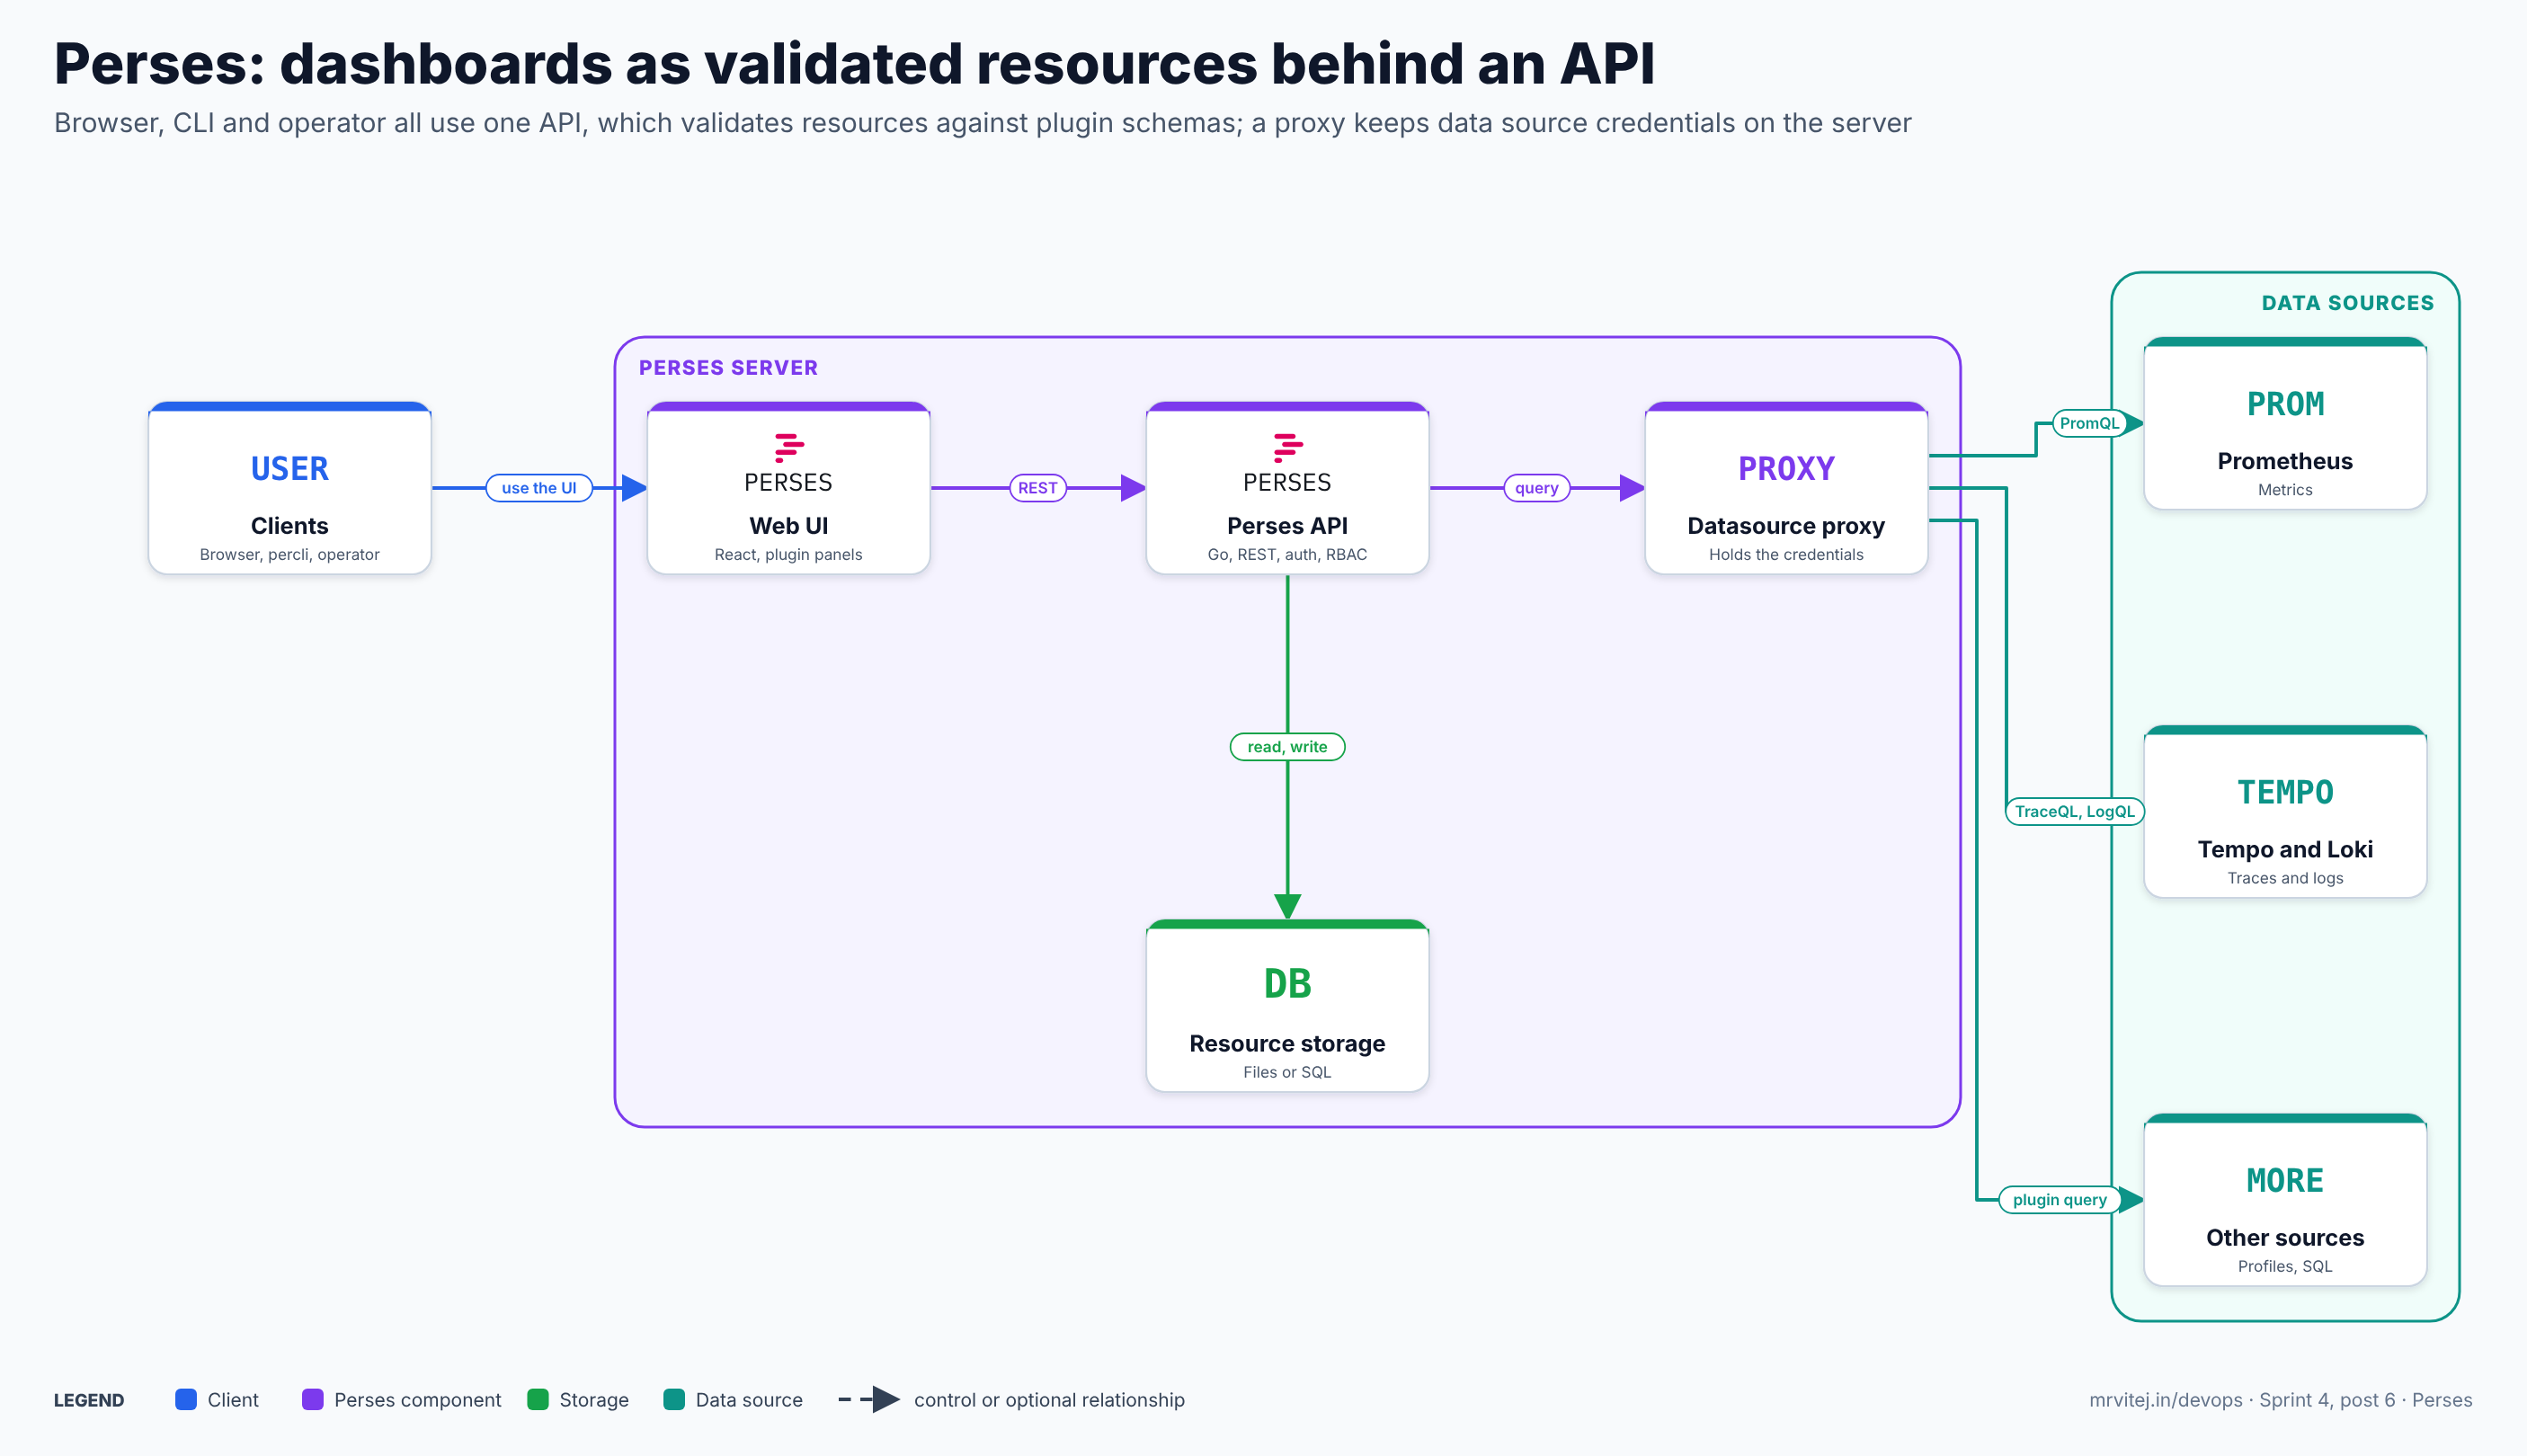
One server holds the UI, the API, the storage and the proxy. Blue is a client, purple a Perses component, green storage and teal a data source. Open the zoomable diagram, or download it as SVG or PNG.
| Component | What it does |
|---|---|
| Web UI | React application served by the server: browse projects and dashboards, edit panels visually, explore queries |
| Perses API | REST API for every resource (projects, dashboards, data sources, variables, secrets, roles, role bindings, users); applies authentication and authorization and validates resources against the plugin schemas |
| Storage | Either files in a folder (YAML or JSON) or a SQL database; file storage is the default and needs no external database |
| Datasource proxy | Forwards panel queries to the data source and adds credentials, so browsers never see them |
| Plugins and schemas | Panels, queries, variables and data sources, each with a CUE schema used for validation and for the migration script |
percli and SDKs |
Static validation, builds, applies and Grafana migration |
| Operator | Deploys Perses and reconciles dashboards and data sources from Kubernetes resources |
Why validation is static
Because every plugin has a CUE schema, percli lint can check a dashboard file without contacting any server, and percli lint --online can ask a running Perses to validate it against the plugins that server actually has. That is the basis of the CI step: a dashboard with a misspelt panel option or an unknown query kind fails the pipeline instead of rendering blank in production.
From a reviewed change to a rendered panel
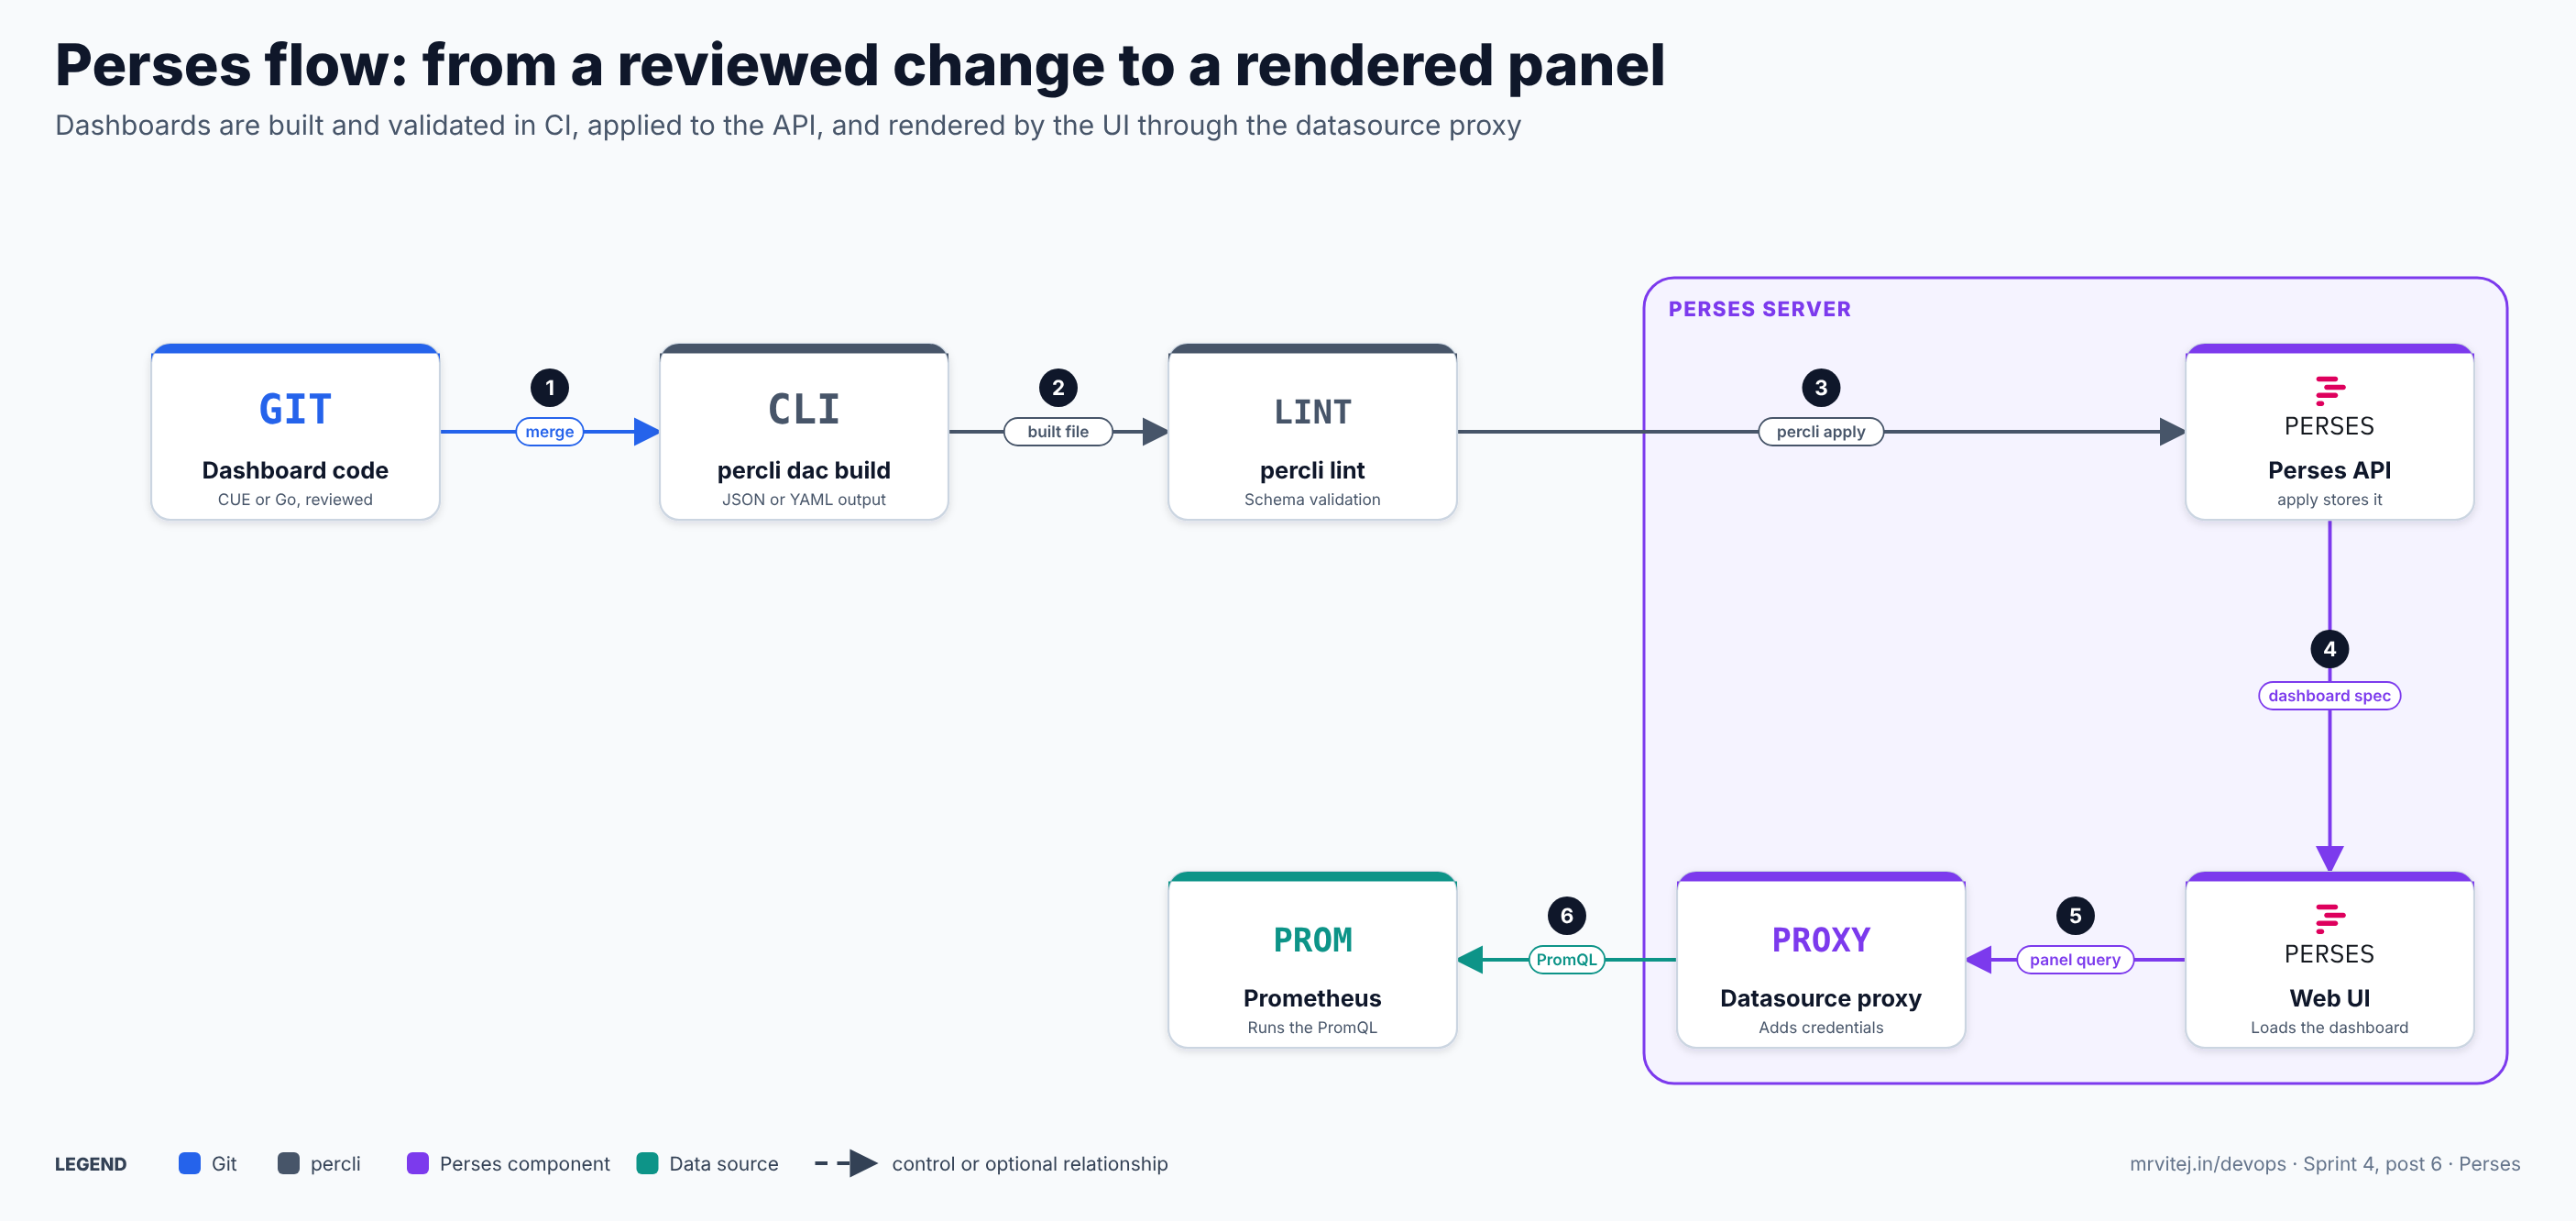
- Merge. A pull request changes the dashboard code, written in CUE or Go, and is reviewed like any other code.
- Build.
percli dac buildturns the code into JSON or YAML in abuiltfolder. - Lint and apply.
percli lintvalidates the built files, thenpercli apply -fstores them in the Perses API (or the operator syncs them from Kubernetes resources). - Load. A user opens the dashboard; the UI fetches the specification from the API.
- Query. For each panel the UI sends the query to the datasource proxy.
- Run. The proxy adds the data source’s credentials and runs the query, for example PromQL on Prometheus, and the result renders in the panel.
Recap: the Git repository is the source of truth, CI proves the dashboard is valid, and the server only stores and serves it.
Perses and Grafana
Perses is often compared with Grafana, which the Prometheus brief covers. They solve the same visualization problem from different starting points:
| Perses | Grafana | |
|---|---|---|
| Starting point | Code-first: a specification, SDKs and a CLI, with a UI on top | UI-first, with provisioning and APIs for automation |
| License | Apache 2.0 | AGPLv3 |
| Maturity | CNCF Sandbox, young, data model still evolving | Mature, with a large ecosystem |
| Data sources | Prometheus, Tempo, Loki, Pyroscope and a growing set of plugins | Very large catalogue of data source plugins |
| Validation | Static CUE validation in CI | Mostly at import or at render time |
| Alerting | Not an alerting engine; alert rules stay in Prometheus and Alertmanager | Built-in alerting |
| Migration | percli migrate converts Grafana JSON on a best-effort basis |
Not applicable |
Treat the migration honestly: it converts what it can map, and panels or variables that Perses has no plugin for are replaced with placeholders that you rebuild by hand. Choose Perses when you want dashboards under strict version control, a permissive licence, a Kubernetes-native workflow, or a specification you can embed in other tools. Stay with Grafana when you rely on its plugin catalogue, its alerting, or a team that builds dashboards visually and does not want a code workflow.
Install and first run
Docker and binaries
docker run --name perses -d -p 127.0.0.1:8080:8080 persesdev/persesOpen http://localhost:8080. Pin an exact image tag in anything real. Homebrew provides both pieces: brew install perses/tap/perses for the server and web UI and brew install perses/tap/percli for the CLI. Release archives on GitHub include SBOM files for the Go binaries and the source tree.
With no configuration, Perses uses file storage and does not require login, which is fine for a local trial and wrong for anything shared. Mount a configuration file and a data folder:
docker run -d --name perses -p 8080:8080 \
  -v $PWD/config.yaml:/etc/perses/config.yaml \
  -v $PWD/data:/perses/data \
  persesdev/perses --config=/etc/perses/config.yaml
Helm
helm repo add perses https://perses.github.io/helm-charts
helm repo update
helm install perses perses/perses \
  --namespace perses --create-namespace \
  --set config.database.file.folder=/perses/data \
  --set config.security.enable_auth=true
The chart passes config.* values into the server configuration, so everything in the configuration reference below can be set through values.yaml. Give the data folder a persistent volume if you use file storage.
The Perses Operator
The operator is the Kubernetes-native option and gives you the PersesDashboard and PersesDatasource resources. It needs cert-manager for its webhook certificates:
helm install perses-operator perses/perses-operatorIt watches these custom resources:
Persesdeclares a Perses server and the operator builds the Deployment (SQL storage) or StatefulSet (file storage with a persistent volume), the Service and the configuration.PersesDashboarddeclares a dashboard to sync to matching Perses instances. The resource’s namespace maps to a Perses project.PersesDatasourcedeclares a project-scoped data source in the same way.
The operator can also configure server TLS, client mTLS and datasource proxy TLS, supports basic auth, OAuth and native Kubernetes authentication, and exposes its own Prometheus metrics and alert rules. Its API is still versioned v1alpha (a v1alpha2 form appears in recent material), so treat the schema as evolving and use kubectl explain on your cluster.
Configuration reference
The server reads a YAML file (--config), and environment variables with the PERSES_ prefix can override keys, for example PERSES_DATABASE_FILE_FOLDER. The options that matter:
| Key | What it does |
|---|---|
database.file.folder, .extension (yaml or json), .case_sensitive |
File storage location and format |
database.sql.* |
SQL storage: address, database name, user, password or password_file, tls_config, timeouts |
security.readonly |
Rejects every create, update and delete call, for a server that only serves provisioned content |
security.enable_auth |
Requires a valid token on most endpoints |
security.encryption_key or encryption_key_file |
A 32-byte key (AES-256) that encrypts stored secrets such as data source passwords. If you do not set one a built-in default is used, so set your own |
security.authentication.access_token_ttl, refresh_token_ttl |
Token lifetimes, 15 minutes and 24 hours by default |
security.authentication.disable_sign_up |
Hides sign-up and disables user creation through the API |
security.authentication.providers.enable_native |
Built-in username and password login |
security.authentication.providers.oidc, .oauth |
External login providers: issuer or URLs, client_id, client_secret, redirect_uri, scopes |
security.authorization.guest_permissions |
Permissions granted to logged-in users by default |
provisioning.folders, provisioning.interval |
Folders of resources loaded at start and refreshed on an interval |
schemas.*_path, schemas.interval |
Where plugin schemas are read from |
important_dashboards, information |
Dashboards pinned on the home page and a Markdown banner |
deactivate_front |
Stops serving the web UI, for an API-only server |
The key list comes from the published configuration model of a recent but not the latest release, so check the configuration documentation for the release you install, especially for newer authorization and plugin settings.
Dashboards as code: a worked example
This example builds a dashboard with a variable, a panel and a data source, then validates and applies it.
Set up a CUE repository
mkdir dashboards && cd dashboards
cue mod init example.com/dashboards
percli dac setup            # downloads the Perses CUE SDK and plugins
(For Go use go mod init and percli dac setup --language go.) The current documentation requires percli 0.55.0 or later and a recent cue. A dashboard in CUE:
package mydac

import (
	dashboardBuilder "github.com/perses/perses/cue/dac-utils/dashboard"
	panelGroupsBuilder "github.com/perses/perses/cue/dac-utils/panelgroups"
	varGroupBuilder "github.com/perses/perses/cue/dac-utils/variable/group"
	labelValuesVarBuilder "github.com/perses/plugins/prometheus/sdk/cue/variable/labelvalues"
	panelBuilder "github.com/perses/plugins/prometheus/sdk/cue/panel"
	timeseriesChart "github.com/perses/plugins/timeserieschart/schemas:model"
	promQuery "github.com/perses/plugins/prometheus/schemas/prometheus-time-series-query:model"
	promDs "github.com/perses/plugins/prometheus/schemas/datasource:model"
)

dashboardBuilder & {
	#name:    "ServiceOverview"
	#project: "platform"

	#variables: {varGroupBuilder & {
		#input: [
			labelValuesVarBuilder & {
				#name:           "namespace"
				#metric:         "up"
				#label:          "namespace"
				#datasourceName: "prom"
			},
		]
	}}.variables

	#panelGroups: panelGroupsBuilder & {
		#input: [{
			#title: "Traffic"
			#cols:  2
			#panels: [
				panelBuilder & {
					spec: {
						display: name: "Request rate"
						plugin: timeseriesChart
						queries: [{
							kind: "TimeSeriesQuery"
							spec: plugin: promQuery & {
								spec: query: "sum(rate(http_requests_total{namespace=\"$namespace\"}[5m]))"
							}
						}]
					}
				},
			]
		}]
	}

	#datasources: prom: {
		default: true
		plugin: promDs & {
			spec: close({directUrl: "http://prometheus.monitoring.svc:9090"})
		}
	}
}
The same dashboard can be written in Go with the go-sdk (dashboard.New, AddVariable, AddPanelGroup, AddDatasource), and a Go program must not print to standard output, because dac build captures it. Reuse is the point: put panel definitions in shared modules, and build a hundred service dashboards from one template.
Build, validate and apply
percli dac build -f dashboard.cue -o json   # writes built/ServiceOverview.json
percli dac build -d dashboards              # all files in a folder, one dashboard per file
percli dac watch dashboards                 # rebuild on save while you work

percli lint -f built/ServiceOverview.json
percli lint -f built/ServiceOverview.json --online   # also validate against a running server

percli login http://perses.example.com --username admin
percli project platform
percli apply -f built/ServiceOverview.json
percli get dashboard
The dashboard as plain YAML
You can also write or generate the resource directly. This is the shape percli apply accepts and what the API stores:
kind: Dashboard
metadata:
  name: service-overview
  project: platform
spec:
  display:
    name: Service overview
  duration: 1h
  refreshInterval: 30s
  variables:
    - kind: ListVariable
      spec:
        name: namespace
        plugin:
          kind: PrometheusLabelValuesVariable
          spec:
            labelName: namespace
            matchers: ['up{job="app"}']
  panels:
    requests:
      kind: Panel
      spec:
        display:
          name: Request rate
        plugin:
          kind: TimeSeriesChart
          spec: {}
        queries:
          - kind: TimeSeriesQuery
            spec:
              plugin:
                kind: PrometheusTimeSeriesQuery
                spec:
                  query: sum(rate(http_requests_total{namespace="$namespace"}[5m]))
  layouts:
    - kind: Grid
      spec:
        items:
          - x: 0
            "y": 0
            width: 12
            height: 8
            content:
              $ref: "#/spec/panels/requests"
Note how the layout points at the panel by $ref, which is why a panel can be defined once and placed anywhere.
The data source
A global data source gives every project one Prometheus, with the server proxying the calls:
kind: GlobalDatasource
metadata:
  name: prom
spec:
  default: true
  plugin:
    kind: PrometheusDatasource
    spec:
      proxy:
        kind: HTTPProxy
        spec:
          url: http://prometheus.monitoring.svc:9090
If the Prometheus needs credentials, put them in the proxy settings as a secret reference rather than in the URL, so they are stored encrypted and never sent to the browser.
Migrating from Grafana
percli migrate -f grafana-dashboard.json --online -o json > perses-dashboard.json--online lets the server’s plugin migration scripts translate panels and queries. Review the result: unmapped panels become placeholders. The practical approach is to migrate your most-used dashboards, rebuild the rest as code, and keep Grafana running for the long tail until you have decided.
Production reference design on Kubernetes
- Run the operator, not hand-written manifests. Install cert-manager and the Perses Operator, declare a
Persesresource with SQL storage if you want several replicas, or file storage with a persistent volume for a single instance. - Keep dashboards in Git as code. One dashboard per file in a repository, CUE or Go modules for shared panels and variables, a CI job that runs
percli dac build,percli lintand, with a test server,percli lint --online. Theperses/cli-actionsGitHub workflow wraps the build, validate and apply steps. - Deliver by GitOps. Generate
PersesDashboardandPersesDatasourceresources in CI and let Argo CD or Flux apply them; the operator syncs them to Perses. Where you are not using the operator, runpercli applyfrom the pipeline against a service account. - One project per team or application. Namespaces map to projects with the operator, so team boundaries follow Kubernetes boundaries, and roles and role bindings grant access per project.
- Authentication on, sign-up off. Enable authentication with an OIDC provider, disable sign-up, set your own encryption key from a Secret, and set a short token lifetime.
- Treat the UI as read-mostly. Let the UI be for exploration and editing drafts; promote changes by exporting them back to code. For a server that only serves provisioned dashboards, set
security.readonly: true. - Pin versions and watch security releases. Release 0.54.0 fixed two security issues (below), so subscribe to the project’s advisories and upgrade promptly.
Security
- Turn authentication on. By default Perses does not block anything, so enable
security.enable_auth, use OIDC or OAuth for people, and a dedicated service account forpercliin CI. - Control access with projects and roles. Authorization uses a Kubernetes-inspired model of roles and role bindings scoped to projects, with global equivalents. Review
guest_permissionsso a logged-in user does not get more than intended. - Protect stored secrets. Data source passwords and tokens are encrypted with the configured 32-byte key. If you rely on the built-in default key, anyone with the code and a copy of the data can decrypt them, so set your own.
- Keep credentials in the proxy. Browsers talk only to Perses; the datasource proxy holds the data source credentials. That makes the proxy’s authorization important: release 0.54.0 fixed a missing-authorization flaw in the datasource proxy that could disclose secrets across scopes, and a path traversal caused by an unvalidated project parameter. Both are the kind of defect to expect in a young project, and both are reasons to run a current release and to restrict network access.
- Use TLS. Terminate TLS in front of Perses or configure it in the operator, and use TLS to data sources and to the SQL database.
- Supply chain. Releases ship SBOMs for the binaries and the source; scan the image like any other.
Monitoring and day-2 operations
- Server health. Watch pod status, restarts, request errors and latency at the ingress, and the logs for provisioning and plugin-loading errors. The operator provides built-in Prometheus metrics and alerting rules compatible with the Prometheus Operator.
- Storage. For file storage, back up the data folder; for SQL, back up the database. With the operator and Git as the source of truth, a restore is “redeploy and reapply”, but secrets and users still need backing up.
- Drift. If people edit dashboards in the UI, those edits can differ from Git. Decide the rule: provisioned and operator-managed resources are changed only in Git, and the UI is for drafts. Confirm how your version treats UI edits to operator-managed resources before relying on it.
- Plugins and image size. Each release adds plugins and the project has said the default image may stop bundling some of them, and that plugins can be enabled or disabled by configuration, so read the release notes before upgrading.
- Upgrades. Perses is pre-1.0, so the data model and the operator’s API can change between releases. Upgrade the server,
percliand your SDK versions together, run your CI lint against the new version first, and keep the changelog open. - Capacity. The server is light; load comes from the data sources. The queries behind the panels, their time ranges and refresh intervals decide the load on Prometheus, so use variables and sensible defaults.
Usage cases
- Dashboards for many services from one template. Generate per-team or per-service dashboards from shared CUE or Go modules, validated in CI.
- GitOps observability. Deliver dashboards and data sources with Argo CD or Flux as Kubernetes resources.
- Embedding visualization. Put Perses panels or dashboards inside another product’s UI with the npm packages.
- A common specification. Use the open dashboard format as an interchange format between tools.
- Prometheus, traces and logs in one place. View metrics, Tempo traces and Loki logs together.
In the Sprint 4 final project, a pharmaceutical plant’s machine and platform metrics are shown on Perses dashboards defined as code.
Version and project status
Perses is a CNCF Sandbox project, developed in the public perses/perses repository, with the plugins in perses/plugins, the operator in perses/perses-operator and the charts in perses/helm-charts. It is pre-1.0 (0.x versions), releases arrive every few months with frequent betas, and the dashboard model has been stabilising since it was first released. Version 0.52 added logs and profiling support (Loki, Pyroscope and new panels); 0.54.0 added more plugins, deprecated the @perses-dev/core npm package in favour of @perses-dev/spec and @perses-dev/client, and carried two security fixes. The operator reached 0.4.0 in April 2026 and a Helm chart for it is newly released, so expect rough edges there. The project’s roadmap page lists what is next.
Adoption
The CNCF’s announcement material notes that Red Hat and Chronosphere embedded Perses in their products and joined Amadeus as contributors, and Red Hat OpenShift uses Perses for part of its tracing UI. GreptimeDB embeds Perses in its built-in dashboard, and Dash0 uses the Perses dashboard format. These are vendor and integration relationships rather than a list of production end users, so ask the project about reference users for your sector.
Alternatives
| Solution | Model | Best suited to |
|---|---|---|
| Grafana | UI-first dashboards with a large plugin catalogue and alerting | Teams that need the broadest data source coverage or Grafana’s alerting and ecosystem |
| Grafana with provisioning, Jsonnet or Terraform | Dashboard-as-code on top of Grafana | Teams that want code-managed dashboards but keep Grafana |
| Prometheus’ built-in expression browser | Query and graph UI | Ad-hoc queries, not shared dashboards |
| Kibana, OpenSearch Dashboards | Dashboards over a search back end | Log and event data in Elasticsearch or OpenSearch |
| Managed observability platforms | Hosted dashboards | Teams that prefer a vendor to run the stack |
Strengths and limitations
| Strengths | Limitations |
|---|---|
| Dashboards are a clean, validated specification, so review and CI work well | A young project: pre-1.0, with a data model and operator API that are still changing |
| Go and CUE SDKs allow reuse across hundreds of dashboards | Fewer data sources and panel types than Grafana |
| Operator and CLI make GitOps delivery straightforward | No alerting engine, so alert rules stay in Prometheus and Alertmanager |
| Apache 2.0 and an open specification, with embeddable components | Grafana migration is best-effort; some panels need to be rebuilt by hand |
| Server proxy keeps data source credentials off the browser | Authentication is off by default, and two permission flaws were fixed in 0.54.0 |
Recommendation
Trial. Perses is a strong fit when your problem is managing many dashboards as code, you query Prometheus, and you want a permissive licence and a Kubernetes-native workflow. Begin with one project, one data source and a handful of dashboards written in CUE or Go, wire the lint step into CI, turn on authentication from the start and run a current release. Keep Grafana alongside it while you migrate and while you depend on its alerting or its wider plugin set, and re-check the plugin list for every data source you need before you commit.
References: Perses documentation · Perses on GitHub · Dashboard-as-Code guide · percli reference · Perses Operator · Perses plugins · Helm charts · Perses on Docker Hub · CNCF project page · Why Perses joined the CNCF · CNCF Landscape entry