Telegraf is a small, open-source agent that collects data from the systems around it, reshapes the data, and sends it somewhere else. It is plugin-driven: input plugins read from operating systems, services, message brokers, APIs and industrial devices; processor and aggregator plugins filter, rename, convert and summarise; output plugins write to databases, brokers, cloud services and monitoring systems. Everything is configured in one TOML file. It is written in Go, licensed under MIT, and InfluxData released it in 2015 as the collection agent for InfluxDB, though it works with many other destinations. Telegraf is not a CNCF project and is not itself a CNCF Landscape item; the Landscape lists its maker, InfluxData, under Observability and Analysis. It is included in this sprint because it is a practical way to bring industrial data, especially from OPC UA servers, into MQTT, Kafka or a time-series database. This brief explains Telegraf from the problem it solves to installing, configuring, securing, monitoring and operating it, with a full treatment of its OPC UA and MQTT plugins, so one read is enough to decide whether it fits your platform.
CNCF daily · Sprint 4, post 2 of 15 · Observability
At a glance
| Category | Observability and Analysis › Observability (the Landscape lists the maker, InfluxData, not Telegraf itself) |
| CNCF status | Not a CNCF project and not a CNCF Landscape item |
| Maker | InfluxData, with a large community of plugin contributors |
| Written in | Go |
| License | MIT |
| Plugin types | Inputs, processors, aggregators and outputs, plus parsers and serializers for data formats |
| Configuration | TOML: /etc/telegraf/telegraf.conf and a directory of *.conf fragments, /etc/telegraf/telegraf.d |
| Latest release | v1.40.2 (12 October 2026). Minor releases arrive roughly every three months |
| OPC UA plugins | inputs.opcua (since v1.16.0) and the subscription-based inputs.opcua_listener (since v1.25.0) |
| Deployment | OS packages, a Docker image, Kubernetes manifests, or sidecars injected by Telegraf Operator |
| Commercial option | Telegraf Enterprise, InfluxData’s product for managing Telegraf at scale |
The problem Telegraf solves
Every monitoring or analytics platform needs data from many sources, and every source speaks its own protocol: a database exposes statistics through SQL, a switch speaks SNMP or gNMI, a PLC speaks OPC UA or Modbus, an application publishes to MQTT or Kafka. The usual answers are a collector or exporter per source and a separate agent per destination, which means many binaries to deploy, update and secure, each with its own configuration language and failure modes.
Telegraf puts the pipeline in one agent. You declare which inputs to read, what to do to the data in flight, and which outputs to write to. The same agent can read OPC UA tags and publish them to MQTT, expose them for Prometheus to scrape, and write them to a database, all with consistent tags, batching, retries and buffering. It runs as a single static binary, so it fits on edge gateways and small servers as well as in containers.
Key concepts
| Term | Meaning |
|---|---|
| Metric | Telegraf’s internal data model: a name, a set of tags (indexed labels), a set of fields (the values) and a timestamp. Every input produces them and every output consumes them. |
| Input plugin | Collects metrics, on a schedule (interval) or as a service that listens for events. |
| Processor plugin | Transforms metrics between inputs and outputs: filter, rename, convert types, add tags, run a script. |
| Aggregator plugin | Computes windowed statistics, such as minimum, maximum, mean or histograms, over a stream of metrics. |
| Output plugin | Writes batches of metrics to a destination. |
| Parser and serializer | Convert incoming data into metrics, and metrics into a wire format such as InfluxDB line protocol or JSON (the data_format setting). |
| Agent | The running process and the [agent] settings that apply to all plugins: intervals, jitter, batch size and buffer limits. |
| Global tags | Tags added to every metric, for example a site or environment. |
| Metric filtering | Per-plugin namepass-style options, such as tagpass, tagdrop, fieldpass, fielddrop, taginclude and tagexclude, that decide which metrics, tags and fields pass. |
| Secret store | A source of credentials that the configuration references by name instead of embedding the value. |
Because every plugin speaks the same metric model, any input can be paired with any output. Tag design matters: each unique combination of tags is a series in most time-series databases, so tags with unbounded values, such as unique IDs, cause high cardinality.
Architecture
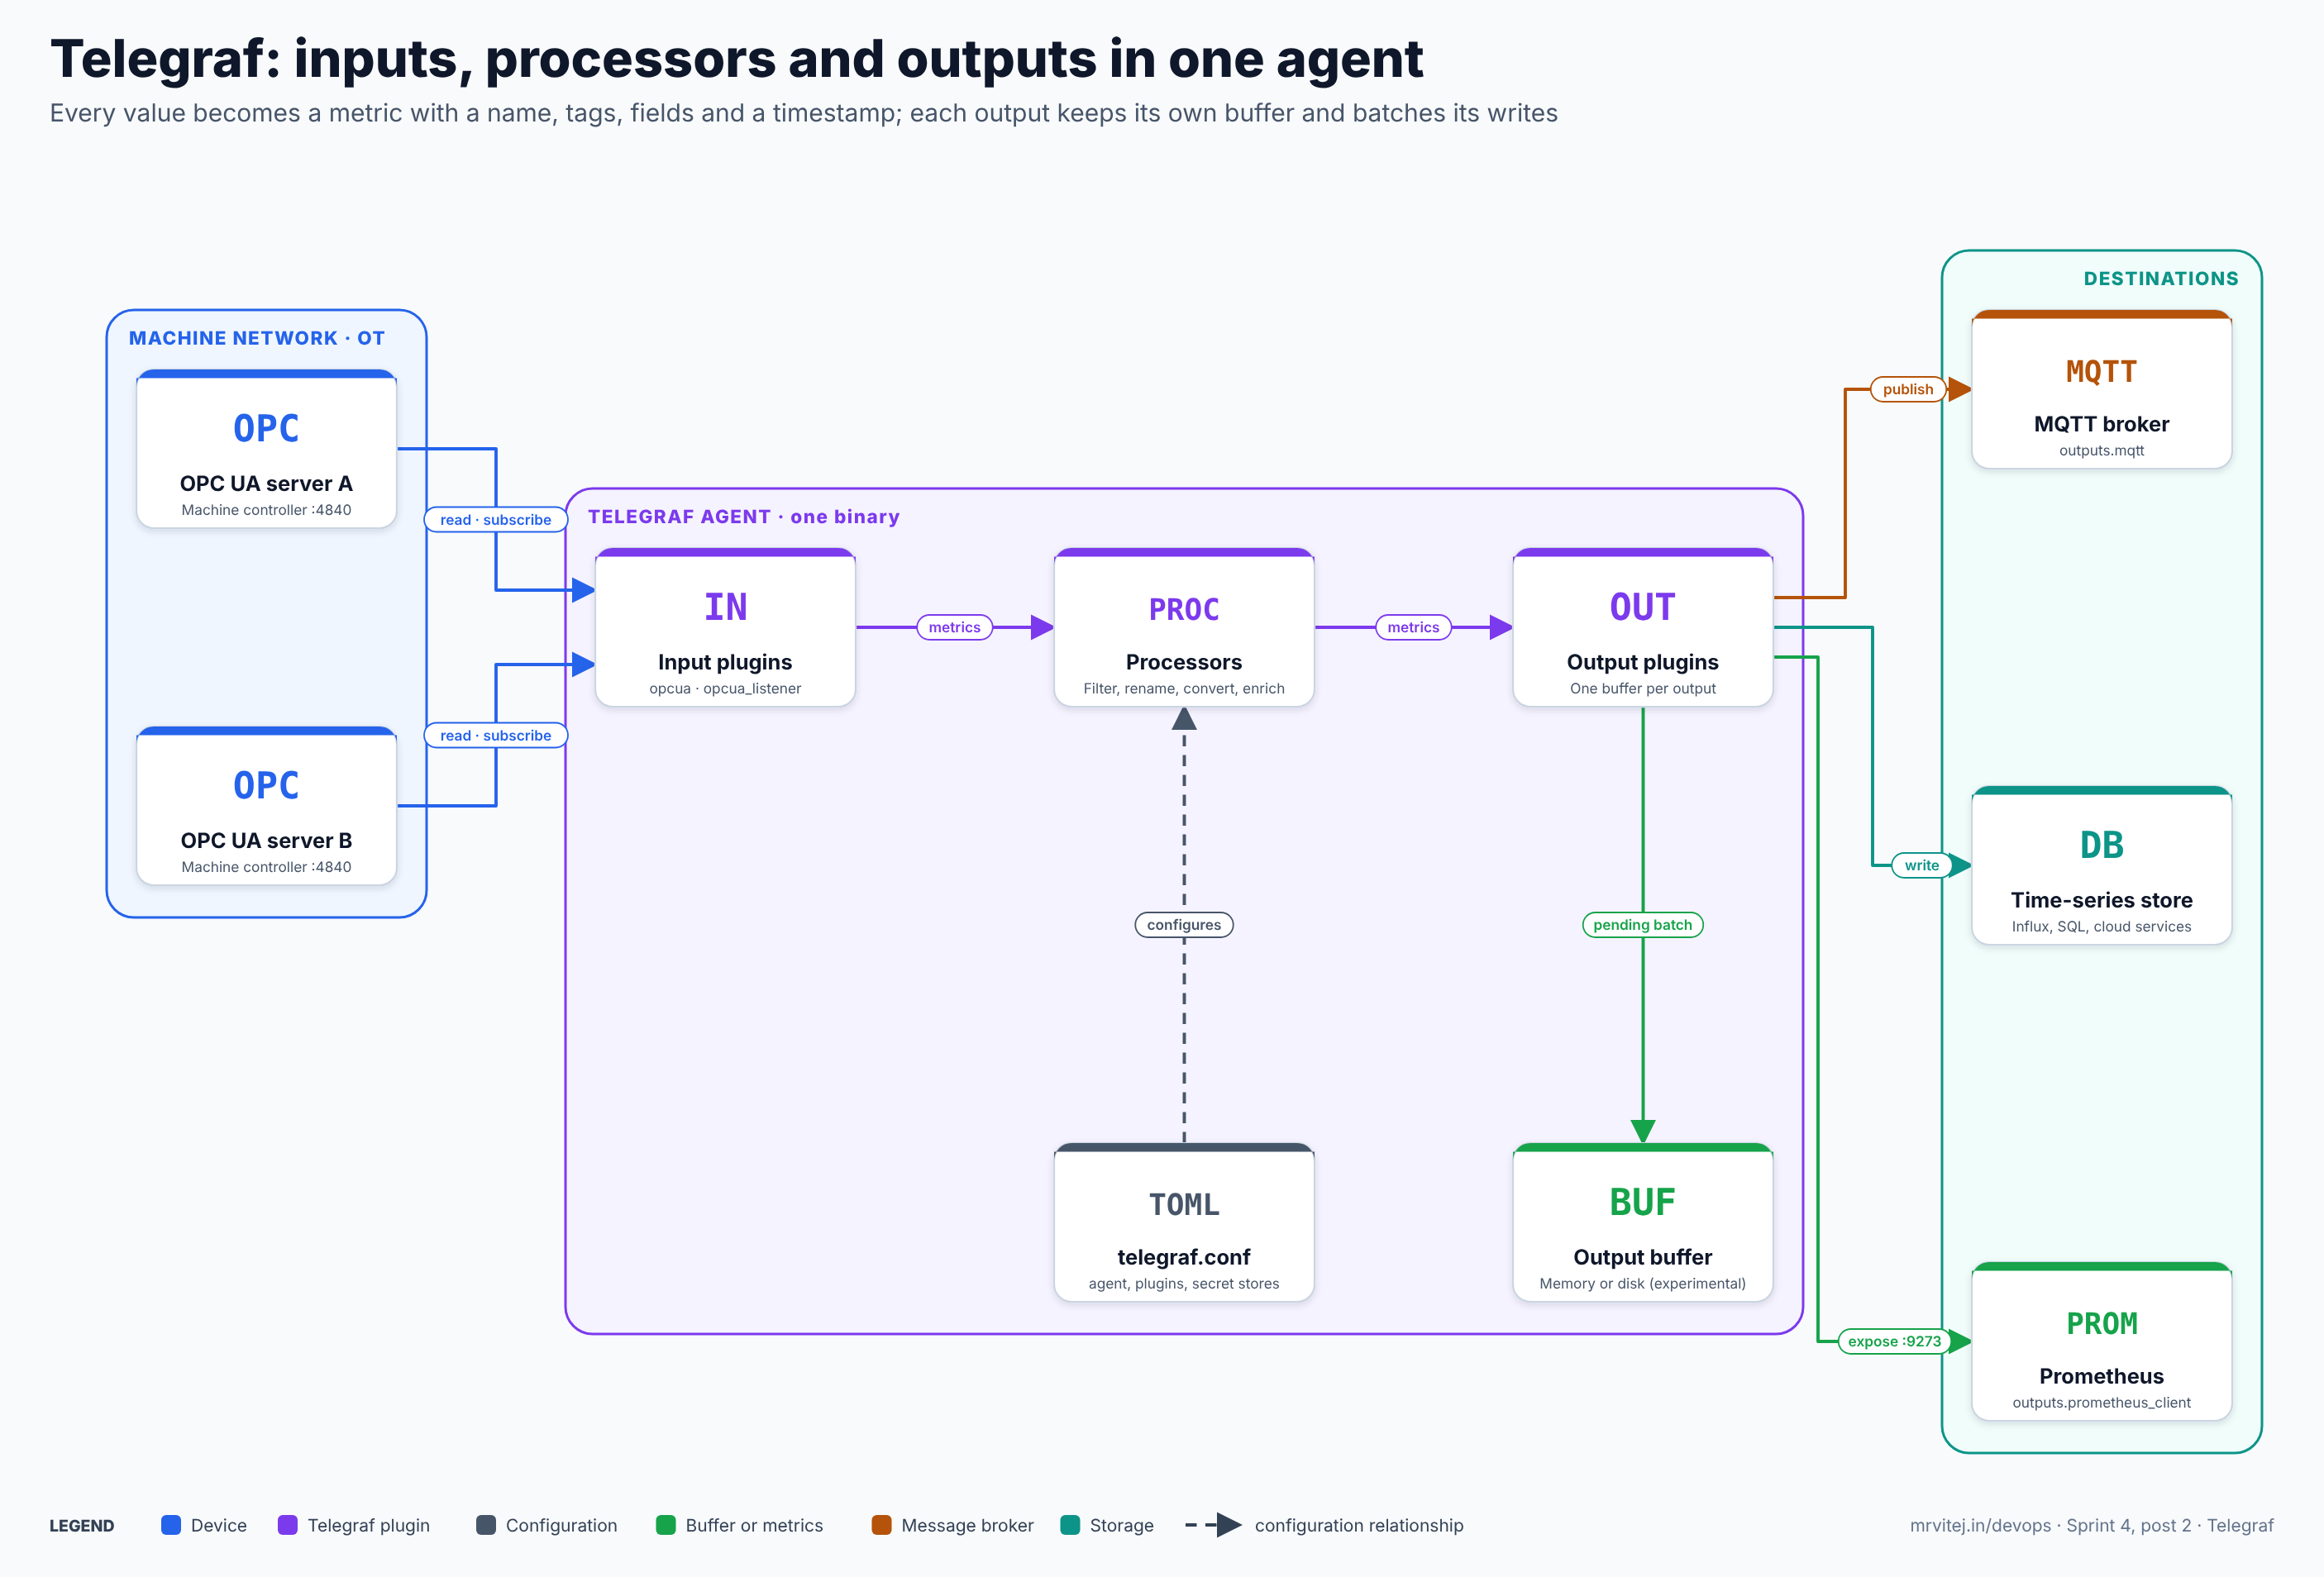
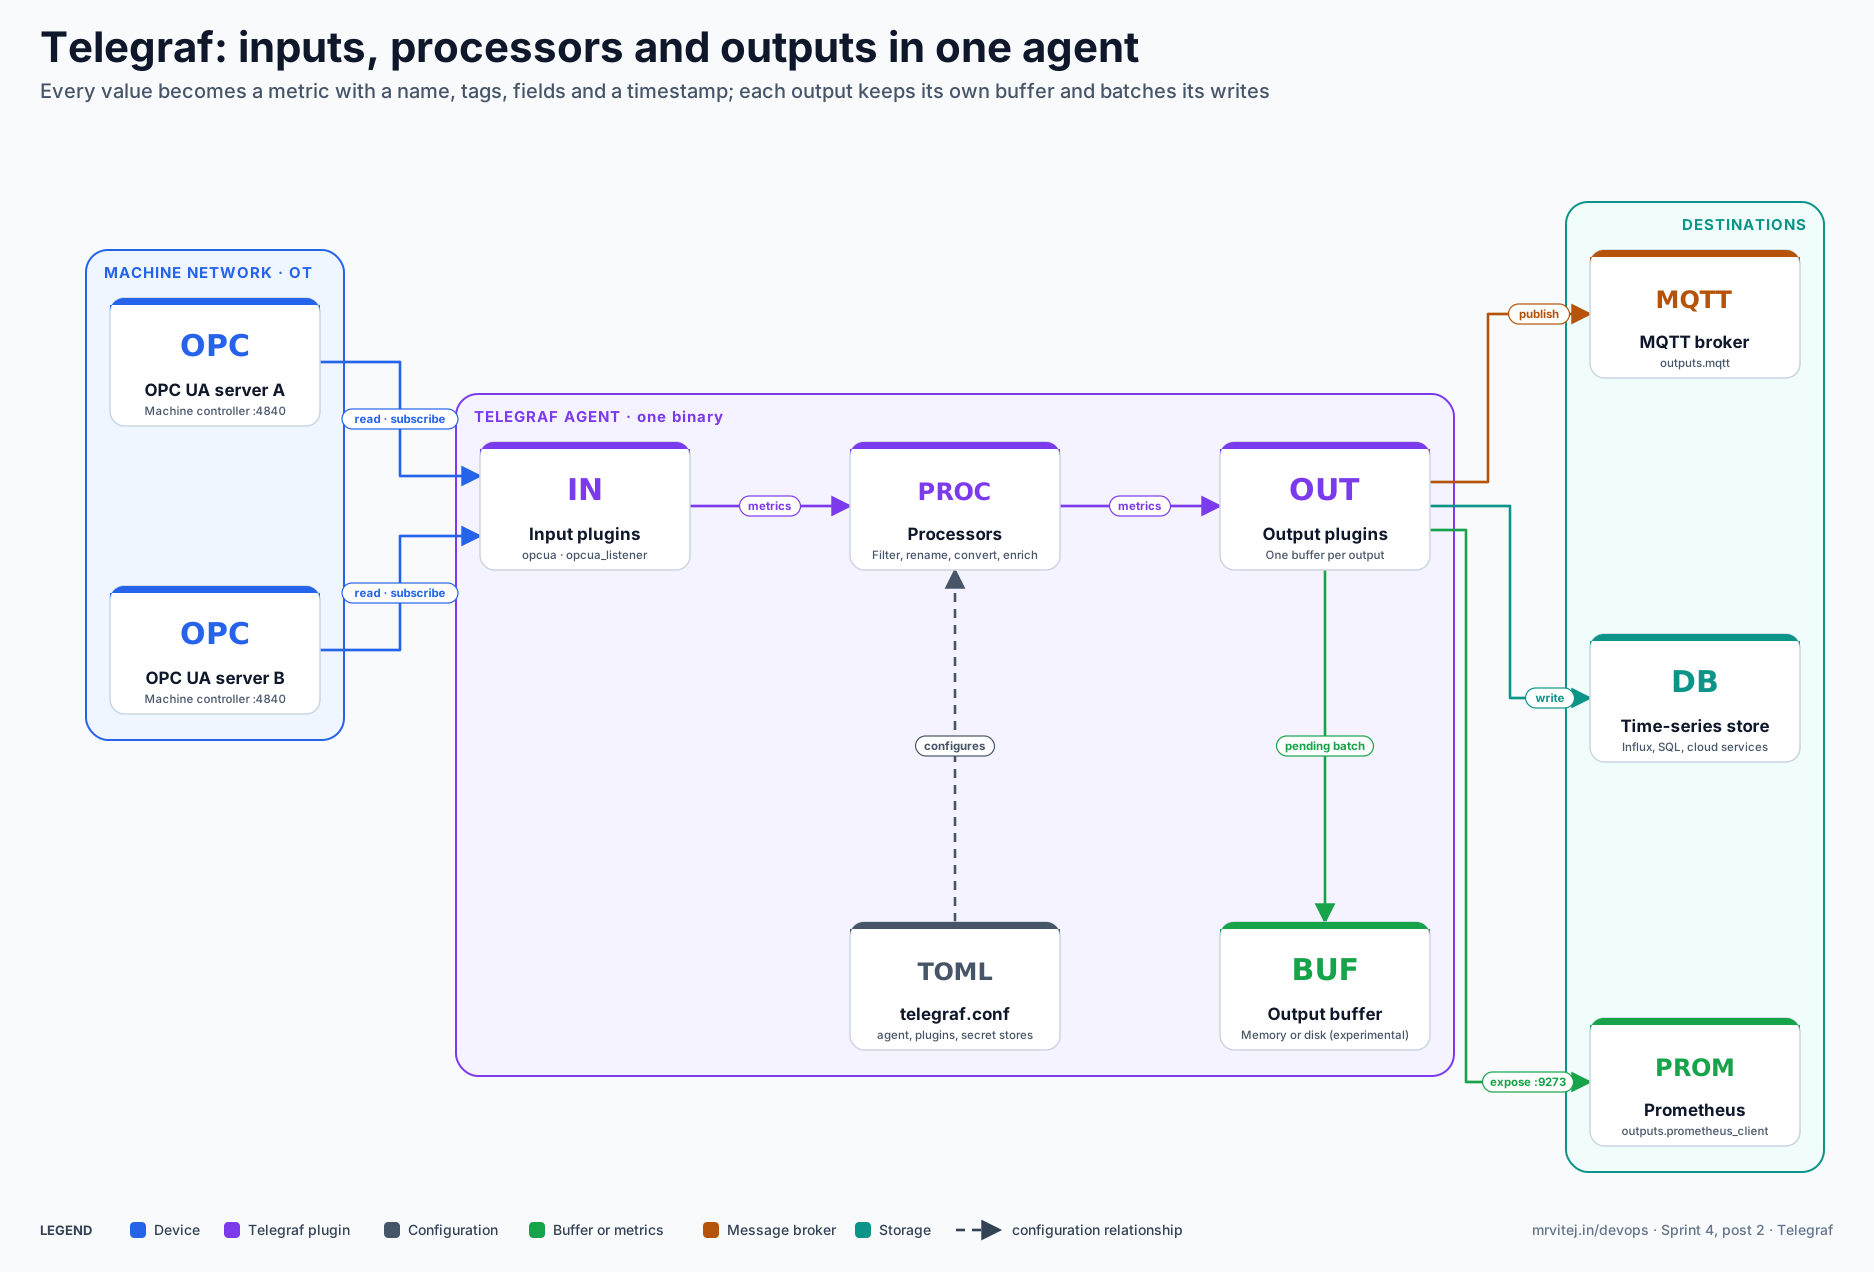
The agent is one process. Blue is a device, purple a Telegraf plugin, grey the configuration file, green a buffer or metrics endpoint, orange a message broker and teal a storage system. Open the zoomable diagram, or download it as SVG or PNG.
| Component | Responsibility |
|---|---|
| Agent | Loads the configuration, starts the plugins, schedules collection at the interval, and flushes outputs at the flush_interval. |
| Input plugins | Read from a source. Normal inputs gather on a schedule; service inputs, such as inputs.opcua_listener, wait for events and push metrics as they arrive. |
| Processors and aggregators | Run in order between inputs and outputs. Aggregators emit summary metrics at the end of each period. |
| Output plugins | Receive metrics in batches of at most metric_batch_size and write them. Each output has its own flush behaviour and its own buffer. |
| Output buffer | Holds metrics that have not been written yet. It is in memory by default, with an experimental on-disk strategy. |
| Configuration | One TOML file plus optional fragments; values can come from environment variables or secret stores. |
| Telegraf Operator | An optional Kubernetes component that injects Telegraf sidecars into pods from annotations. |
Design principle. Keep collection, transformation and delivery as separate, declarative stages in one agent, so each stage can change without touching the others.
From a machine value to an acknowledged message
The second diagram follows one value from an OPC UA server to an MQTT broker.
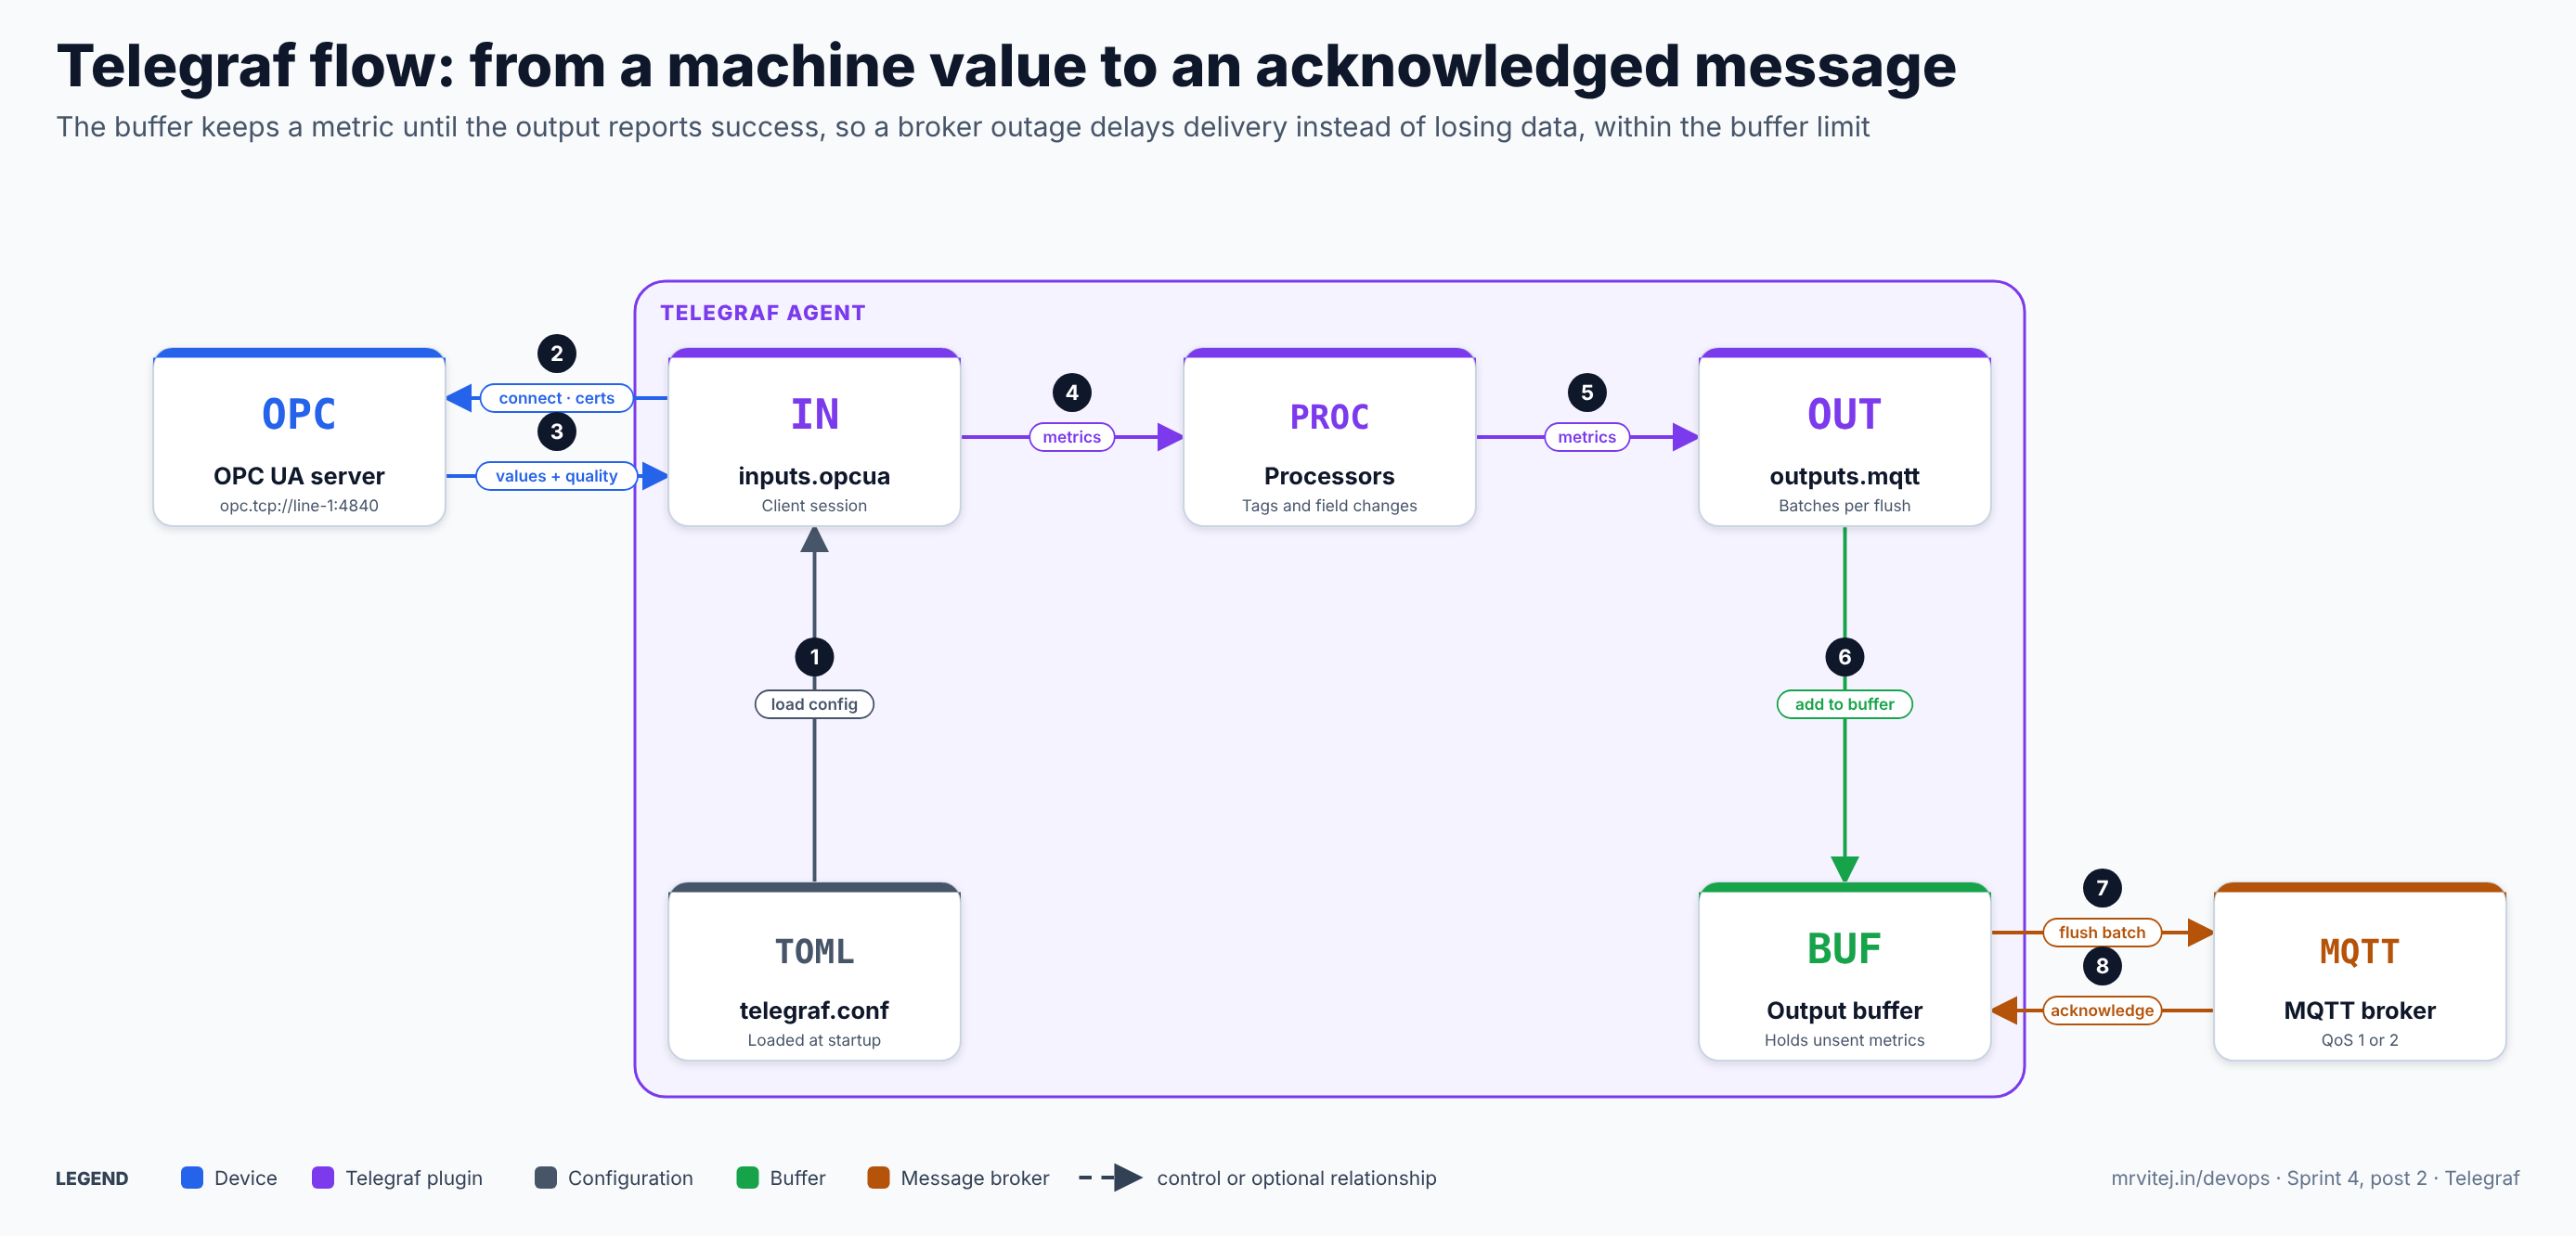
- Load config. Telegraf reads
telegraf.confand the files intelegraf.d, substitutes environment variables and resolves secrets, and starts the plugins. - Connect. The OPC UA input opens a client session to the server using the configured security policy, security mode, certificates and authentication method.
- Values and quality. The input receives the values of the configured nodes together with their OPC UA status, which becomes a
Qualityfield. - Metrics. The input turns each value into a metric with a name, tags such as the node ID, fields and a timestamp.
- Process. Processors add or change tags and fields, for example site and unit tags, or type conversions.
- Buffer. The MQTT output adds the metrics to its buffer.
- Flush. When the batch is full or the flush interval passes, the output publishes the batch to the broker.
- Acknowledge. When the broker accepts the messages, the output removes them from the buffer. If it does not, the metrics stay and are retried on a later flush, until the buffer limit is reached.
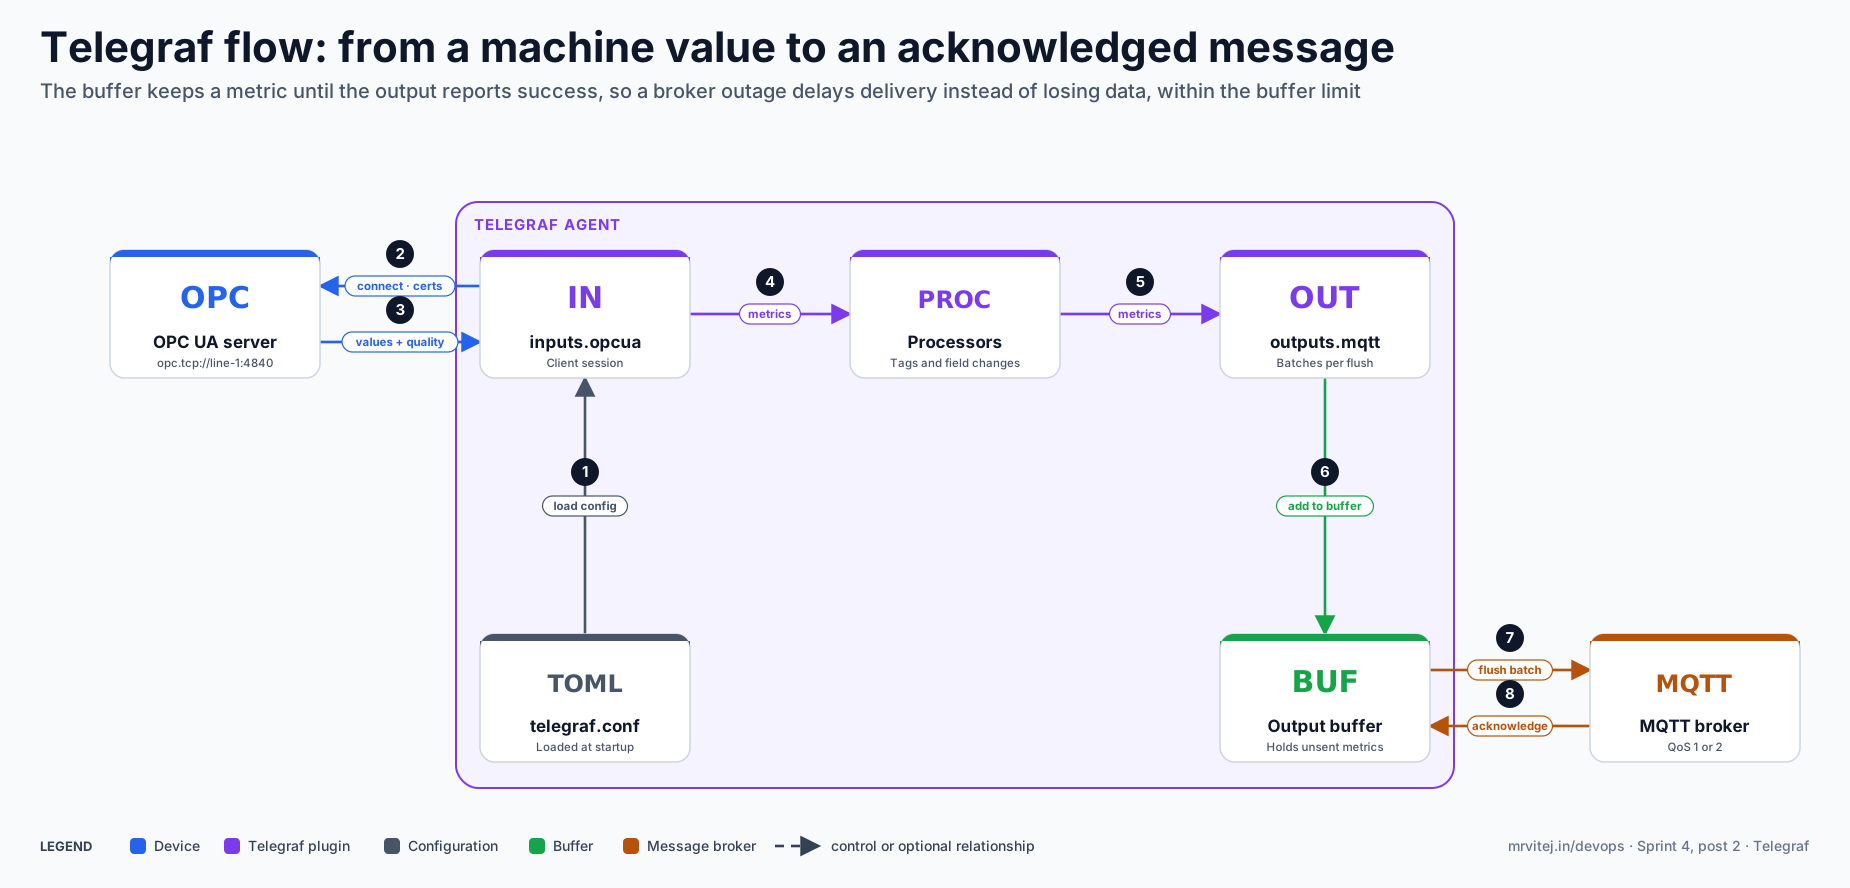
Open the zoomable flow diagram, or download it as SVG or PNG.
Install and first run
Telegraf is distributed as OS packages from InfluxData, as a Docker image, as release archives and as source. Once it is installed, a few commands cover most first steps:
telegraf config > telegraf.conf
telegraf --section-filter agent:inputs:outputs --input-filter cpu --output-filter influxdb config
telegraf --config telegraf.conf --test
telegraf --config telegraf.conf --once
telegraf --config /etc/telegraf/telegraf.conf --config-directory /etc/telegraf/telegraf.d
telegraf configprints a sample configuration with every plugin. The filter flags generate only the sections you name.--testruns the inputs once and prints the metrics to the screen without writing to the outputs. It is the quickest way to check node IDs and tag layout. For a service input such asinputs.opcua_listener,--testand--oncemay print nothing.--config-directoryloads every*.conffile in a directory in addition to the main file; packages use/etc/telegraf/telegraf.confand/etc/telegraf/telegraf.d.- Environment variables can be used anywhere in the file as
${VAR}; string values must be in quotes. From v1.38 Telegraf handles environment variables strictly by default, and--non-strict-env-handlingrestores the earlier behaviour while you migrate.
A minimal configuration shows the whole shape:
[agent]
  interval = "10s"
  flush_interval = "10s"

[[inputs.cpu]]

[[outputs.file]]
  files = ["stdout"]
Configuration reference
The [agent] table sets defaults for all plugins. The options that matter most:
| Option | Meaning |
|---|---|
interval |
Default collection interval for inputs. |
round_interval |
Align collection to the interval boundary, so a 10 s interval collects at :00, :10, :20. |
collection_jitter |
Random delay before collecting, so many plugins do not all fire at once. |
flush_interval and flush_jitter |
How often outputs flush, and a random extra delay so many agents do not write at the same moment. Do not set the flush interval below the collection interval. |
metric_batch_size |
Maximum metrics sent to an output in one write. |
metric_buffer_limit |
Maximum unsent metrics buffered for each output with the memory strategy; it counts metrics, not bytes. |
buffer_strategy, buffer_directory, buffer_disk_sync |
buffer_strategy = "disk" keeps pending metrics in a write-ahead log in buffer_directory, so they survive a restart. The disk strategy is marked experimental. |
precision |
Timestamp precision. |
hostname and omit_hostname |
Set or drop the host tag. |
debug and quiet |
Verbose logging, or errors only. |
Options available on any plugin include interval, alias (a name for one instance), tags (extra tags for one input), per-output flush_interval, metric_batch_size and metric_buffer_limit overrides, and the metric filters. [global_tags] adds tags to everything. Intervals are strings such as "500ms", "10s" or "1h".
OPC UA in depth
OPC UA is the standard communication protocol for industrial automation. Telegraf has two client plugins for it, and both browse and read the same kind of node addresses.
inputs.opcua |
inputs.opcua_listener |
|
|---|---|---|
| Type | Normal input on the interval |
Service input that subscribes and waits for data changes and events |
| Since | v1.16.0 | v1.25.0 |
| Use when | You want a value every interval, even if it has not changed | You want values only when they change, with server-side filtering, or you need events |
| Notes | The documentation describes both reads and subscriptions; test which one your version uses before relying on it | --test and --once may print nothing; subscription_interval defaults to 100 ms |
inputs.opcua options
| Option | Default | Meaning |
|---|---|---|
name |
opcua |
Metric name. |
endpoint |
opc.tcp://localhost:4840 |
Server address. |
connect_timeout, request_timeout, session_timeout |
5 s, 10 s, 20 m | Connect time limit, request time limit, idle session lifetime. |
read_retry_timeout, read_retry_count |
100 ms, 0 | Delay and number of retries after a failed read. |
reconnect_error_threshold |
1 | Consecutive errors before reconnecting. |
security_policy |
auto |
None, Basic128Rsa15, Basic256, Basic256Sha256 or auto. |
security_mode |
auto |
None, Sign, SignAndEncrypt or auto. |
certificate, private_key |
empty | Client certificate and key; set both or neither. |
remote_certificate |
not set | A server certificate to trust explicitly, needed for self-signed servers in Sign or SignAndEncrypt modes. |
auth_method |
Anonymous |
Certificate, UserName or Anonymous. |
username, password |
empty | For UserName authentication; secret stores are supported. |
timestamp |
gather |
gather (when Telegraf received it), server or source. |
optional_fields |
empty | DataType adds the OPC UA data type as a field. |
client_trace |
false |
Logs OPC UA client messages in debug mode; very verbose. |
Node addresses
An OPC UA node ID such as ns=3;s=Temperature has a namespace (ns=3) and an identifier of a type (s string, i numeric, g GUID, b opaque). You can write a node as a single id string (recommended) or with separate fields:
{name="temp", id="ns=3;s=Temperature"},
{name="temp", namespace="3", identifier_type="s", identifier="Temperature"},
Use namespace_uri instead of the numeric index when the index could change after a server is reconfigured; the URI is stable but Telegraf must read the server’s namespace table to resolve it. [[inputs.opcua.group]] sets shared defaults such as the metric name, namespace and tags for a set of nodes, and a node tag overrides a group tag. A [inputs.opcua.browse] section can discover nodes by walking the address space from a root node and matching browse paths with glob patterns, with depth, max_nodes and batch_size limits; the walk is repeated on each connect, so new nodes appear after a reconnect.
Certificates
When the security mode is not None, Telegraf is an OPC UA client and needs a client certificate. There are three ways to provide one. If you leave both paths empty, Telegraf generates a temporary self-signed certificate at every start, which the server must re-trust each time; use it only for tests. If you set both paths and the files do not exist, Telegraf creates them and reuses them afterwards, which is suitable for testing. For production, place certificates issued by your own PKI at the paths before starting, and Telegraf uses them unchanged. If only one of the two files exists, Telegraf stops with an error. The server must also trust the client certificate, which is usually the step that fails first.
Metric layout
Each node becomes a metric named after the node or group, with the node ID in an id tag, the value in a field named after the node, and a Quality field such as OK (0x0). Array values become indexed fields such as temp[0]. For example:
machine,id=ns\=2;s=Line1.Temperature,unit=degC temperature=71.4,Quality="OK (0x0)" 1767225600000000000A complete polling input
[[inputs.opcua]]
  name = "machine"
  endpoint = "opc.tcp://line-1.machines.local:4840"
  security_policy = "Basic256Sha256"
  security_mode = "SignAndEncrypt"
  certificate = "/etc/telegraf/pki/client-cert.pem"
  private_key = "/etc/telegraf/pki/client-key.pem"
  remote_certificate = "/etc/telegraf/pki/line-1-server-cert.pem"
  auth_method = "UserName"
  username = "${OPCUA_USER}"
  password = "${OPCUA_PASSWORD}"
  timestamp = "source"
  optional_fields = ["DataType"]

  [[inputs.opcua.nodes]]
    name = "temperature"
    id = "ns=2;s=Line1.Temperature"
    default_tags = { unit = "degC" }

  [[inputs.opcua.nodes]]
    name = "speed"
    id = "ns=2;s=Line1.Speed"
    default_tags = { unit = "rpm" }
The subscription-based listener
inputs.opcua_listener accepts the same connection and security settings and subscribes to nodes, so values arrive when the server reports a change instead of on every interval. Its subscription settings include subscription_interval (the rate the server should update monitored items, default 100 ms), queue_size (default 10) and discard_oldest. Per-node monitoring_params set the sampling interval and a data-change filter with a trigger (Status, StatusValue or StatusValueTimestamp) and an optional deadband (None, Absolute or Percent; percent needs an EURange on the node), which cuts noise at the source. Event subscriptions use [[inputs.opcua_listener.events]] with an event type node, source nodes and the fields to capture. connect_fail_behavior decides what happens when the first connection fails: error exits, ignore disables the plugin and retry tries again. For very large node sets, workarounds.monitored_items_batch_size splits the registration, because one huge request can fail with BadTcpMessageTooLarge. Take the exact TOML layout of the per-node tables from the plugin’s sample configuration for your version.
[[inputs.opcua_listener]]
  name = "machine_changes"
  endpoint = "opc.tcp://line-1.machines.local:4840"
  security_policy = "Basic256Sha256"
  security_mode = "SignAndEncrypt"
  certificate = "/etc/telegraf/pki/client-cert.pem"
  private_key = "/etc/telegraf/pki/client-key.pem"
  remote_certificate = "/etc/telegraf/pki/line-1-server-cert.pem"
  subscription_interval = "1s"
  connect_fail_behavior = "retry"

  [[inputs.opcua_listener.nodes]]
    name = "temperature"
    id = "ns=2;s=Line1.Temperature"
The MQTT output
outputs.mqtt publishes metrics to an MQTT broker and supports MQTT 3.1.1 and 5. The settings that matter:
| Option | Meaning |
|---|---|
servers |
Broker addresses as [scheme://]host:port; schemes are tcp://, mqtt://, tls:// and mqtts://, and TLS and non-TLS servers cannot be mixed. |
protocol |
3.1.1 (default) or 5. |
topic |
A Go template. Placeholders include {{ .Hostname }}, {{ .PluginName }}, {{ .Name }} and {{ .Tag "key" }}; empty segments and the wildcard characters + and # are invalid. |
qos |
0 at most once, 1 at least once, 2 exactly once. |
retain |
Set the retain flag so the broker keeps the latest message per topic. |
keep_alive |
Seconds. Mosquitto 2.0.12 and later rejects a zero value with “identifier rejected”, so set it explicitly. |
client_id |
A fixed client ID; a random one is generated if empty. |
layout |
non-batch (one message per metric, the default), batch (one message per flush per topic), field (one topic per field, value only, tags and timestamp dropped) or homie-v4. |
data_format |
The serialisation of the payload, such as influx or json. It is ignored by the field and homie-v4 layouts. |
TLS settings and username, password |
Certificates for mutual TLS, and credentials (secret stores are supported). |
| MQTT 5 properties | Content type, response topic, message expiry, topic alias and user properties under [outputs.mqtt.v5]. |
[[outputs.mqtt]]
  servers = ["mqtts://broker.example.internal:8883"]
  topic = 'plant/{{ .Tag "site" }}/{{ .Name }}'
  qos = 1
  keep_alive = 30
  client_id = "telegraf-site-1"
  layout = "non-batch"
  data_format = "json"
  tls_ca = "/etc/telegraf/pki/ca.pem"
  tls_cert = "/etc/telegraf/pki/client-cert.pem"
  tls_key = "/etc/telegraf/pki/client-key.pem"
  username = "${MQTT_USER}"
  password = "${MQTT_PASSWORD}"
Telegraf has many other outputs, including Kafka, several time-series databases and cloud services, and outputs.prometheus_client, which exposes the metrics on an HTTP port (for example listen = ":9273") for Prometheus to scrape.
Production reference design
This design puts Telegraf on an edge gateway or in a Kubernetes pod next to the OPC UA servers, publishing to a local MQTT broker.
- One configuration per concern. Keep
[agent]and global tags intelegraf.conf, and each source or sink in its own file undertelegraf.d, so a change to one machine does not touch the rest. - Tag at the edge. Add
site,areaandunittags with default tags or a processor, so downstream topics and queries are consistent.[global_tags] site = "site-1" [[processors.override]] [processors.override.tags] area = "packaging" - Size the buffer from the outage you must survive.
metric_buffer_limitcounts metrics for each output. For 2,500 metrics a second and a 20-minute outage with 25% headroom, the limit is 2,500 × 1,200 × 1.25 = 3,750,000 metrics. A full memory buffer overwrites the oldest metrics, and queued metrics are lost if Telegraf stops. - Consider the disk buffer for restarts.
buffer_strategy = "disk"with abuffer_directoryon persistent storage keeps pending metrics across restarts. It is experimental, Telegraf does not limit the disk space it uses, andbuffer_disk_sync = truefavours durability over speed, so monitor free space and inodes.[agent] interval = "5s" flush_interval = "10s" metric_batch_size = 5000 metric_buffer_limit = 3750000 buffer_strategy = "disk" buffer_directory = "/var/lib/telegraf/buffer" buffer_disk_sync = true - Run it on Kubernetes. Mount the configuration from a ConfigMap and the certificates and credentials from Secrets, give the pod a persistent volume if you use the disk buffer, and keep the OT-network access in a network policy. For per-application sidecars, Telegraf Operator injects a Telegraf container into pods from annotations such as
telegraf.influxdata.com/classandtelegraf.influxdata.com/inputs, using classes you define; it installs withhelm upgrade --install telegraf-operator influxdata/telegraf-operatorfromhttps://helm.influxdata.com/. Check the operator’s repository for current activity, because a community fork exists for it. - Prove it before production. Run
--test, then a real run withdebug = truefor a short period, then an outage drill: stop the broker, watch the buffer fill, restart it and confirm the backlog drains in order.
Security
- Credentials. Do not put passwords in the file. Use
${VAR}substitution from Secrets or, better, secret-store plugins (for example for the OS keyring, systemd credentials or Docker secrets) and reference them as@{store_id:key}. - OPC UA. Use
Basic256Sha256withSignAndEncrypt, certificates from your own PKI and an explicitremote_certificateor trust list. Use a read-only OPC UA account.Noneis for tests. - Transport. Use
mqtts://or TLS for every output, mutual TLS where the broker supports it, and avoidinsecure_skip_verify. - Host. Run as a non-root user, restrict the permissions on the configuration and key files, and allow network access only to the machine network and the destinations.
- Supply chain. Pin the version, verify the package or image, and update on a schedule, because there is a new minor release about every three months.
Monitoring and day-2 operations
inputs.internal makes Telegraf report on itself, including per-output buffer and write metrics. The ones to alert on are the buffer size approaching the buffer limit, the count of dropped metrics increasing, and rejected metrics. For disk buffering, watch filesystem bytes and inodes; for memory buffering, watch memory use against the container limit and restarts. Reload the configuration by signalling the process or with the --watch-config option where your version supports it, and check telegraf --help for the flags your version has.
| Symptom | Check |
|---|---|
| No OPC UA data | Run --test; check the node IDs, namespace index versus URI, the security policy and mode against the server’s endpoints, and that the server trusts the client certificate |
| Server flooded with sessions after errors | Update past v1.38.4, which disabled an auto-reconnect that could flood the server with sessions; check reconnect_error_threshold |
| Reloads leave sessions open | Update past v1.39.1, which closes the OPC UA session when the plugin stops |
| MQTT “identifier rejected” | Set keep_alive to a non-zero value for Mosquitto 2.0.12 or later |
| Data missing after an outage | The buffer filled and dropped the oldest metrics, or Telegraf restarted with the memory strategy; raise the limit or use the disk strategy |
| Duplicate messages | A flush succeeded at the broker but was not acknowledged; make consumers tolerate duplicates |
| Rising memory | Large metric_buffer_limit values per output; remember each output has its own buffer |
| Too many series downstream | Remove tags with unbounded values such as unique IDs |
Usage cases
- Infrastructure and application monitoring. Collect system, container, database and network metrics with the standard input plugins and send them to Prometheus, InfluxDB or a cloud service.
- Industrial data collection. Read OPC UA, Modbus and similar sources at an edge gateway and forward to MQTT, Kafka or a time-series database.
- Protocol bridging. Subscribe to MQTT or Kafka, reshape the data and write it elsewhere.
- Edge pre-processing. Filter, convert units, add tags and aggregate close to the source to reduce what crosses the network.
- In the Sprint 4 project. The final project of this sprint, a machine-monitoring platform for a pharmaceutical plant built on Google Cloud, uses Telegraf to read the machines’ OPC UA servers and publish their values to MQTT.
Version and project status
Telegraf is maintained by InfluxData and licensed under MIT. New minor versions have arrived about every three months (1.37 in December 2025, 1.38 in March 2026, 1.39 in June 2026 and 1.40 in September 2026, according to release trackers), with frequent patch releases; the project publishes release notes for each. Recent notes show the OPC UA plugins being actively fixed: v1.38.4 disabled an auto-reconnect that could flood a server with sessions and added byte-array decoding, and v1.39.1 closes sessions when a plugin stops and skips the client certificate on an unsecured connection. The disk buffer, introduced in v1.34, is still described as experimental. InfluxData also sells Telegraf Enterprise for managing fleets of agents. There is no published long-term roadmap beyond the release notes and the issue tracker, so follow those for what is coming.
Adoption
- InfluxData names customers including Tesla, Rolls Royce, Airbus, Teck, Graco and Graphite Energy as users of InfluxDB for industrial and IoT data, and describes Telegraf as InfluxDB’s collection agent, to which it added MQTT input for this purpose. The announcement is about InfluxDB, so treat it as evidence for the platform around Telegraf rather than for Telegraf alone.
- PTC and Siemens use InfluxDB as the time-series engine in their industrial platforms, according to the same announcement.
- SkyIO, a digital-factory consultancy, has presented with InfluxData a setup in which Telegraf Enterprise collects OPC UA tag data from servers such as Ignition’s.
- Telegraf is used on its own with many destinations, and the project’s release notes and issue tracker show a wide community of plugin contributors. Named production users of Telegraf alone are rarely published, so ask the community for current references.
Alternatives
| Solution | Model | Best suited to |
|---|---|---|
| OpenTelemetry Collector | Vendor-neutral pipeline for traces, metrics and logs | Standardising on OpenTelemetry; see the OpenTelemetry brief |
| Fluent Bit and Fluentd | Log and event collection and routing | Log pipelines; see the Fluentd brief |
| Prometheus with exporters | Pull-based metrics | Kubernetes and service metrics in Prometheus format; see the Prometheus brief |
| Industrial gateways and SCADA tools | Vendor products with OPC UA drivers and historian features | Plants that want supported, visual tooling and a historian |
| Node-RED or custom clients | Flow-based or hand-written collectors | Highly custom logic and small deployments |
Strengths and limitations
| Strengths | Limitations |
|---|---|
| One small binary with hundreds of plugins and a consistent data model | Not a CNCF project, and driven by one vendor |
| Declarative TOML pipelines with batching, retries and per-output buffers | Memory buffer loses data on restart; the disk buffer is experimental and unbounded |
| First-class OPC UA, MQTT, Modbus and many industrial and IT sources | Delivery is at least once, so duplicates are possible |
| Runs equally on edge gateways, servers and Kubernetes | OPC UA plugin behaviour and documentation have needed fixes between releases |
| MIT licence and a steady release cadence | Operator for Kubernetes sidecars has uncertain maintenance |
Recommendation
Trial. Telegraf is a strong choice when you need to collect from many kinds of sources and ship to several destinations from one small agent, and it is a practical OPC UA client for edge ingestion. Start with a simulated OPC UA server and a local MQTT broker, compare inputs.opcua with inputs.opcua_listener for your data, size the buffer from your outage requirement and run an outage drill. If you only need Prometheus-format metrics from services, exporters are simpler; if you want to standardise on OpenTelemetry across traces, metrics and logs, the OpenTelemetry Collector may fit better.
References: Telegraf documentation · OPC UA Client Reader plugin · OPC UA Client Listener plugin · MQTT Producer output plugin · Telegraf release notes · Telegraf repository · Telegraf: The Go Collection Agent · Telegraf Operator · InfluxData industrial IoT announcement · CNCF Landscape