Grafana Loki is a log aggregation system. Applications and nodes write logs; an agent such as Grafana Alloy or Fluent Bit ships them to Loki; Loki stores them cheaply; and you search them with a query language called LogQL, usually from Grafana. Its central design choice is to index only the labels attached to a log stream (for example namespace, app and cluster) and not the text of each log line. The lines themselves are compressed into chunks and kept in object storage such as Google Cloud Storage or Amazon S3. That makes storage small and cheap and ingestion fast, at the price of queries that scan chunks for the lines you ask about. It is a NON CNCF tool: the CNCF Landscape lists it under Observability and Analysis › Observability, but it is not a CNCF project. It is made by Grafana Labs and has been licensed under AGPLv3 since 2021, having been Apache 2.0 before that. This brief explains Loki from the problem it solves to installing, configuring, securing and operating it on Kubernetes with a Google Cloud Storage bucket, and states plainly that Loki alone does not make logs tamper-proof, so one read is enough to decide whether it fits your platform.
CNCF daily · Sprint 4, post 7 of 15 · Observability
At a glance
| Category | Observability and Analysis › Observability |
| CNCF status | NON CNCF. A CNCF Landscape item, not a CNCF project |
| Maker | Grafana Labs, with a large open-source community |
| Written in | Go |
| License | AGPLv3 (since April 2021; earlier versions were Apache 2.0). Grafana Enterprise Logs is the commercial distribution |
| Latest release | The 3.7 line (documentation “latest” is v3.7.x). 3.7.4 was published on 22 July 2026 and newer 3.7 patch releases may exist; 3.6.x still receives fixes |
| Query language | LogQL, modelled on PromQL, with log queries and metric queries |
| Storage | A single object store (GCS, S3, Azure Blob Storage and others) for chunks and a TSDB index; filesystem for development only |
| Deployment modes | Single binary, simple scalable (deprecated, to be removed before Loki 4.0) and distributed microservices |
| Install | Helm chart (now maintained in the grafana-community/helm-charts repository), Docker, a Kubernetes operator, or Grafana Cloud |
| Agents | Grafana Alloy, Fluent Bit, Fluentd, OpenTelemetry collectors and others. Promtail is deprecated and was removed in 3.7.3 |
| Tenancy | Multi-tenant by default, with the tenant set by the X-Scope-OrgID header |
| Alerting | A built-in ruler evaluates LogQL alerting and recording rules |
The problem Loki solves
Every platform produces logs, and the first answer is usually a search engine that indexes every word of every line. That works, and it is expensive: the index can be as large as the data, ingestion needs heavy CPU and memory, and the bill grows with the volume of logs, most of which nobody ever reads. Teams then shorten retention, drop logs, or sample them, and lose the evidence they need on the day something breaks.
Loki bets on a different pattern of use. Most log queries start from a small known set of dimensions: this namespace, this application, this time window. Index those, and scan the rest on demand. The index shrinks to a fraction of the size of the data, ingestion becomes appending compressed chunks to object storage, and a large retention window becomes affordable. The same labels link logs to Prometheus metrics and to traces, so you can move from a graph to the logs of the same pod.
The trade is clear. Loki is excellent at “show me the error lines from this service in the last hour” and at turning logs into metrics, and weaker at needle-in-a-haystack full-text search across everything for a rare term over months, where a full-text engine does better.
Key concepts
- Stream. A sequence of log lines that share exactly the same set of labels, such as
{namespace="shop", app="api", container="server"}. The stream is the unit Loki indexes, buffers and shards. - Label. A key-value pair on a stream. Labels are indexed, so every distinct combination of label values creates a new stream. Few, stable labels are the single most important rule.
- Structured metadata. Key-value pairs stored with each log line but not in the index and not part of the stream identity. It is the place for high-cardinality values such as trace and request IDs, available since Loki 3.0.
- Chunk. Log lines of one stream, compressed together. Ingesters build them in memory and flush them to object storage.
- Index. A TSDB index mapping label sets to chunks. Loki 3 defaults to the TSDB index with schema
v13. - Tenant. An isolated set of data identified by a tenant ID. With multi-tenancy on, each request carries an
X-Scope-OrgIDheader. - LogQL. A query language with a stream selector in braces, optional line and label filters, parsers, and metric functions such as
rateandcount_over_time. - Distributor, ingester, querier, query frontend, compactor, index gateway, ruler. The components, described below. They can run as one process or as separate services.
- Ring. A hash ring, kept in memberlist or a key-value store, that decides which ingester owns which stream.
Architecture
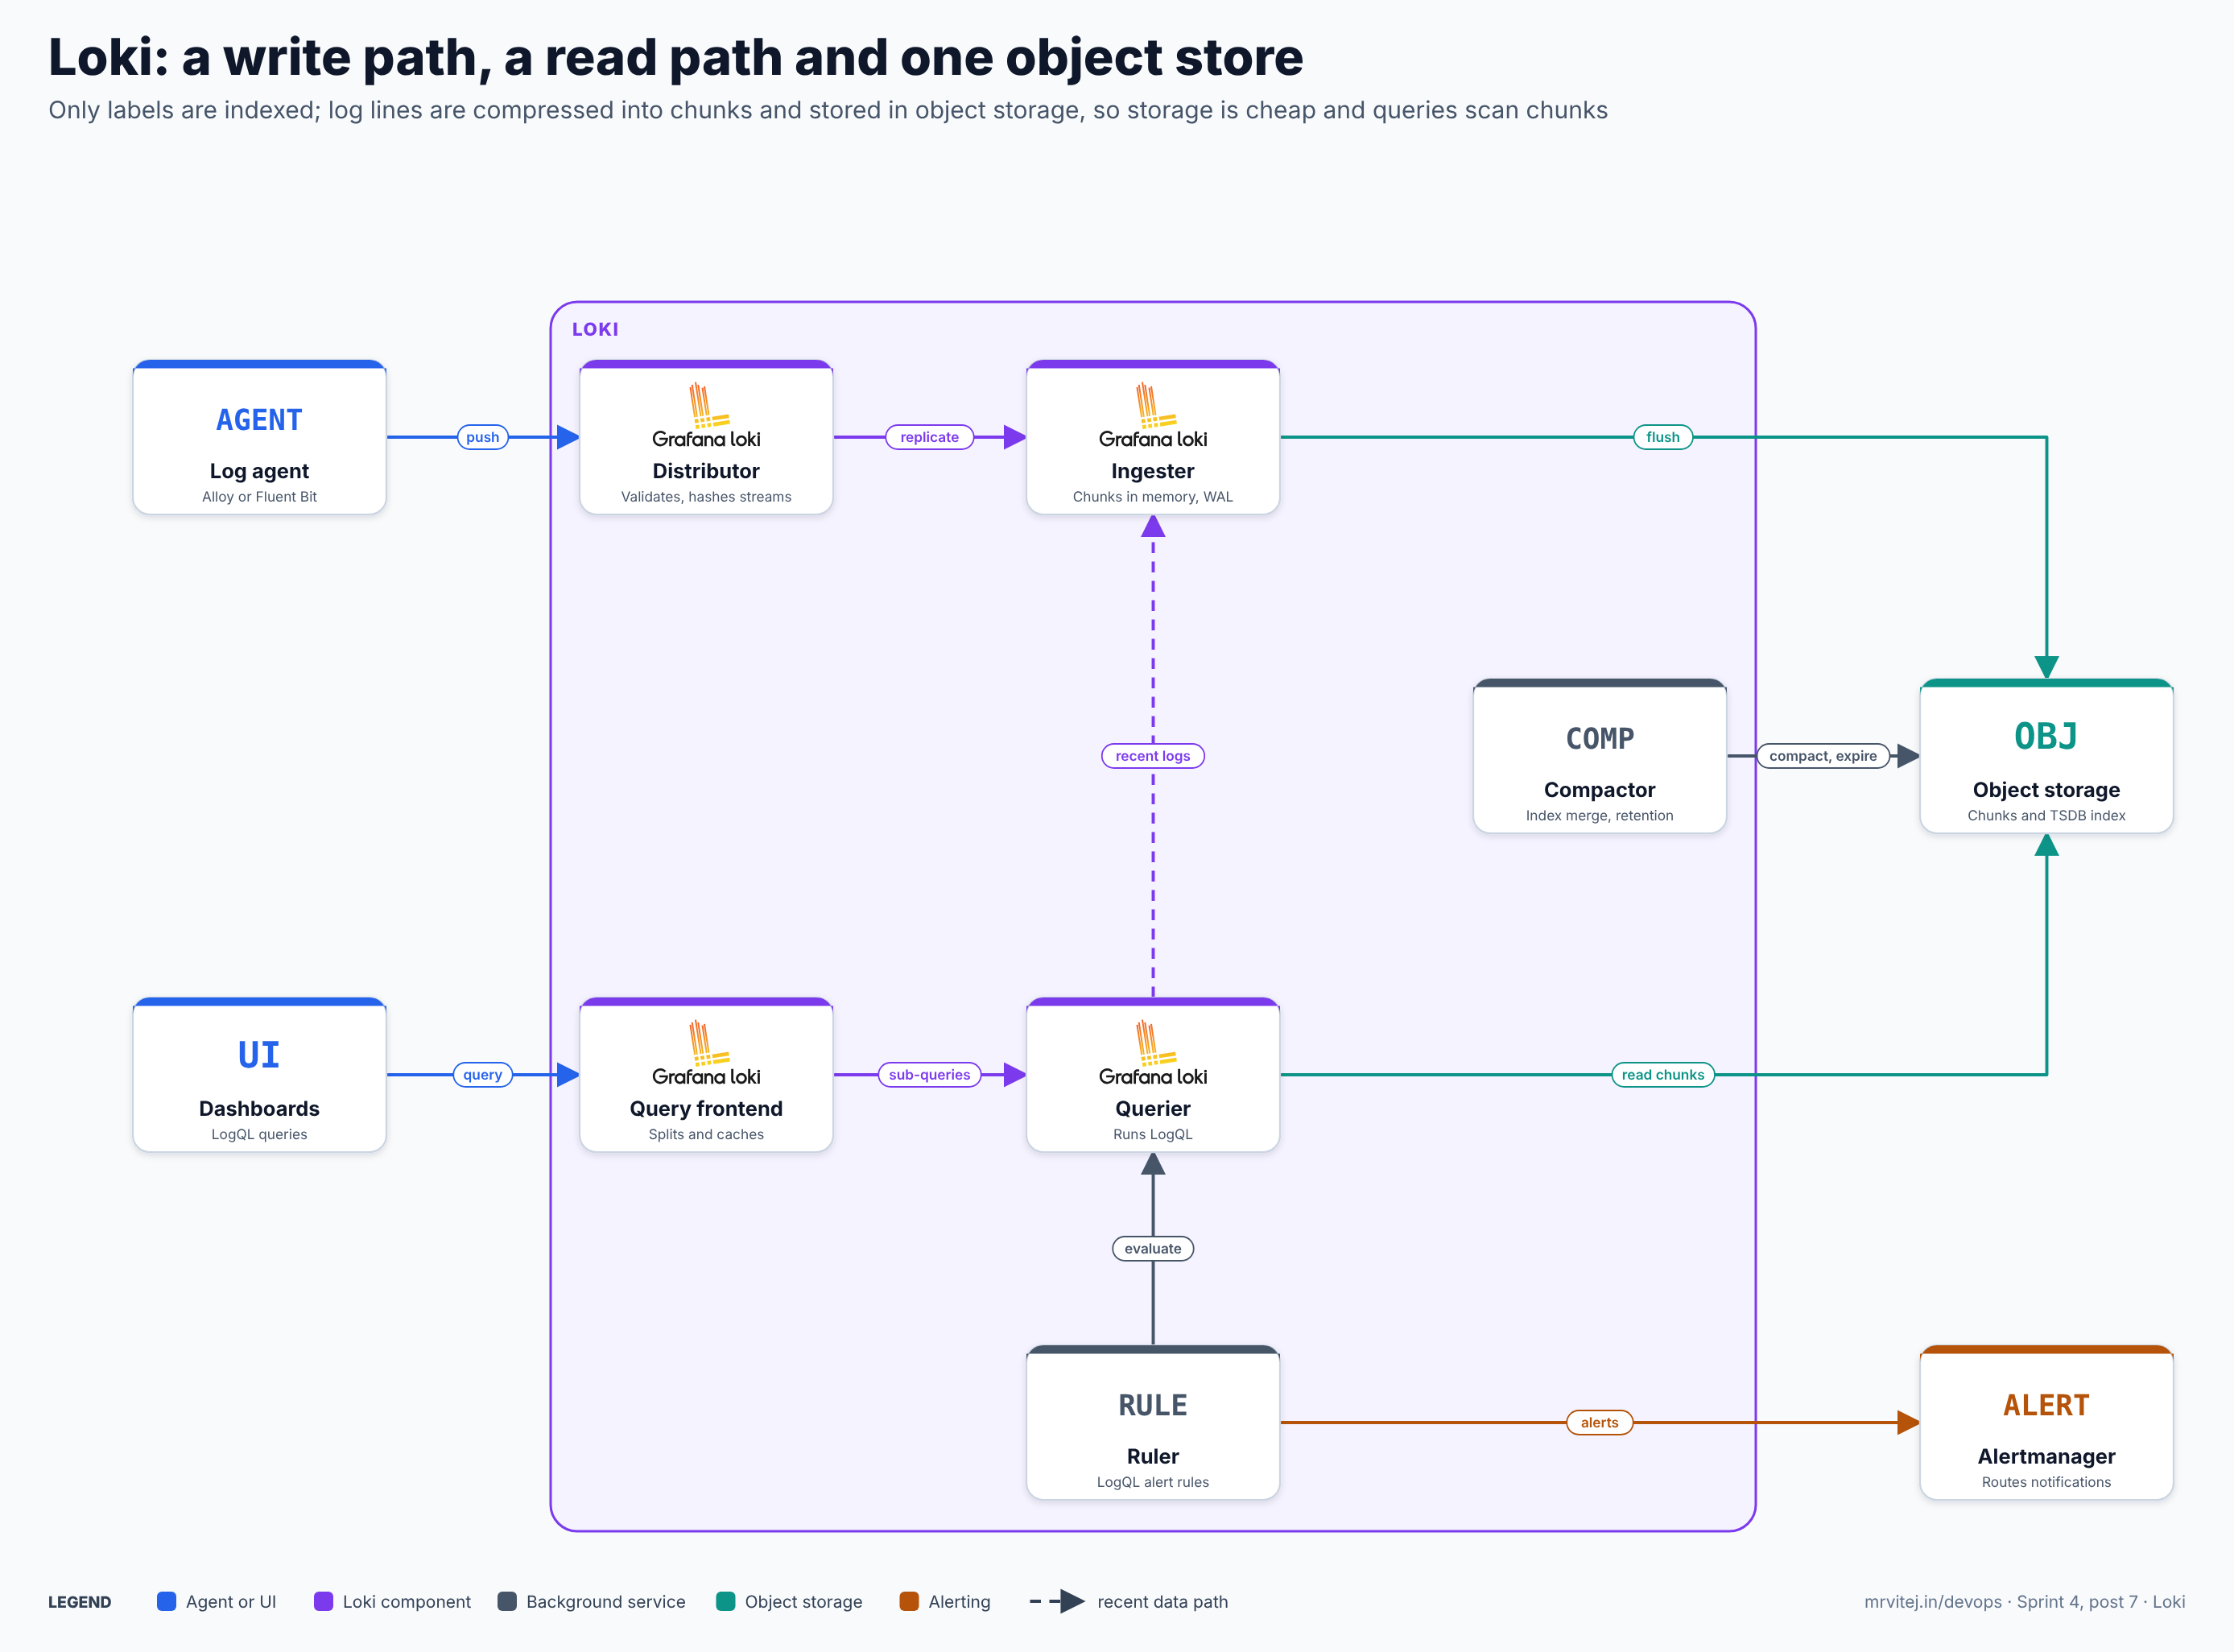
Writes and reads use different components that share one object store. Blue is an agent or dashboard, purple a Loki component, grey a background service, teal object storage and orange alerting. Open the zoomable diagram, or download it as SVG or PNG.
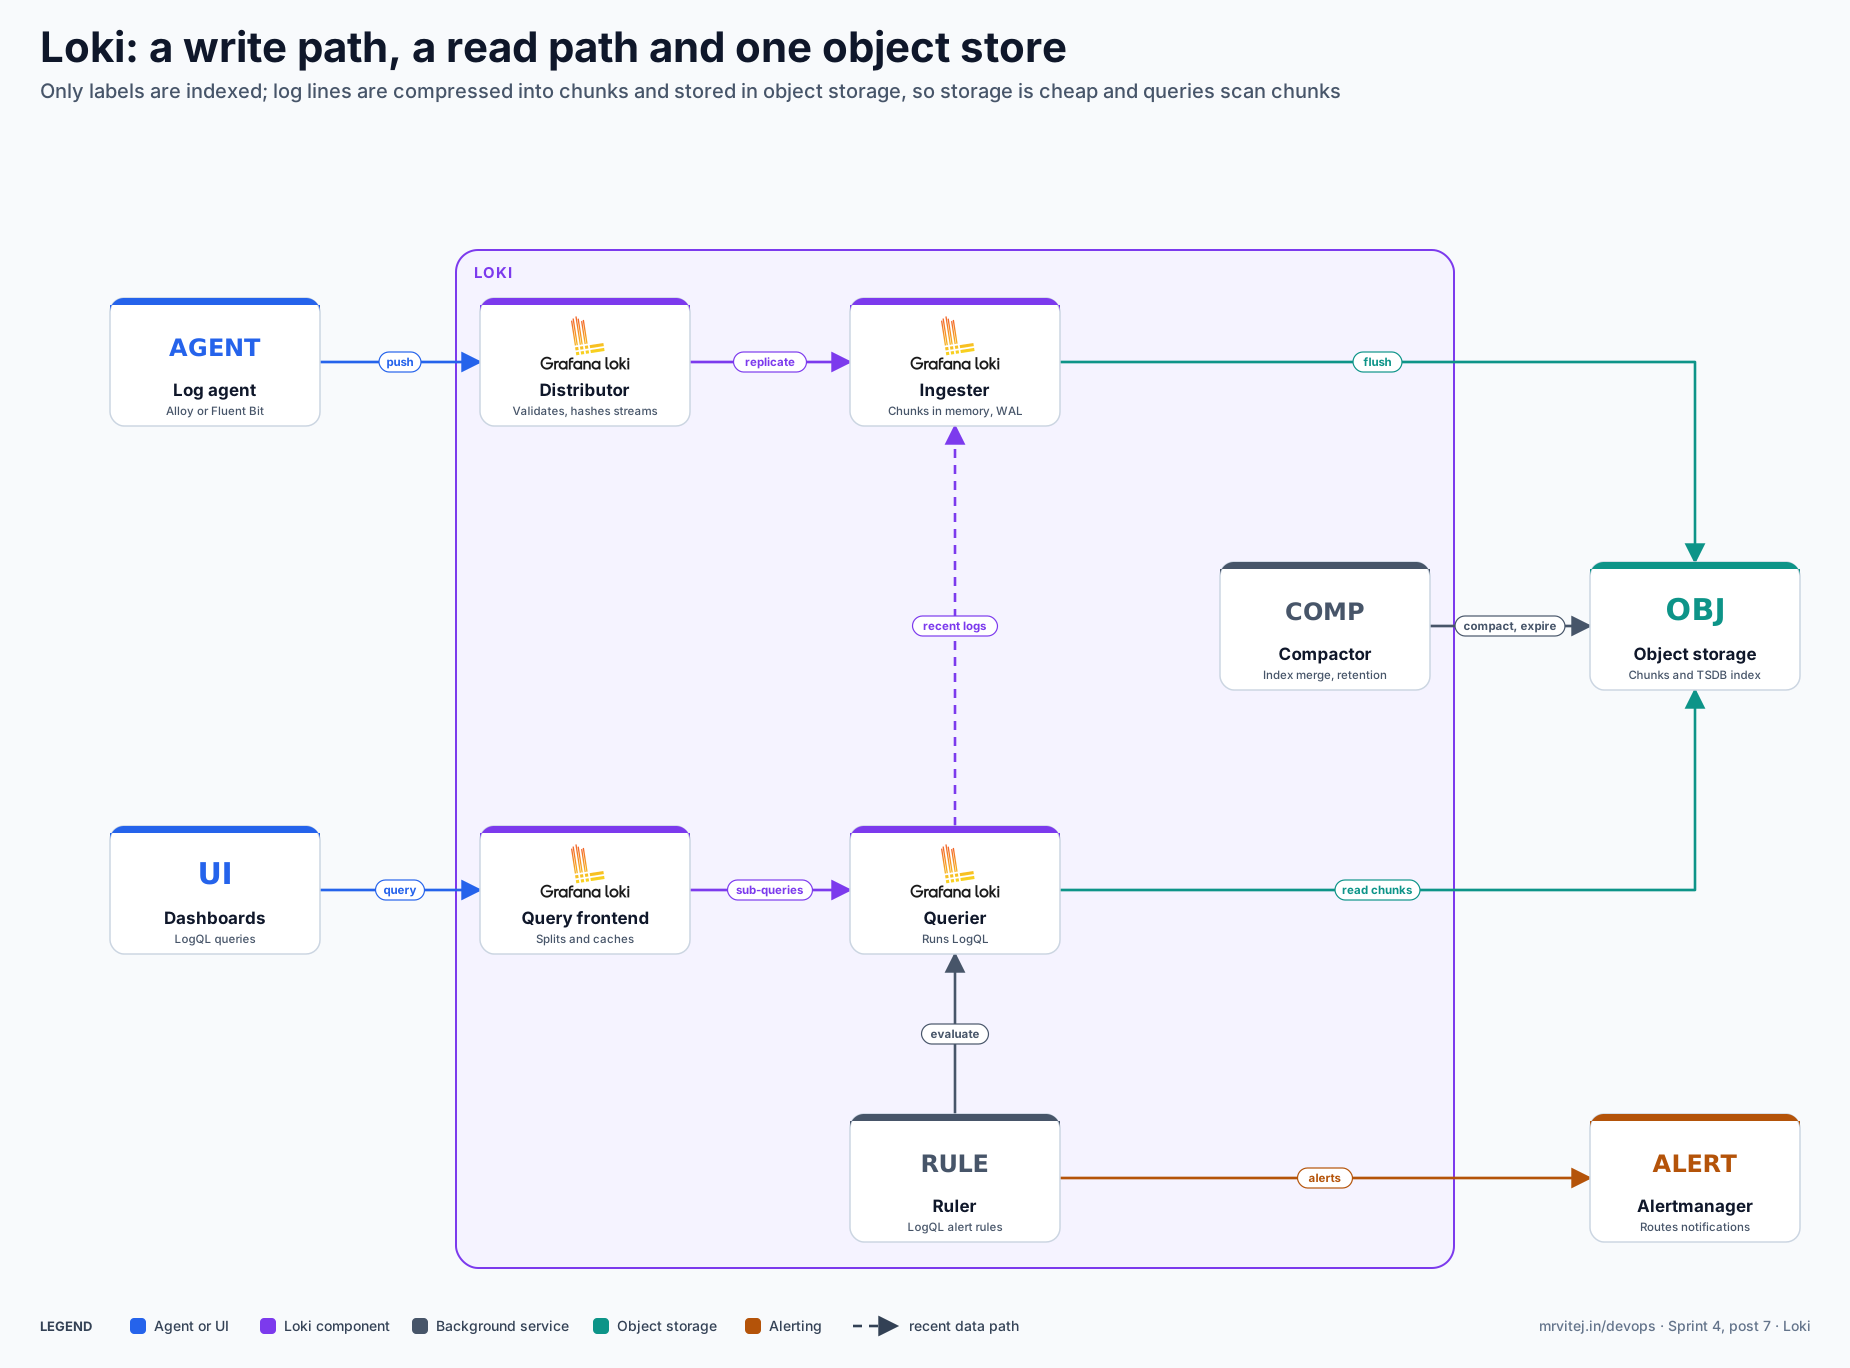
| Component | What it does |
|---|---|
| Distributor | Receives push requests, validates labels and line sizes against limits, hashes each stream and sends it to the right ingesters, replicating it (three copies by default in production setups) |
| Ingester | Holds recent log data in memory, builds compressed chunks, records writes in a write-ahead log, and flushes chunks and index entries to object storage |
| Query frontend | Splits a long query into smaller time ranges, caches results, and queues work fairly across tenants (optionally through a query scheduler) |
| Querier | Runs the LogQL, reading recent data from ingesters and older data from object storage, then merging and deduplicating |
| Index gateway | Serves index lookups so queriers do not each download the index from the object store |
| Compactor | Merges index files, and applies retention and deletion by marking and removing chunks |
| Ruler | Evaluates LogQL alerting and recording rules and sends alerts to Alertmanager |
| Object storage | The system of record for chunks and the index; ingesters are the only state outside it |
Deployment modes
- Single binary (
-target=all) runs every component in one process. Use it for development and small installations, with object storage rather than the local filesystem if the data matters. - Simple scalable splits the system into read, write and backend targets. It was the common Helm default, and the documentation now says it is being deprecated before Loki 4.0, with the timeline still to be decided. New designs should not start here.
- Distributed (microservices) runs each component as its own deployment, so you scale and size ingesters, queriers, the compactor and the rest independently. It is the shape to plan production around.
From a log line to a query result
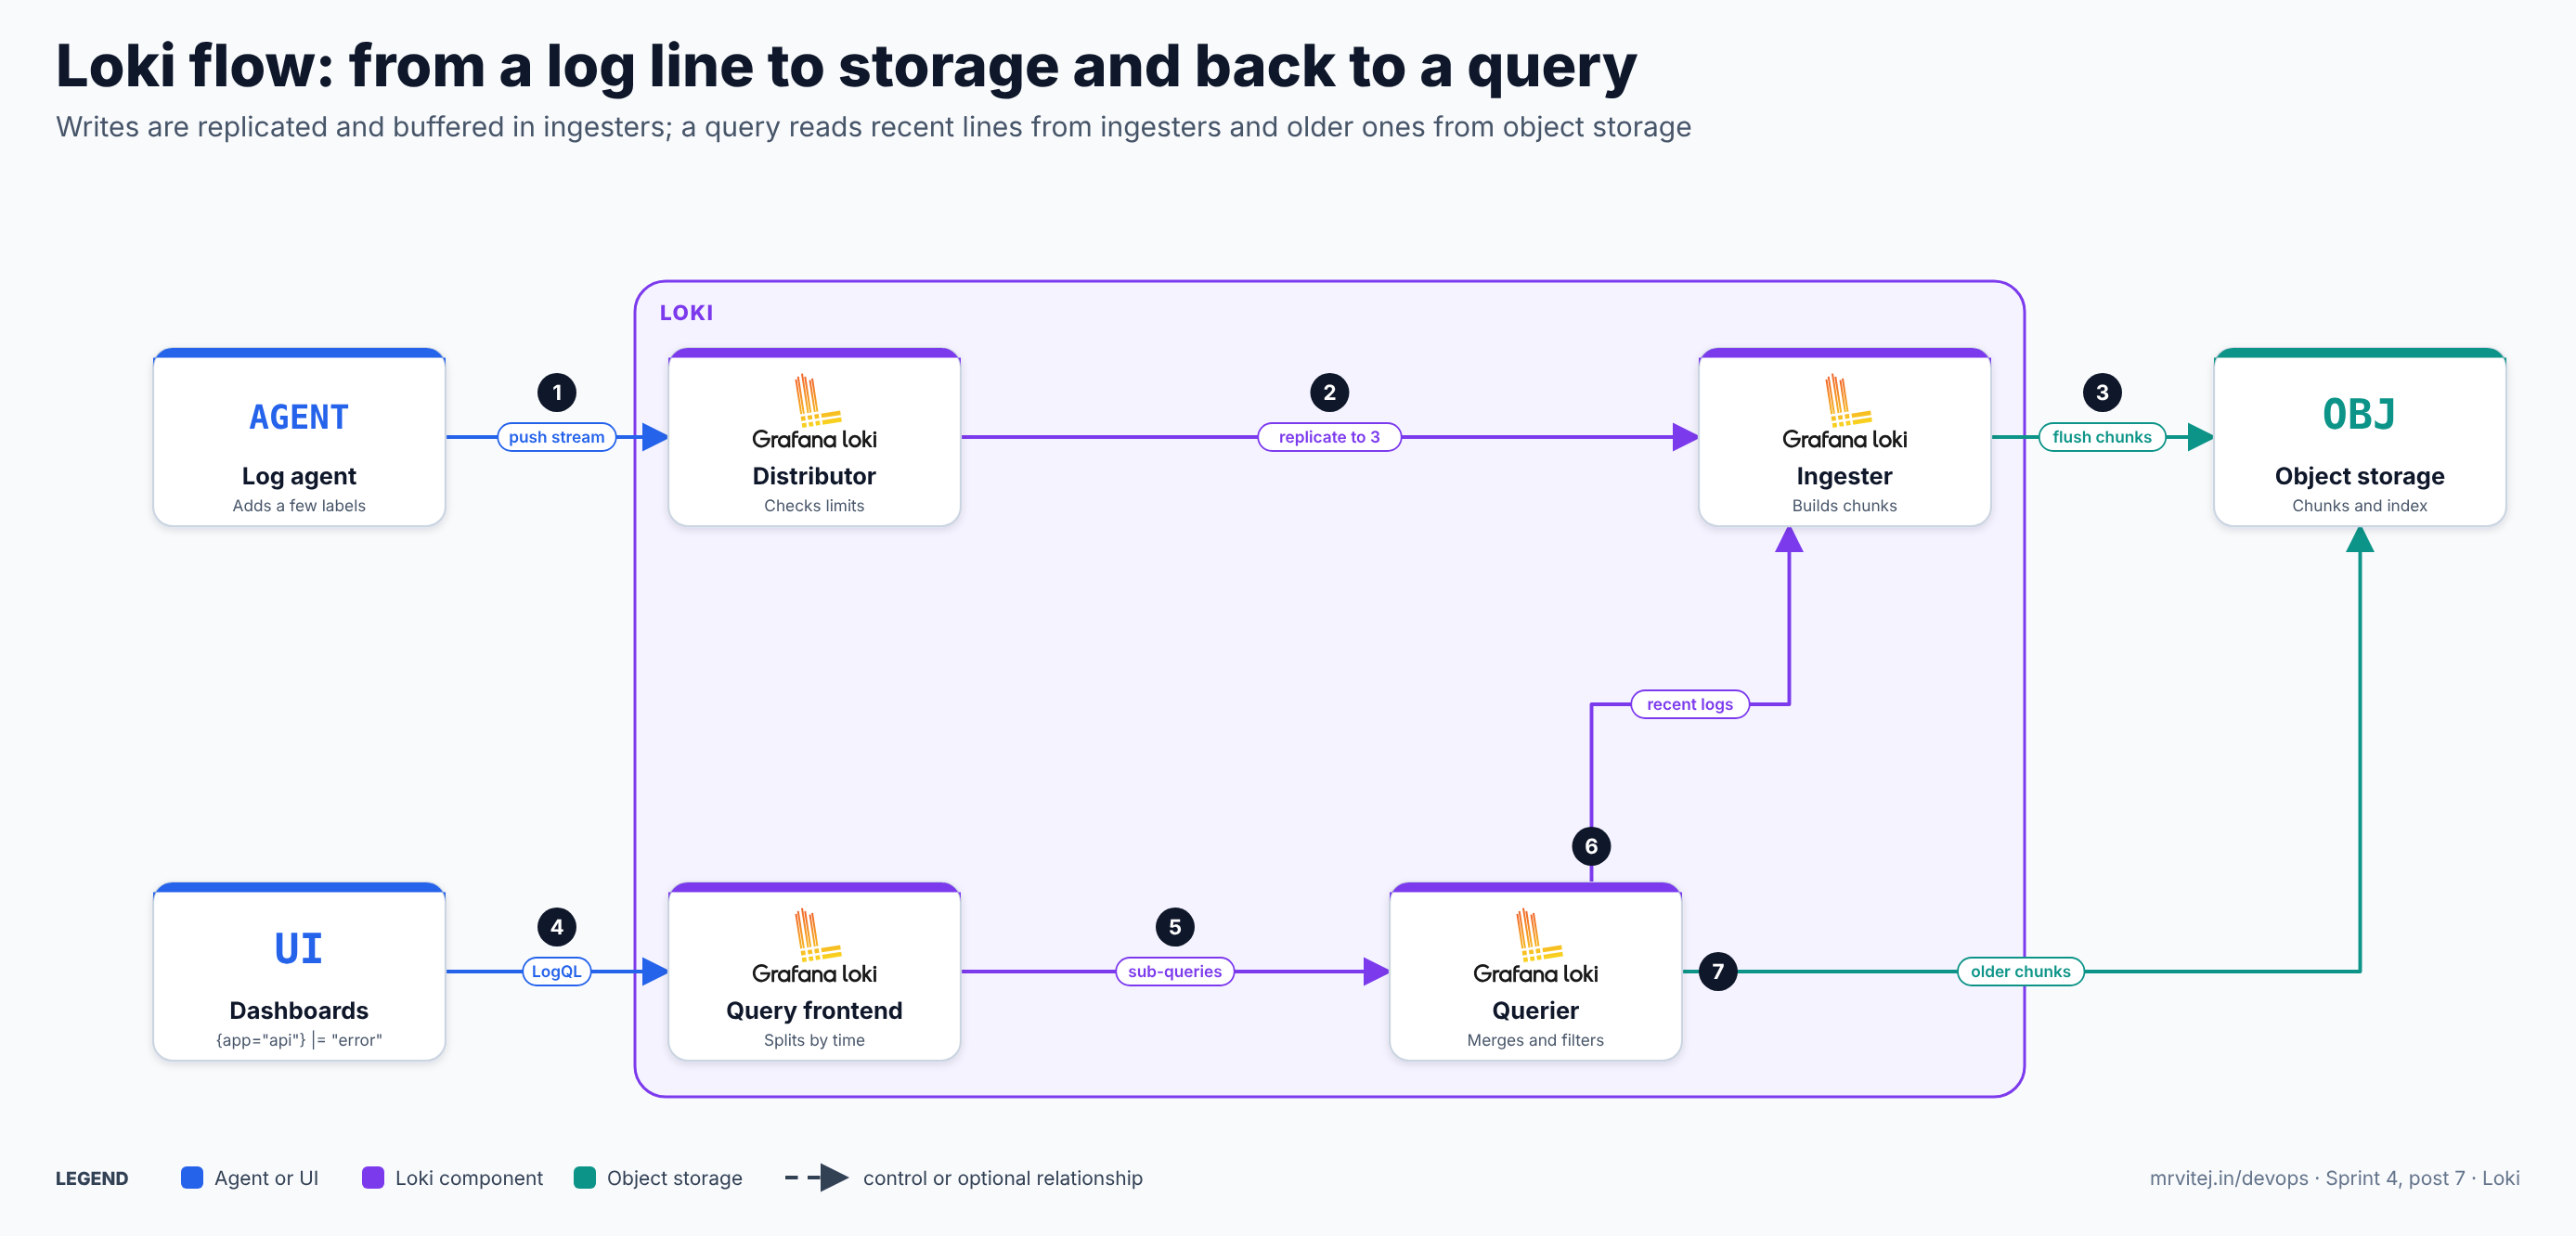
- Push. The agent reads a container log, attaches a few labels (cluster, namespace, app) and pushes the stream to the distributor over HTTP.
- Replicate. The distributor checks limits and sends the stream to the ingesters that own it on the ring, usually three replicas.
- Flush. Each ingester appends lines to the stream’s in-memory chunk and its write-ahead log, and flushes full or idle chunks, with their index entries, to object storage.
- Query. Someone runs a LogQL query in Grafana, and the query frontend receives it.
- Split. The frontend splits the time range into pieces, uses cached results where it can, and hands the pieces to queriers.
- Recent data. Each querier asks ingesters for lines not yet flushed.
- Older data. It also reads the index to find matching chunks in object storage, fetches and filters them, and returns the merged result.
Recap: labels choose the chunks, the query filters the lines, and the object store is where the data lives.
Labels, structured metadata and cardinality
This is the part that decides whether a Loki installation works. Every unique combination of label values is a separate stream, each with its own chunks, index entries and memory in an ingester. Loki was built for a small number of long-lived streams, not for high-cardinality labels.
- Good labels are stable and low-cardinality:
cluster,namespace,app,container,environment,level(if the log levels are few). - Bad labels have many values: user IDs, request IDs, trace IDs, IP addresses, timestamps, full URLs, pod UIDs. A label with 100,000 values multiplies the stream count by 100,000.
- Put high-cardinality values in structured metadata, or leave them in the log line and filter at query time with
| json | user_id="12345". - Limits protect you. By default a tenant is limited to 5,000 active streams globally (
max_global_streams_per_user); “active” means a stream that has received lines withinchunk_idle_period, 30 minutes by default. Even for hundreds of terabytes a day, the project advises against going beyond about 300,000. Do not raise the limit to make a cardinality problem disappear: it creates huge numbers of tiny chunks and slow queries. - Other limits that matter:
max_line_size(256 KB by default), ingestion rate limits (a429response means the tenant is over its rate), andreject_old_samples_max_age(lines older than it are rejected, which bites when an agent replays old logs).
limits_config:
  allow_structured_metadata: true
  volume_enabled: true
  max_global_streams_per_user: 10000
  max_label_names_per_series: 15
  reject_old_samples_max_age: 168h
Alert on discarded data, because Loki rejects over-limit data and counts it in loki_discarded_samples_total and loki_discarded_bytes_total by reason.
LogQL by example
A LogQL query always starts with a stream selector, and everything after it filters or transforms what the selector chose.
# All lines of one app in one namespace
{namespace="shop", app="api"}

# Lines containing "error" but not "timeout" (cheap line filters first)
{namespace="shop", app="api"} |= "error" != "timeout"

# JSON logs: parse, then filter on a field
{namespace="shop", app="api"} | json | level="error" | status_code >= 500

# logfmt logs and a duration filter
{app="api"} | logfmt | duration > 2s

# Reformat lines for reading
{app="api"} | json | line_format "{{.level}} {{.msg}}"

# Pattern parser (Loki 3 also has a fast pattern match operator)
{app="nginx"} | pattern `<ip> - - [<_>] "<method> <path> <_>" <status> <size>`
Metric queries turn logs into numbers, which is what dashboards and alerts use:
# Error lines per second by app
sum by (app) (rate({namespace="shop"} |= "error" [5m]))

# Error ratio as a percentage
sum(rate({app="api"} | json | level="error" [5m]))
  / sum(rate({app="api"}[5m])) * 100

# p99 latency from a numeric field in the log line
quantile_over_time(0.99,
  {app="api"} | json | __error__="" | unwrap duration_ms [5m]) by (route)

# Top 10 noisiest apps
topk(10, sum by (app) (rate({cluster="prod"}[5m])))

# Fire when an app has stopped logging
absent_over_time({app="api"}[10m])
Two habits keep queries fast: put the most selective labels in the selector, and apply line filters (|=) before parsers (| json), because a filter that discards a line is far cheaper than parsing it.
Install and first run
Docker, one process
For a first look, run the single binary with its sample configuration and a Grafana beside it:
docker run --name loki -d -p 3100:3100 grafana/loki:3.7.4
curl -s localhost:3100/ready
Push a line by hand to see the API shape:
curl -s -H "Content-Type: application/json" -X POST localhost:3100/loki/api/v1/push \
  --data-raw '{"streams":[{"stream":{"app":"demo"},"values":[["'$(date +%s%N)'","hello loki"]]}]}'
Helm on Kubernetes
The chart is now maintained by the community in grafana-community/helm-charts, not in the Loki repository, and its numbering has changed (a major chart version signals breaking changes), so read its upgrade notes:
helm repo add grafana-community https://grafana-community.github.io/helm-charts
helm repo update
helm install loki grafana-community/loki -n logging --create-namespace -f values.yaml
The documentation’s quick start uses a built-in MinIO for storage, but that subchart is deprecated and was scheduled for removal on 31 October 2026, and newer chart versions need an explicit ignoreMinioDeprecation: true to render it. Use it only for a local test. For anything real, use cloud object storage as below.
Production reference design on Kubernetes with Google Cloud Storage
- Use distributed mode (
deploymentMode: Distributedin the chart) for production, sized by component. Simple scalable still works but is on its way out. - Create separate buckets for chunks, for ruler rules and for admin data, in the same region as the cluster, with uniform bucket-level access and no public access. Do not use the chart’s default bucket names.
- Authenticate with GKE Workload Identity, not a downloaded key: bind the Loki Kubernetes service account to a Google service account that has object read and write on those buckets only.
- Run three ingesters with replication factor 3, spread across zones, with a persistent volume for each write-ahead log.
- Run the compactor as a StatefulSet with a persistent volume for its marker files, because retention depends on it.
- Turn on caching (the chart can deploy a chunks cache and a results cache) and an index gateway so queriers do not re-read the index.
- Put an authenticating gateway in front of Loki and keep the Loki API off any public network (see Security).
- Ship logs with Alloy, shape labels at the agent, and monitor Loki itself.
A values file for this layout. The structure follows the chart’s documented keys; confirm exact names against the values reference for the chart version you install:
deploymentMode: Distributed

loki:
  auth_enabled: true
  schemaConfig:
    configs:
      - from: "2024-04-01"
        store: tsdb
        object_store: gcs
        schema: v13
        index:
          prefix: loki_index_
          period: 24h
  storage:
    type: gcs
    bucketNames:
      chunks: example-loki-chunks
      ruler: example-loki-ruler
      admin: example-loki-admin
  limits_config:
    retention_period: 744h          # 31 days, global default
    max_query_lookback: 744h
    allow_structured_metadata: true
    volume_enabled: true
    max_global_streams_per_user: 10000
  compactor:
    retention_enabled: true
    delete_request_store: gcs
    working_directory: /data/retention
    retention_delete_delay: 2h
  commonConfig:
    replication_factor: 3

serviceAccount:
  annotations:
    iam.gke.io/gcp-service-account: loki@PROJECT_ID.iam.gserviceaccount.com

ingester:
  replicas: 3
  zoneAwareReplication:
    enabled: true
distributor:
  replicas: 3
querier:
  replicas: 3
queryFrontend:
  replicas: 2
queryScheduler:
  replicas: 2
compactor:
  replicas: 1
indexGateway:
  replicas: 2

minio:
  enabled: false
The equivalent plain Loki configuration for the storage and retention parts, which is the shape the project’s own retention documentation shows for a 28-day GCS example:
schema_config:
  configs:
    - from: 2024-04-01
      store: tsdb
      object_store: gcs
      schema: v13
      index:
        prefix: loki_index_
        period: 24h

storage_config:
  tsdb_shipper:
    active_index_directory: /loki/index
    cache_location: /loki/index_cache
  gcs:
    bucket_name: example-loki-chunks

limits_config:
  retention_period: 672h
  max_query_lookback: 672h

compactor:
  working_directory: /data/retention
  delete_request_store: gcs
  retention_enabled: true
  retention_delete_delay: 2h
Retention
Retention is the compactor’s job, and by default it is off, so logs live forever. Rules to remember:
compactor.retention_enabled: trueand adelete_request_storeare both required.- Retention only works with a 24-hour index period, which is what the TSDB schema above uses.
limits_config.retention_periodis the global default, andretention_streamlets you set a different period for streams matched by a label selector, per tenant or globally. Only label matchers are allowed in the selector, not full LogQL.
limits_config:
  retention_period: 744h
  retention_stream:
    - selector: '{namespace="dev"}'
      priority: 1
      period: 168h
    - selector: '{app="audit"}'
      priority: 2
period: 8760h- Chunks are marked, then deleted asynchronously after
retention_delete_delay. Setmax_query_lookbackno longer than the retention period so queries do not look for data that is gone. - If you also set a lifecycle rule on the bucket, make its age longer than the Loki retention, or the object store will delete chunks that Loki still thinks exist.
- The compactor should be stateful with a persistent volume for its marker files; recent releases can also keep markers in object storage with
deletion_marker_object_store_prefix.
Shipping logs
Grafana Alloy
Alloy is Grafana’s collector, and its Loki components collect Kubernetes pod logs, reshape labels and write to Loki:
discovery.kubernetes "pods" {
  role = "pod"
}

discovery.relabel "pod_logs" {
  targets = discovery.kubernetes.pods.targets

  rule {
    source_labels = ["__meta_kubernetes_namespace"]
    target_label  = "namespace"
  }
  rule {
    source_labels = ["__meta_kubernetes_pod_label_app"]
    target_label  = "app"
  }
  rule {
    source_labels = ["__meta_kubernetes_pod_container_name"]
    target_label  = "container"
  }
}

loki.source.kubernetes "pod_logs" {
  targets    = discovery.relabel.pod_logs.output
  forward_to = [loki.process.pod_logs.receiver]
}

loki.process "pod_logs" {
  stage.static_labels {
    values = { cluster = "prod-1" }
  }
  forward_to = [loki.write.default.receiver]
}

loki.write "default" {
  endpoint {
    url       = "http://loki-gateway.logging.svc/loki/api/v1/push"
    tenant_id = "platform"
  }
}
Only three or four labels are created (namespace, app, container, plus the static cluster). Pod names and UIDs are deliberately not turned into labels. Alloy can also drop noisy lines, sample high-volume streams and rate-limit before data reaches Loki.
Fluent Bit
If you already run Fluent Bit, which is a sub-project of Fluentd (covered in the Fluentd brief), its built-in loki output sends to the same endpoint:
[OUTPUT]
    Name                   loki
    Match                  kube.*
    Host                   loki-gateway.logging.svc
    Port                   80
    Tenant_ID              platform
    Labels                 job=fluentbit, cluster=prod-1
    Label_Keys             $kubernetes['namespace_name'],$kubernetes['container_name']
    Remove_Keys            kubernetes,stream
    Line_Format            json
Be careful with auto_kubernetes_labels On: it adds every Kubernetes label to the stream labels, which can explode cardinality. Choose labels explicitly with Labels and Label_Keys. Note that Grafana also publishes a separate Go output plugin for Fluent Bit with different options; the built-in one above is the simpler choice.
Promtail, the older Loki agent, was deprecated in Loki 3.0 and removed in 3.7.3, so new installations use Alloy or another collector. OpenTelemetry collectors can also send logs to Loki through its OTLP endpoint.
Alerting with the ruler
The ruler evaluates rules written in LogQL, in the same file format as Prometheus rules, and sends firing alerts to an Alertmanager. Recording rules can write the resulting metric to a Prometheus-compatible store with remote write.
ruler:
  storage:
    type: gcs
    gcs:
      bucket_name: example-loki-ruler
  rule_path: /tmp/rules
  alertmanager_url: http://alertmanager.monitoring.svc:9093
  enable_api: true
  ring:
    kvstore:
store: memberlistgroups:
- name: app-logs
interval: 1m
rules:
- alert: HighErrorRatio
expr: |
sum by (app) (rate({namespace="shop"} | json | level="error" [5m]))
/
sum by (app) (rate({namespace="shop"}[5m])) > 0.05
for: 10m
labels:
severity: page
annotations:
summary: "More than 5% of log lines from {{ $labels.app }} are errors"
- alert: AppStoppedLogging
expr: absent_over_time({namespace="shop", app="api"}[10m])
for: 5m
labels:
severity: warn
- record: shop:log_lines:rate1m
expr: sum by (app) (rate({namespace="shop"}[1m]))Load rules through the ruler API or the lokitool command, keep the rule files in Git, and prefer alerts on rates and ratios over alerts on a single line. Alerting on a high-cardinality source is expensive, so keep the selector narrow.
Security
- Loki has no authentication. It trusts the
X-Scope-OrgIDheader. Run an authenticating reverse proxy or gateway (NGINX with basic auth, an OAuth2 proxy, or an API gateway) in front of it, and have that proxy set the tenant header from the authenticated identity. The project’s own documentation warns never to expose the Loki API directly, because a client that can reach it can set the tenant header itself and bypass tenant isolation, including label-based access control. - Tenants are the isolation boundary. Use one tenant per team or per environment, with
auth_enabled: true(the default). With it off, everything goes to a single tenant calledfake. Per-tenant limits and retention can differ. - Protect the object store. Whoever can write to the bucket can change or delete your logs, whatever Loki does. Use a dedicated bucket, narrow IAM, Workload Identity, uniform access, audit logging on the bucket, and no human write access.
- Encrypt in transit between agents, the gateway and Loki, and between Loki and storage, and use customer-managed encryption keys on the bucket if policy requires it.
- Mind what you log. Loki stores whatever it is sent, including secrets and personal data that applications print. Scrub at the agent, and set retention with data protection rules in mind. A delete API (
deletion_mode: filter-and-delete) exists for removing data on request; restrict it. - Keep it patched. Loki’s release notes list regular dependency and CVE fixes, so track the 3.7 patch line.
Loki does not make logs tamper-proof
State this plainly in any design review: Loki alone does not provide tamper-proof logs. It stores what it receives and offers no signing, no hash chain, no write-once guarantee and no proof that a line has not been altered, dropped or backdated. A user with access to the bucket, the compactor, the delete API or the ingest path can change what the logs say. Retention deletion, compaction and re-writing of index files are normal operations. If logs must serve as evidence, for audit or for regulation, add controls around Loki:
- Send a second copy of the relevant logs to a write-once archive. In Google Cloud Storage that means a separate bucket with a retention policy and bucket lock, so objects cannot be deleted or changed until the retention age passes. Do not put the bucket Loki itself uses under a locked retention policy, because Loki’s compactor deletes and rewrites objects, and those operations would be refused.
- Sign or hash log batches at the source or in the pipeline, and store the digests somewhere separate with its own access control.
- Separate duties: the people who operate Loki should not be able to delete the archive, and the archive’s audit trail should be reviewed.
- Restrict clock changes and monitor for gaps with
absent_over_timeand ingestion-rate alerts.
Monitoring and day-2 operations
Loki exposes Prometheus metrics on every component, and Grafana publishes a meta-monitoring Helm chart for monitoring a Loki deployment, plus the Loki Canary, which writes and reads known lines to measure end-to-end latency and loss. Metrics worth alerting on:
| Metric | What it tells you |
|---|---|
loki_distributor_bytes_received_total, loki_distributor_lines_received_total |
Ingest volume |
loki_discarded_samples_total, loki_discarded_bytes_total |
Data rejected, by reason (rate limit, stream limit, line too long, too old) |
loki_ingester_memory_streams, loki_ingester_memory_chunks |
Active streams and chunks in ingester memory, the cardinality signal |
loki_ingester_chunks_flush_failures_total |
Flush failures to object storage; should stay at zero |
loki_ingester_flush_queue_length |
Backlog of chunks waiting to flush |
loki_request_duration_seconds |
Request latency by route |
loki_query_scheduler_queue_duration_seconds |
Time queries wait for a querier |
loki_ring_members |
Ring health; unhealthy members should be zero |
loki_compactor_apply_retention_last_successful_run_timestamp_seconds |
The last time retention succeeded |
loki_tsdb_build_index_last_successful_timestamp_seconds |
Index builds are keeping up |
loki_ruler_config_last_reload_successful |
Rules loaded correctly |
Operational habits that pay off:
- Rollouts. Ingesters hold state, so roll them one at a time, zone by zone, and let the write-ahead log replay. Scaling ingesters can temporarily cause
stream_limiterrors that are not a real cardinality problem; check recent rollouts before raising limits. - Query cost. Set limits on query range, parallelism and returned entries, give heavy users their own tenant or limits, and use the query scheduler for fairness.
- Schema changes. Add a new
schema_configperiod with a futurefromdate instead of editing the old one, so existing data stays readable. - Upgrades. Read the upgrade guide for each minor release; Loki 3.0 removed BoltDB and other deprecated options, 3.7.3 removed Promtail, and the Helm chart moved repositories in March 2026.
- Cost. Object storage and egress dominate. Compress well, keep labels few, drop noisy debug logs at the agent, and set retention per stream.
Usage cases
- Kubernetes cluster logging with logs next to metrics and traces in Grafana, searched by namespace and app.
- Logs to metrics. Turn error lines into rates, ratios and latency percentiles for dashboards and alerts.
- Long retention on a budget. Keep weeks or months of logs in object storage where a full-text index would be too costly.
- Multi-team platforms. One shared Loki with a tenant, limits and retention per team.
- Application debugging with labels to narrow the stream and LogQL filters to find the lines.
In the Sprint 4 final project, a pharmaceutical plant’s platform and application logs are collected in Loki on Google Cloud Storage.
Version and project status
Loki began at Grafana Labs in 2018 and reached 1.0 in November 2019. Version 3.0 made TSDB with schema v13 the default, added structured metadata and a native OTLP endpoint, deprecated BoltDB and removed other old options. The 3.x line now includes a Troubleshooting section in the documentation, the pattern match operator, and work on a new object-based storage engine that appears in the changelogs as “dataobj”. The project’s governance and release cadence are documented on the Loki site. Three changes to plan around: Promtail is gone from 3.7.3, simple scalable mode will be deprecated before 4.0, and the Helm chart now lives in the community repository, where its major version numbers mark breaking chart changes. As a Grafana Labs project under AGPLv3, it is open source, but the licence’s network-use terms matter if you modify Loki and offer it as a service, so involve your legal team.
Adoption
Grafana Labs runs Loki as the logs back end of its Grafana Cloud service and sells Grafana Enterprise Logs, and Loki is a component in other distributions: Canonical’s observability stack, for example, documents Loki as one of its components. I did not verify a list of named end-user adopters from an official source, so I name none; ask Grafana Labs or the community for references that fit your size and industry.
Alternatives
| Solution | Model | Best suited to |
|---|---|---|
| Elasticsearch or OpenSearch | Full-text index on every line | Rich full-text search and analytics over logs and documents, with the cost and operation that implies |
| ClickHouse-based log stores | Columnar database for logs | Very high-volume log analytics with SQL |
| VictoriaLogs | Log database from the VictoriaMetrics family | Teams already using VictoriaMetrics who want a simple log store |
| Google Cloud Logging | Managed logging service | Teams that want no log back end to operate on Google Cloud |
| Splunk and commercial platforms | Hosted or licensed log platforms | Organisations that want a vendor product with support |
| Fluentd and Fluent Bit | Collectors, not stores | Shipping and routing logs to Loki or any other back end |
Strengths and limitations
| Strengths | Limitations |
|---|---|
| Indexes only labels, so storage and ingestion are cheap | Queries scan chunks, so broad full-text searches over long ranges can be slow |
| Uses object storage for the data, with no large database to run | Cardinality discipline is mandatory; bad labels hurt quickly |
| LogQL turns logs into metrics and alerts, with a built-in ruler | No built-in authentication; you must add a gateway |
| Multi-tenant with per-tenant limits and retention | AGPLv3, and deployment modes and charts are changing (simple scalable deprecated, chart moved) |
| Tight integration with Grafana, Prometheus and traces | Not tamper-proof; evidence-grade logging needs extra controls |
Recommendation
Adopt for Kubernetes platforms that want affordable, label-based log search next to Prometheus and Grafana. Start in distributed mode on object storage with replication factor 3, define a short, stable label set at the agent, cap streams per tenant, set retention in the compactor, put an authenticating gateway in front, and monitor discards, flush failures and ring health. If you need evidence-grade logs, add a locked archive bucket and source-side signing, because Loki alone will not give you that. If your main need is heavy full-text search across everything, or your licensing rules rule out AGPL, use a different back end.
References: Loki documentation · Loki release notes · Retention · Simple scalable Helm install and chart move · Multi-tenancy · Label-based access control and the security model · Alerting and recording rules · Troubleshoot ingestion · LogQL query examples · Collect Kubernetes logs with Alloy · Fluent Bit Loki output · Loki on GitHub · CNCF Landscape entry