This is Part 2 of the five-part build in the Sprint 4 project overview. Part 1 left you with a Google Cloud foundation, an edge k3s cluster with Cilium, and Akri discovering a stub. This part builds the whole machine-to-cloud path: simulated machines on signed and encrypted OPC UA, Akri finding them, Telegraf reading their tags, EMQX as the edge broker, and an outbound-only bridge to Pub/Sub. It ends with a test that cuts the link, restores it, and checks that the buffered data arrived in order.
What this is and is not. This is engineering guidance, not legal or regulatory advice, and nothing here is validated or compliant on its own. I wrote every file from the tool briefs and current official documentation. I did not run any of it against a live cluster or Google Cloud project. The section “What I could not test” lists every gap, and one of them matters for the headline claim: the EMQX sink buffer is not documented to survive an EMQX restart, so the outage test proves a link outage, not a broker crash.
What you build
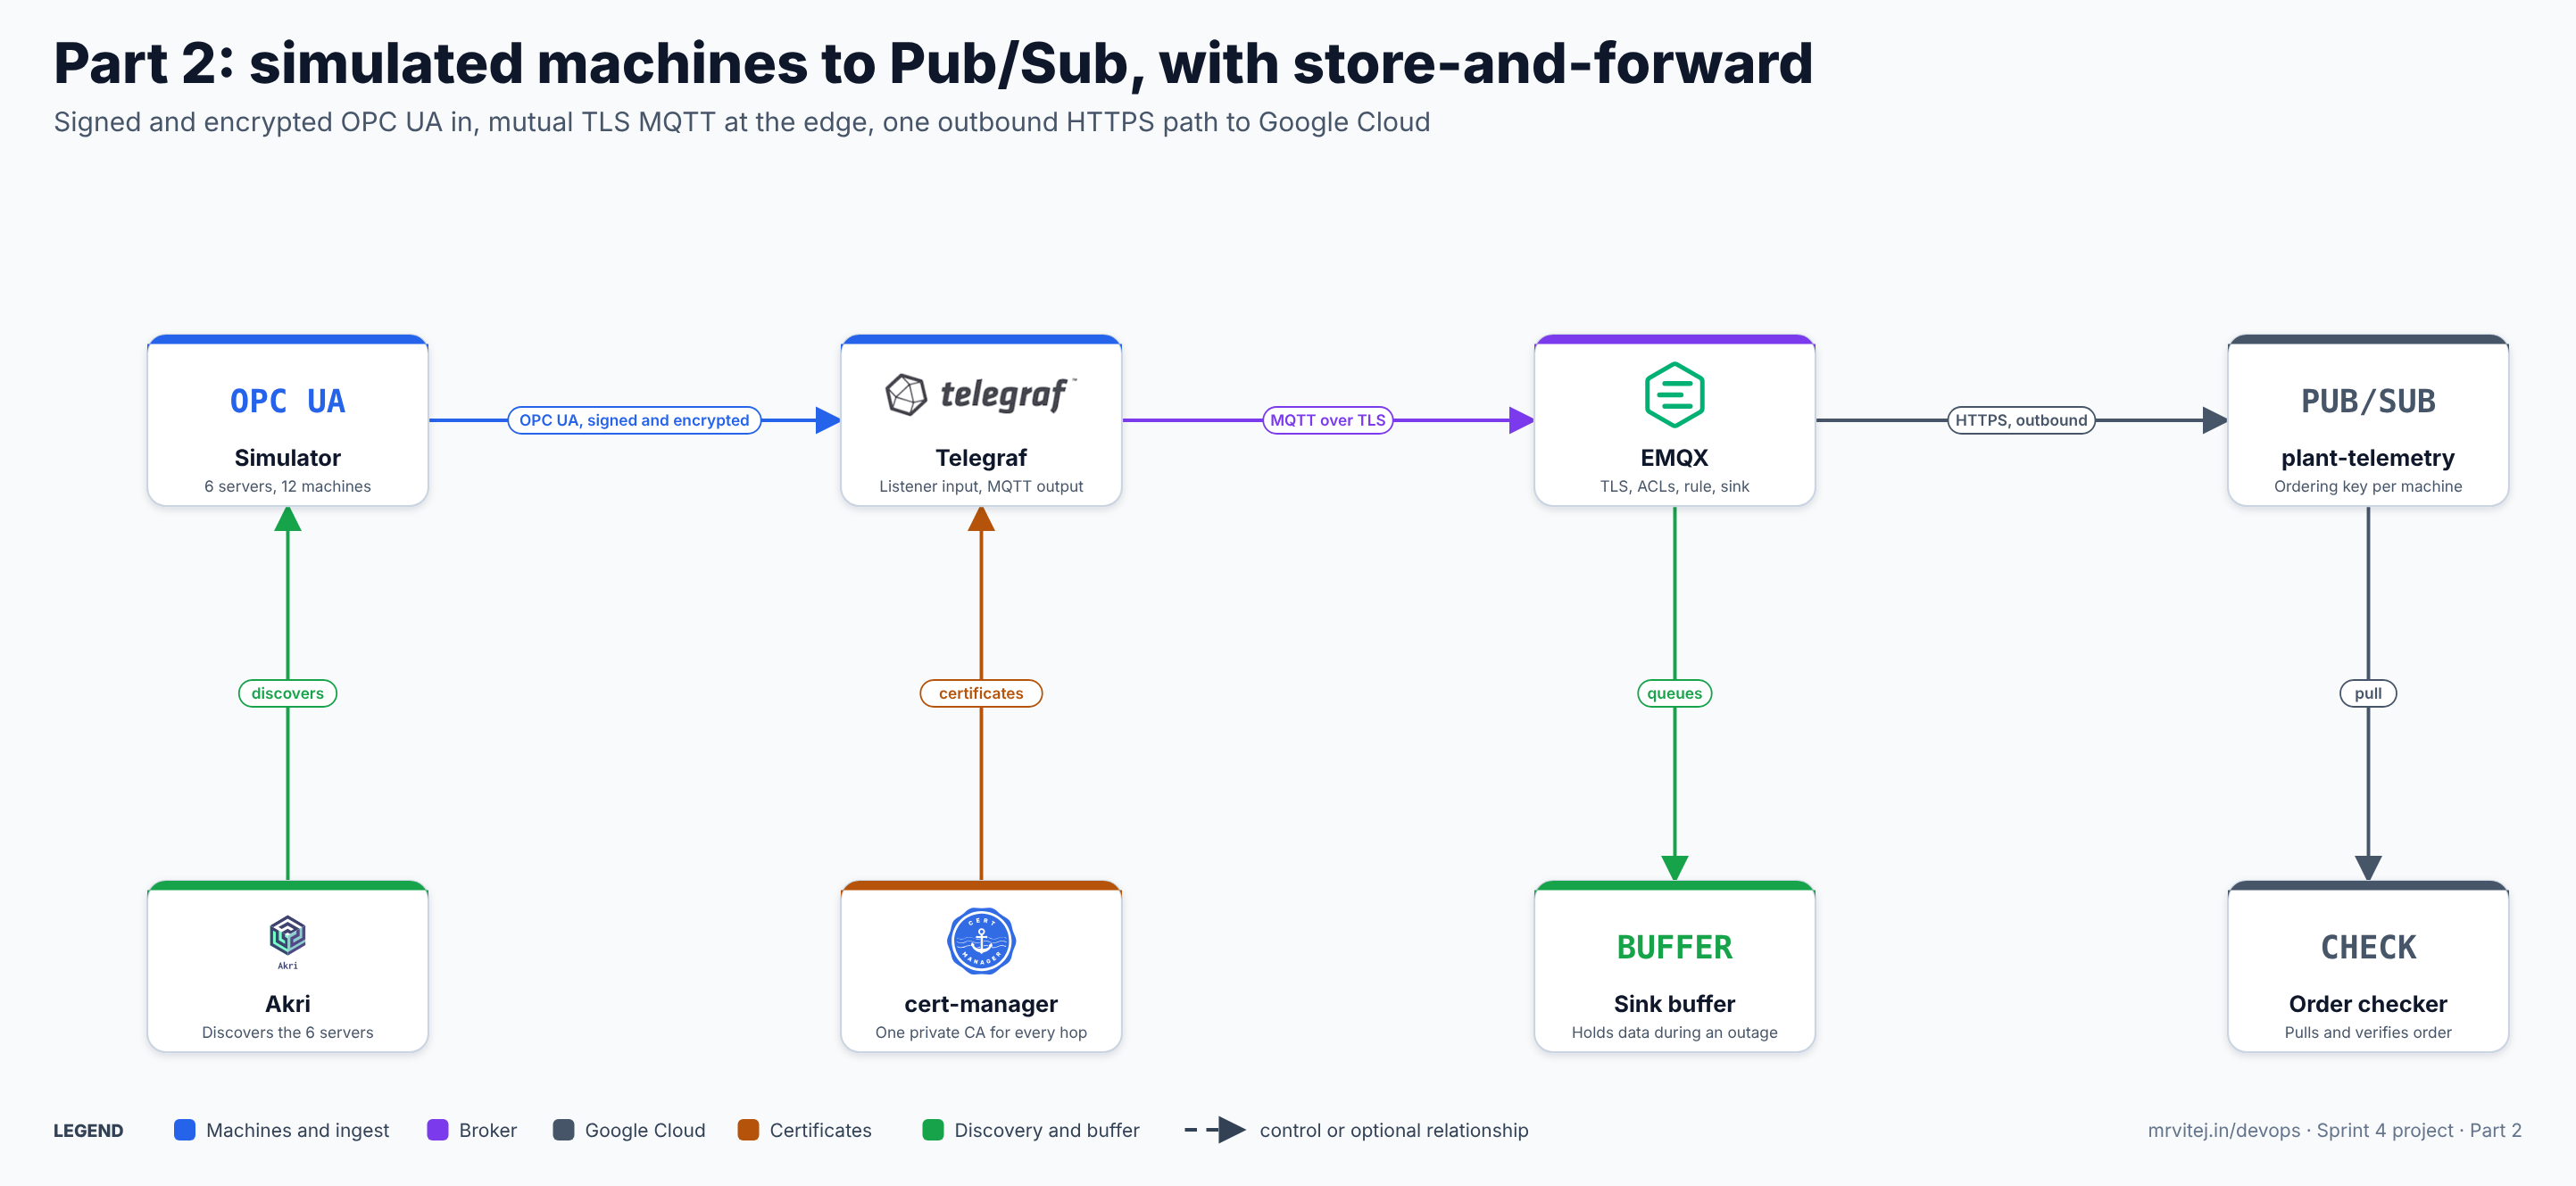
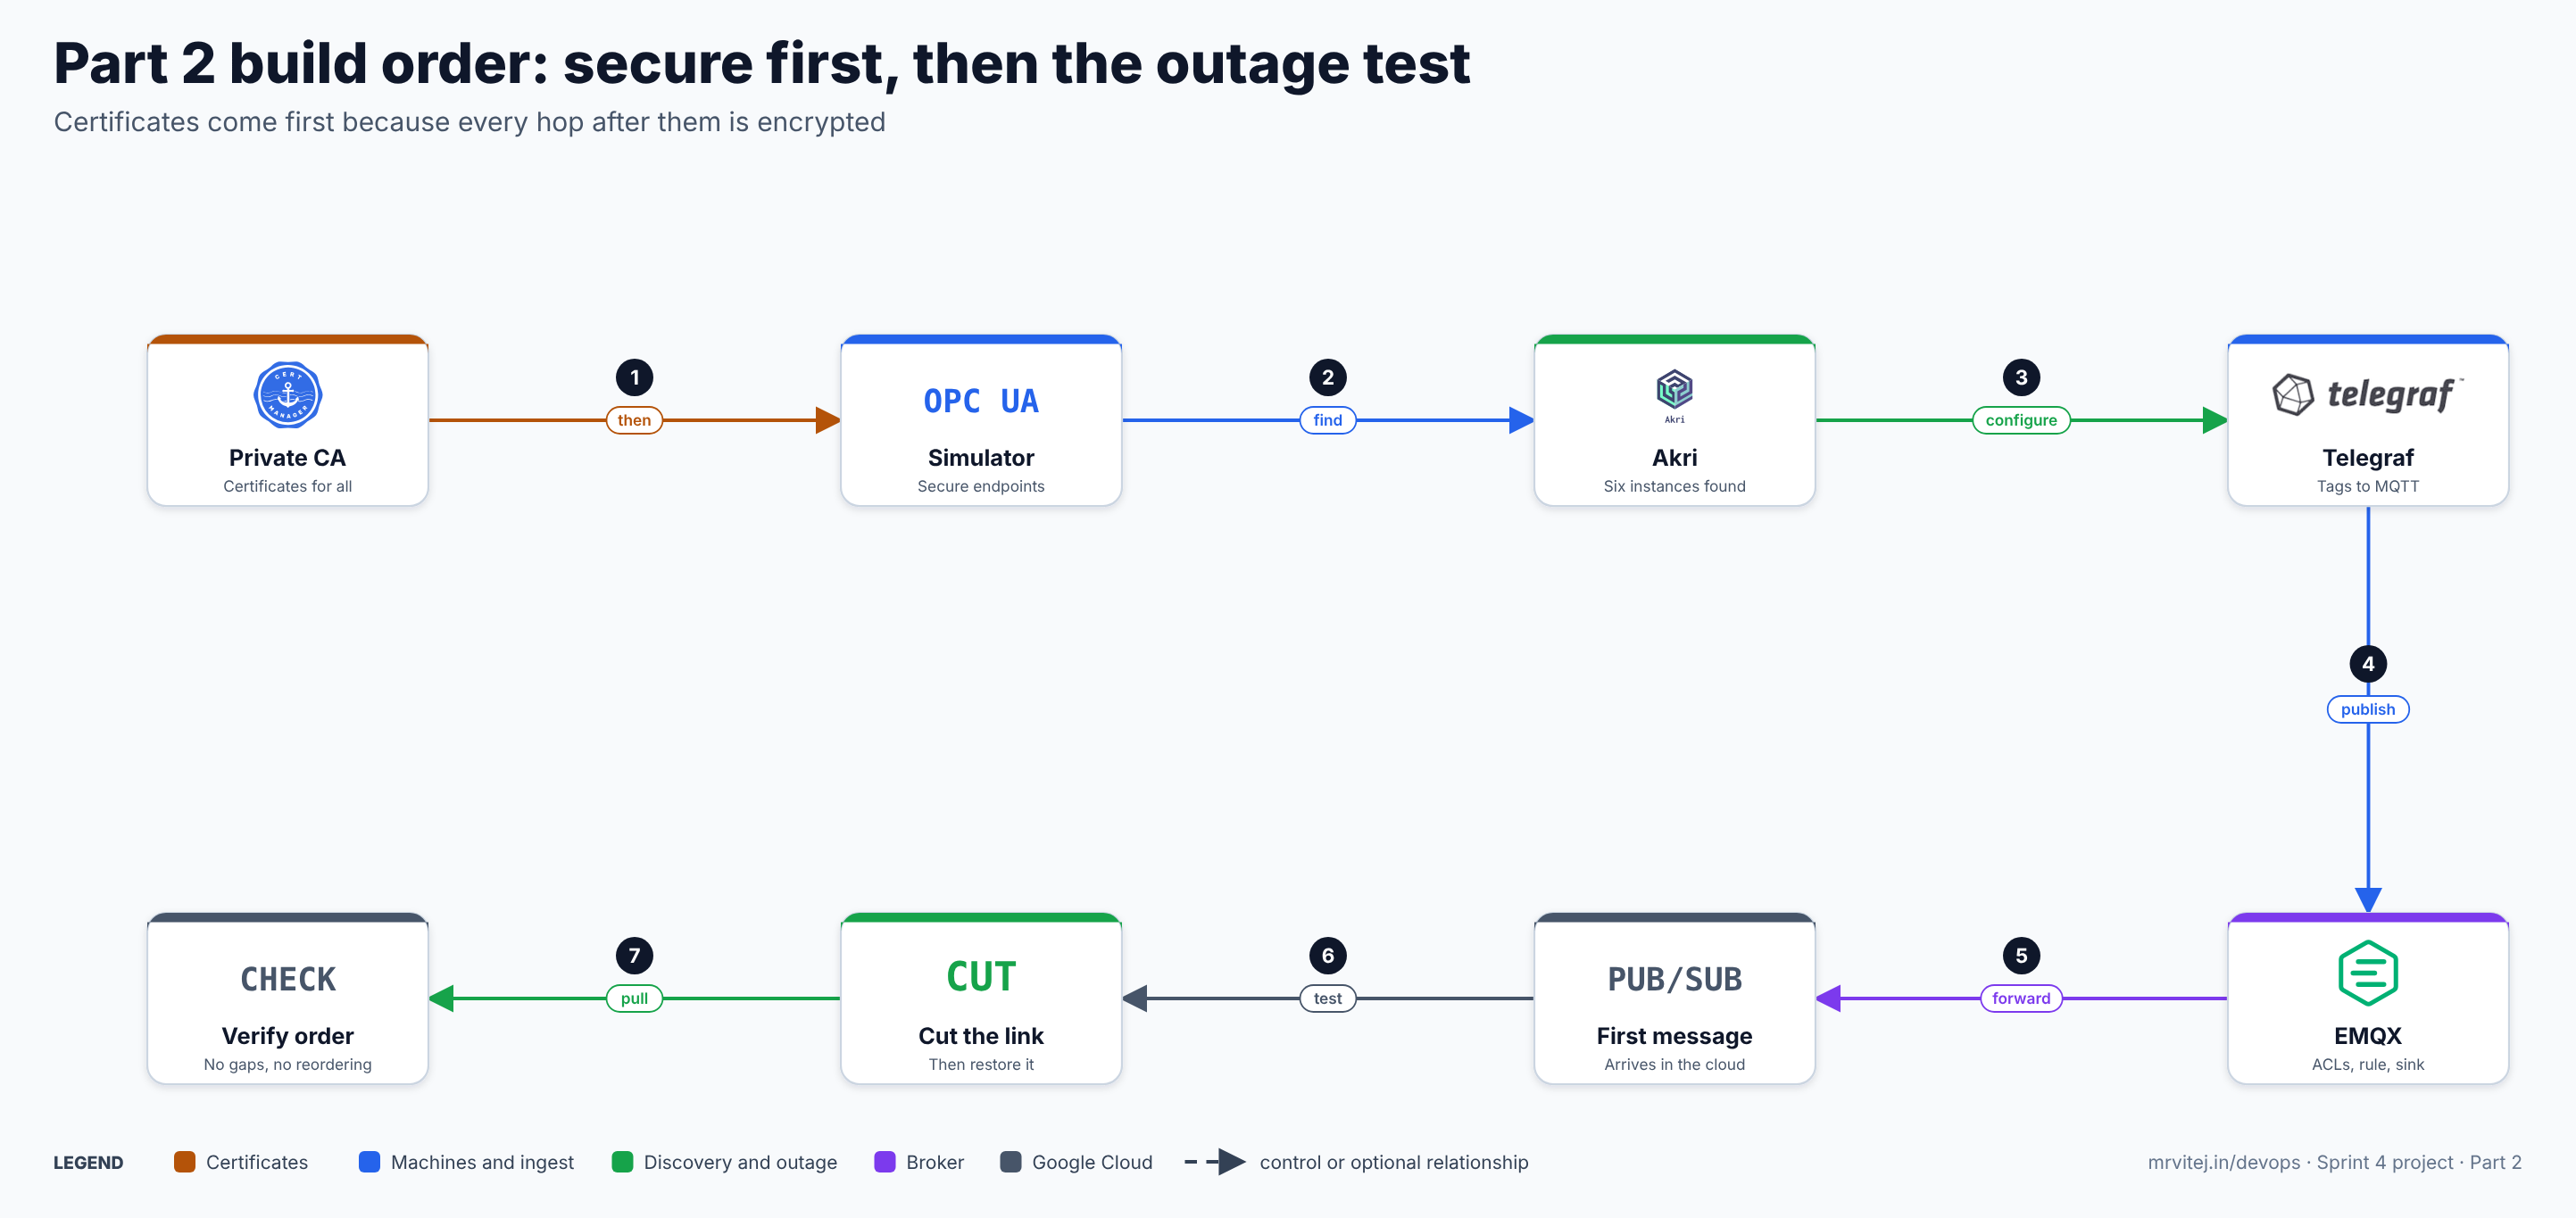
The sections:
- Prerequisites and versions
- One pull request for the cloud side (a test subscription)
- A private CA with cert-manager
- The OPC UA simulator
- Akri discovery of the simulated servers
- Telegraf: OPC UA in, MQTT out
- EMQX at the edge: TLS, ACLs, topics, persistence
- The bridge to Pub/Sub, with a buffer
- The link-outage test
- Troubleshooting, cost, cleanup and what I could not test
1. Prerequisites and versions
| Item | Version | Source |
|---|---|---|
| Part 1 complete | Checkpoints 1 to 8 passed; plant-edge-1 is reachable over IAP |
Part 1 |
| k3s with Cilium | Whatever Part 1 installed; record k3s --version |
Part 1 |
| Akri | v0.14.0 chart, already installed in the default namespace by Part 1 |
Akri brief |
| cert-manager | 1.21 line; I did not confirm a patch version, so run helm search repo or check the release page |
cert-manager brief |
| asyncua | ~=1.1 (the overview noted 1.1.8 as the newest I found on conda-forge; I did not read the PyPI page) |
overview |
| Telegraf | v1.40.2 (12 October 2026) | Telegraf brief |
| EMQX | 6.3.1, image emqx/emqx-enterprise:6.3.1. One node is free for production under the BSL licence; a cluster needs a commercial licence |
EMQX brief |
| Python on the laptop | 3.10 or newer, with google-cloud-pubsub |
the checker in section 9 |
| Tools on the edge VM | kubectl, helm, gettext-base (for envsubst), mosquitto-clients, jq, openssl |
below |
On the edge VM (over IAP SSH, as in Part 1):
sudo apt-get update && sudo apt-get install -y gettext-base mosquitto-clients jq openssl
kubectl version --client
Delete the Part 1 stub first; it is replaced by the real simulator:
kubectl delete namespace akri-checkKeep these files in the edge/ directory of your repository. This part adds:
edge/
  ca.yaml                    cert-manager CA
  ot-sim/model.json          the plant model: machines, tags, ranges
  ot-sim/server.py           the asyncua simulator
  ot-sim/template.yaml       one Deployment, Service and Certificate per server
  akri-values.yaml           (replaces the Part 1 file)
  telegraf/gen_telegraf.py   generates the Telegraf config from model.json
  telegraf/telegraf.yaml     Telegraf Deployment and certificates
  emqx/emqx.yaml             EMQX StatefulSet, config, ACLs, certificates
  netpol.yaml                the flows allowed between zones
tools/check_order.py         the order and gap checker (runs on your laptop)
2. One pull request for the cloud side
The outage test needs a subscription that only the checker reads, with ordering enabled and no dead-letter topic. Pub/Sub only delivers in order when message ordering is enabled on the subscription, and when a dead-letter topic is also set, ordering is documented as best effort. So the ingest subscription from Part 1 is left alone, and a second one is added for the test.
Add to infra/platform/pubsub.tf on a new branch part-2-check-subscription:
# Subscription used only by the Part 2 order checker.
# Ordering is on; there is deliberately no dead-letter policy.
resource "google_pubsub_subscription" "telemetry_check" {
  project = var.project_cloud
  name    = "telemetry-check"
  topic   = google_pubsub_topic.telemetry.id
  labels  = local.labels

  ack_deadline_seconds       = 60
  message_retention_duration = "86400s" # one day
  enable_message_ordering    = true
}

resource "google_pubsub_subscription_iam_member" "check_user" {
  project      = var.project_cloud
  subscription = google_pubsub_subscription.telemetry_check.name
  role         = "roles/pubsub.subscriber"
  member       = "user:YOUR-GOOGLE-ACCOUNT@example.com"
}
Open the pull request, read the Atlantis plan (two resources to add, nothing else), get the approval, comment atlantis apply, and merge, exactly as in Part 1.
Checkpoint 2. gcloud pubsub subscriptions describe telemetry-check --project=$CLOUD_PROJECT --format="value(enableMessageOrdering)" prints True.
3. A private CA with cert-manager
Every hop in this part is authenticated with certificates: OPC UA servers and Telegraf, Telegraf and EMQX, and the test client and EMQX. One private CA, run by cert-manager, issues them all. A private CA is appropriate inside the plant; the keys of the CA itself are the most sensitive objects here, and in a real plant they would live in a managed key store, which I did not build.
On the edge VM:
helm install cert-manager oci://quay.io/jetstack/charts/cert-manager \
  --version v1.21.0 --namespace cert-manager --create-namespace \
  --set crds.enabled=true
kubectl -n cert-manager rollout status deployment/cert-manager-webhook
Save as edge/ca.yaml:
apiVersion: cert-manager.io/v1
kind: ClusterIssuer
metadata:
  name: plant-selfsigned
spec:
  selfSigned: {}
---
apiVersion: cert-manager.io/v1
kind: Certificate
metadata:
  name: plant-ca
  namespace: cert-manager
spec:
  isCA: true
  commonName: plant-ca
  secretName: plant-ca
  duration: 87600h        # 10 years, lab value
  privateKey:
    algorithm: RSA
    size: 2048
  issuerRef:
    name: plant-selfsigned
    kind: ClusterIssuer
---
apiVersion: cert-manager.io/v1
kind: ClusterIssuer
metadata:
  name: plant-ca
spec:
  ca:
    secretName: plant-ca
kubectl apply -f edge/ca.yaml
kubectl get clusterissuer
kubectl -n cert-manager get certificate plant-caCheckpoint 3. Both issuers show READY True and the plant-ca certificate shows READY True.
4. The OPC UA simulator
The simulator is six OPC UA servers, one per machine type, with two machines each: 12 machines. Each server serves Plant.<area>.<machine>.<tag> string node IDs in the namespace urn:plant:sim. Values come from a seeded random model with slow drift, and one machine of each type (the first) has a scheduled excursion so that Part 3 has alarms to find: 30 seconds out of range, starting 5 minutes after the server starts and repeating every 20 minutes.
The lab model has 5 tags per machine, 60 tags in total. The overview’s figure of about 240 tags needs more rows in the same table, and the generator in section 6 handles any number. The ranges are illustrative values for a demonstration; they are not specification limits for any product or process.
4.1 The model
edge/ot-sim/model.json
{
  "site": "s01",
  "excursion_start_s": 300,
  "excursion_length_s": 30,
  "excursion_period_s": 1200,
  "kinds": {
    "press": {
      "area": "compression",
      "machines": ["Press01", "Press02"],
      "excursion": { "tag": "CompressionForce", "delta": 8.0 },
      "tags": [
        { "name": "CompressionForce", "unit": "kN",  "nominal": 11.0, "noise": 0.4, "drift": 0.6, "type": "gauge" },
        { "name": "TurretSpeed",      "unit": "rpm", "nominal": 45.0, "noise": 1.0, "drift": 2.0, "type": "gauge" },
        { "name": "Vibration",        "unit": "mm/s","nominal": 2.1,  "noise": 0.2, "drift": 0.3, "type": "gauge" },
        { "name": "MainMotorCurrent", "unit": "A",   "nominal": 18.0, "noise": 0.5, "drift": 0.8, "type": "gauge" },
        { "name": "TabletCount",      "unit": "count","nominal": 8.0, "noise": 0.0, "drift": 0.0, "type": "counter" }
      ]
    },
    "dryer": {
      "area": "drying",
      "machines": ["Dryer01", "Dryer02"],
      "excursion": { "tag": "InletTemp", "delta": 14.0 },
      "tags": [
        { "name": "InletTemp",          "unit": "degC",  "nominal": 60.0,  "noise": 0.5, "drift": 1.0, "type": "gauge" },
        { "name": "ProductTemp",        "unit": "degC",  "nominal": 42.0,  "noise": 0.6, "drift": 1.5, "type": "gauge" },
        { "name": "ExhaustHumidity",    "unit": "%RH",   "nominal": 38.0,  "noise": 1.2, "drift": 2.0, "type": "gauge" },
        { "name": "AirFlow",            "unit": "m3/h",  "nominal": 1200.0,"noise": 20.0,"drift": 30.0,"type": "gauge" },
        { "name": "FilterDiffPressure", "unit": "Pa",    "nominal": 320.0, "noise": 8.0, "drift": 10.0,"type": "gauge" }
      ]
    },
    "autoclave": {
      "area": "sterilisation",
      "machines": ["Autoclave01", "Autoclave02"],
      "excursion": { "tag": "ChamberTemp", "delta": -3.0 },
      "tags": [
        { "name": "ChamberTemp",     "unit": "degC", "nominal": 121.0, "noise": 0.15, "drift": 0.2, "type": "gauge" },
        { "name": "ChamberPressure", "unit": "kPa",  "nominal": 205.0, "noise": 1.5,  "drift": 2.0, "type": "gauge" },
        { "name": "JacketTemp",      "unit": "degC", "nominal": 123.0, "noise": 0.2,  "drift": 0.3, "type": "gauge" },
        { "name": "SteamPressure",   "unit": "kPa",  "nominal": 300.0, "noise": 3.0,  "drift": 4.0, "type": "gauge" },
        { "name": "CycleSeconds",    "unit": "s",    "nominal": 1.0,   "noise": 0.0,  "drift": 0.0, "type": "counter" }
      ]
    },
    "blister": {
      "area": "packaging",
      "machines": ["Blister01", "Blister02"],
      "excursion": { "tag": "RejectCount", "rate_mult": 40.0 },
      "tags": [
        { "name": "SealTemp",        "unit": "degC",        "nominal": 160.0, "noise": 1.0, "drift": 2.0, "type": "gauge" },
        { "name": "LineSpeed",       "unit": "blisters/min","nominal": 220.0, "noise": 3.0, "drift": 5.0, "type": "gauge" },
        { "name": "FormingPressure", "unit": "bar",         "nominal": 6.0,   "noise": 0.1, "drift": 0.2, "type": "gauge" },
        { "name": "FoilTension",     "unit": "N",           "nominal": 24.0,  "noise": 0.5, "drift": 0.8, "type": "gauge" },
        { "name": "RejectCount",     "unit": "count",       "nominal": 0.05,  "noise": 0.0, "drift": 0.0, "type": "counter" }
      ]
    },
    "hvac": {
      "area": "hvac",
      "machines": ["Hvac01", "Hvac02"],
      "excursion": { "tag": "DiffPressure", "delta": -9.0 },
      "tags": [
        { "name": "DiffPressure",    "unit": "Pa",    "nominal": 12.5,   "noise": 0.4,  "drift": 0.6,  "type": "gauge" },
        { "name": "ParticleCount05", "unit": "per m3","nominal": 1800.0, "noise": 120.0,"drift": 200.0,"type": "gauge" },
        { "name": "RoomTemp",        "unit": "degC",  "nominal": 21.0,   "noise": 0.15, "drift": 0.4,  "type": "gauge" },
        { "name": "RoomRH",          "unit": "%RH",   "nominal": 45.0,   "noise": 1.5,  "drift": 2.0,  "type": "gauge" },
        { "name": "AirChangeRate",   "unit": "1/h",   "nominal": 25.0,   "noise": 0.6,  "drift": 1.0,  "type": "gauge" }
      ]
    },
    "coldstore": {
      "area": "coldstore",
      "machines": ["Cold01", "Cold02"],
      "excursion": { "tag": "Temp", "delta": 6.0 },
      "tags": [
        { "name": "Temp",              "unit": "degC", "nominal": 5.0,  "noise": 0.2, "drift": 0.5, "type": "gauge" },
        { "name": "RH",                "unit": "%RH",  "nominal": 55.0, "noise": 2.0, "drift": 3.0, "type": "gauge" },
        { "name": "DoorOpen",          "unit": "bool", "nominal": 0.0,  "noise": 0.0, "drift": 0.0, "type": "gauge" },
        { "name": "CompressorCurrent", "unit": "A",    "nominal": 6.0,  "noise": 0.3, "drift": 0.5, "type": "gauge" },
        { "name": "DefrostActive",     "unit": "bool", "nominal": 0.0,  "noise": 0.0, "drift": 0.0, "type": "gauge" }
      ]
    }
  }
}
4.2 The server
Each Pod runs one server with MACHINE_TYPE set. It loads a certificate and key, offers only the Basic256Sha256 policy in SignAndEncrypt mode, builds the address space, and writes every tag once a second.
edge/ot-sim/server.py
import asyncio
import json
import logging
import math
import os
import random
import zlib
from datetime import datetime, timezone
from pathlib import Path

from asyncua import Server, ua
from cryptography import x509
from cryptography.hazmat.primitives import serialization

logging.basicConfig(level=logging.INFO)
log = logging.getLogger("plant-sim")

MODEL = json.loads(Path("/model/model.json").read_text())
KIND = os.environ["MACHINE_TYPE"]
SPEC = MODEL["kinds"][KIND]
NS_URI = "urn:plant:sim"
APP_URI = f"urn:plant:sim:{KIND}"      # must equal the URI in the certificate
CERT_DIR = Path("/certs")


def pem_to_der(src: Path, dst: Path) -> None:
    """cert-manager writes PEM, with the CA after the leaf; take the leaf."""
    cert = x509.load_pem_x509_certificate(src.read_bytes())
    dst.write_bytes(cert.public_bytes(serialization.Encoding.DER))


def in_excursion(t: float) -> bool:
    start = MODEL["excursion_start_s"]
    if t < start:
        return False
    return ((t - start) % MODEL["excursion_period_s"]) < MODEL["excursion_length_s"]


def make_value(machine, tag, t, rng, state):
    """One value for one tag at second t."""
    first_machine = machine == SPEC["machines"][0]
    exc = SPEC["excursion"] if first_machine and in_excursion(t) else None
    if tag["type"] == "counter":
        step = tag["nominal"]
        if exc and exc.get("tag") == tag["name"]:
            step *= exc.get("rate_mult", 1.0)
        state[tag["name"]] = state.get(tag["name"], 0.0) + step
        return state[tag["name"]]
    phase = (zlib.crc32(f"{machine}.{tag['name']}".encode()) % 628) / 100.0
    value = tag["nominal"] + tag["drift"] * math.sin(2 * math.pi * t / 3600.0 + phase)
    value += rng.gauss(0.0, tag["noise"])
    if exc and exc.get("tag") == tag["name"] and "delta" in exc:
        value += exc["delta"]
    return value


async def main():
    # Convert the server certificate for asyncua.
    pem_to_der(CERT_DIR / "tls.crt", Path("/tmp/server.der"))

    server = Server()
    await server.init()
    server.set_endpoint("opc.tcp://0.0.0.0:4840/")
    server.set_server_name(f"Plant simulator ({KIND})")
    # Depending on the asyncua version this is a plain call or a coroutine.
    res = server.set_application_uri(APP_URI)
    if asyncio.iscoroutine(res):
        await res

    await server.load_certificate("/tmp/server.der")
    await server.load_private_key(str(CERT_DIR / "tls.key"))
    # Only signed and encrypted sessions: there is no unsecured endpoint.
    server.set_security_policy([ua.SecurityPolicyType.Basic256Sha256_SignAndEncrypt])

    idx = await server.register_namespace(NS_URI)
    plant = await server.nodes.objects.add_folder(idx, "Plant")
    area = await plant.add_folder(idx, SPEC["area"])

    variables = {}   # (machine, tag name) -> node
    for machine in SPEC["machines"]:
        mfolder = await area.add_folder(idx, machine)
        for tag in SPEC["tags"]:
            nid = ua.NodeId(f"Plant.{SPEC['area']}.{machine}.{tag['name']}", idx)
            node = await mfolder.add_variable(nid, tag["name"], float(tag["nominal"]),
                                              ua.VariantType.Double)
            variables[(machine, tag["name"])] = node

    rngs = {m: random.Random(zlib.crc32(m.encode())) for m in SPEC["machines"]}
    states = {m: {} for m in SPEC["machines"]}
    log.info("server for %s ready with %d variables", KIND, len(variables))

    async with server:
        t0 = asyncio.get_event_loop().time()
        while True:
            t = asyncio.get_event_loop().time() - t0
            now = datetime.now(timezone.utc)
            for (machine, name), node in variables.items():
                tag = next(x for x in SPEC["tags"] if x["name"] == name)
                v = float(make_value(machine, tag, t, rngs[machine], states[machine]))
                try:
                    dv = ua.DataValue(ua.Variant(v, ua.VariantType.Double),
                                      SourceTimestamp=now)
                    await node.write_value(dv)
                except TypeError:
                    await node.write_value(v)   # fall back: server stamps the time
            await asyncio.sleep(1.0)


asyncio.run(main())
Two notes. The seed is the machine name, so every run of the same machine produces the same noise sequence, and Part 3 and Part 5 can repeat tests. And the simulator does not enforce a client trust list: I could not confirm which asyncua API enforces one in the version you will install (the library has changed here between releases), so the server accepts any client certificate that completes the secure handshake. The client side is different: Telegraf is pinned to each server’s exact certificate. A real server enforces both directions; section 10 covers the errors you see when it does.
4.3 The certificates and the Deployments
An OPC UA application instance certificate carries the application URI as a URI subject alternative name, plus the key usages the specification asks for. The URI must equal what the server reports, here urn:plant:sim:<kind>.
edge/ot-sim/template.yaml (one copy per machine type, filled by envsubst):
apiVersion: cert-manager.io/v1
kind: Certificate
metadata:
  name: opcua-${KIND}
  namespace: ot-sim
spec:
  secretName: opcua-${KIND}-tls
  duration: 8760h
  renewBefore: 720h
  privateKey:
    algorithm: RSA
    size: 2048
    rotationPolicy: Always
  usages:
    - digital signature
    - content commitment
    - key encipherment
    - data encipherment
    - server auth
    - client auth
  uris:
    - urn:plant:sim:${KIND}
  dnsNames:
    - opcua-${KIND}
    - opcua-${KIND}.ot-sim.svc
    - opcua-${KIND}.ot-sim.svc.cluster.local
  issuerRef:
    name: plant-ca
    kind: ClusterIssuer
---
apiVersion: apps/v1
kind: Deployment
metadata:
  name: opcua-${KIND}
  namespace: ot-sim
  labels: { app: opcua-${KIND}, plant.role: simulator }
spec:
  replicas: 1
  selector:
    matchLabels: { app: opcua-${KIND} }
  template:
    metadata:
      labels: { app: opcua-${KIND}, plant.role: simulator }
    spec:
      containers:
        - name: server
          image: python:3.12-slim
          command: ["sh", "-c", "pip install --no-cache-dir 'asyncua~=1.1' && python /app/server.py"]
          env:
            - { name: MACHINE_TYPE, value: "${KIND}" }
          ports:
            - containerPort: 4840
          resources:
            requests: { cpu: 50m, memory: 128Mi }
            limits:   { memory: 256Mi }
          volumeMounts:
            - { name: app,   mountPath: /app }
            - { name: model, mountPath: /model }
            - { name: certs, mountPath: /certs, readOnly: true }
      volumes:
        - name: app
          configMap: { name: opcua-code }
        - name: model
          configMap: { name: opcua-model }
        - name: certs
          secret: { secretName: opcua-${KIND}-tls }
---
apiVersion: v1
kind: Service
metadata:
  name: opcua-${KIND}
  namespace: ot-sim
spec:
  selector: { app: opcua-${KIND} }
  ports:
    - { port: 4840, targetPort: 4840 }
The container installs asyncua when it starts, so it needs outbound access to the Python package index. The default-deny policy in ot-sim blocks that, so apply the policies in section 5 after the first start, or temporarily delete the policy. A real build bakes an image with the dependency, pushes it to the plant Artifact Registry repository, and signs it; Part 4 does the signing.
kubectl -n ot-sim create configmap opcua-code --from-file=edge/ot-sim/server.py
kubectl -n ot-sim create configmap opcua-model --from-file=edge/ot-sim/model.json

# Temporarily allow egress so pip can reach the package index.
kubectl -n ot-sim delete networkpolicy default-deny

for k in press dryer autoclave blister hvac coldstore; do
  KIND=$k envsubst < edge/ot-sim/template.yaml | kubectl apply -f -
done

kubectl -n ot-sim get certificate
kubectl -n ot-sim rollout status deployment/opcua-press
kubectl -n ot-sim logs deployment/opcua-press | tail -3
Once every Pod is running, put the default-deny policy back (kubectl apply -f edge/zones.yaml from Part 1) and continue.
Checkpoint 4. Six Certificate objects are READY True; six Pods are Running; each log ends with server for <kind> ready with 10 variables. To confirm the endpoint is secured, list its endpoints with the asyncua command-line tool from a Pod (the tools ship with the library):
kubectl -n ot-sim exec deployment/opcua-press -- python -m asyncua.tools.uadiscover -h 2>/dev/null | head -3If that module path does not exist in your version, skip this and rely on the Telegraf test in section 6, which only succeeds on a signed and encrypted channel. I did not verify the tool’s module path.
5. Akri discovery of the simulated servers
Update the Akri values from Part 1 so that it looks for the six servers, and apply the network rules for the flows in this part. Akri’s Discovery Handler runs in the default namespace (where Part 1 installed it), so that namespace needs to reach port 4840 in ot-sim.
Replace edge/akri-values.yaml:
opcua:
  discovery:
    enabled: true
  configuration:
    enabled: true
    discoveryDetails:
      discoveryUrls:
        - "opc.tcp://opcua-press.ot-sim.svc.cluster.local:4840/"
        - "opc.tcp://opcua-dryer.ot-sim.svc.cluster.local:4840/"
        - "opc.tcp://opcua-autoclave.ot-sim.svc.cluster.local:4840/"
        - "opc.tcp://opcua-blister.ot-sim.svc.cluster.local:4840/"
        - "opc.tcp://opcua-hvac.ot-sim.svc.cluster.local:4840/"
        - "opc.tcp://opcua-coldstore.ot-sim.svc.cluster.local:4840/"
Save the flows as edge/netpol.yaml. Each is an allow rule added to the default-deny from Part 1:
# ot-sim: servers accept OPC UA only from Telegraf (ingest) and Akri (default).
apiVersion: networking.k8s.io/v1
kind: NetworkPolicy
metadata: { name: allow-opcua-in, namespace: ot-sim }
spec:
  podSelector: { matchLabels: { plant.role: simulator } }
  policyTypes: [Ingress]
  ingress:
    - from:
        - namespaceSelector:
            matchExpressions:
              - { key: kubernetes.io/metadata.name, operator: In, values: [ingest, default] }
      ports:
        - { protocol: TCP, port: 4840 }
---
# ingest: Telegraf may reach the OPC UA servers and the broker, nothing else.
apiVersion: networking.k8s.io/v1
kind: NetworkPolicy
metadata: { name: allow-ingest-out, namespace: ingest }
spec:
  podSelector: {}
  policyTypes: [Egress]
  egress:
    - to:
        - namespaceSelector: { matchLabels: { kubernetes.io/metadata.name: ot-sim } }
      ports:
        - { protocol: TCP, port: 4840 }
    - to:
        - namespaceSelector: { matchLabels: { kubernetes.io/metadata.name: mqtt } }
      ports:
        - { protocol: TCP, port: 8883 }
---
# mqtt: the broker accepts MQTT over TLS only from the ingest namespace.
apiVersion: networking.k8s.io/v1
kind: NetworkPolicy
metadata: { name: allow-mqtt-in, namespace: mqtt }
spec:
  podSelector: {}
  policyTypes: [Ingress]
  ingress:
    - from:
        - namespaceSelector: { matchLabels: { kubernetes.io/metadata.name: ingest } }
      ports:
        - { protocol: TCP, port: 8883 }
---
# mqtt: outbound HTTPS to Google APIs and the instance metadata server.
# This is the ONLY path out of the plant. Deleting this policy is how the
# outage test cuts the link.
apiVersion: networking.k8s.io/v1
kind: NetworkPolicy
metadata: { name: allow-egress-google, namespace: mqtt }
spec:
  podSelector: {}
  policyTypes: [Egress]
  egress:
    - to:
        - ipBlock:
            cidr: 0.0.0.0/0
            except: [10.0.0.0/8, 172.16.0.0/12, 192.168.0.0/16, 169.254.0.0/16]
      ports:
        - { protocol: TCP, port: 443 }
    - to:
        - ipBlock: { cidr: 169.254.169.254/32 }
      ports:
        - { protocol: TCP, port: 80 }
This policy allows HTTPS to any public address, not only Google’s. A tighter version uses Cilium’s FQDN rules (toFQDNs for pubsub.googleapis.com and oauth2.googleapis.com) in a CiliumNetworkPolicy; I did not write or test one.
kubectl apply -f edge/netpol.yaml
helm upgrade akri akri-helm-charts/akri -f edge/akri-values.yaml
kubectl get akrii
kubectl get akrii -o yaml | grep -o 'opc.tcp://[^"]*' | sort -u
Checkpoint 5. kubectl get akrii lists six Instances within about a minute, and the grep prints the six URLs. Akri has no broker image here, so the Instances are the evidence. I did not confirm which property of the Instance holds the URL, which is why the check uses grep over the YAML. The same check makes a useful drift test later: the set of URLs Akri found should equal the set of endpoints in Telegraf’s configuration.
6. Telegraf: OPC UA in, MQTT out
Telegraf’s inputs.opcua_listener subscribes to node IDs and reports changes. Its MQTT output publishes each metric to a topic built from tags. The topic design is plant/<site>/<area>/<machine>/<tag>, for example plant/s01/compression/Press01/CompressionForce. Each level is useful on its own: ACLs match on a prefix, EMQX rules split on the levels, and Pub/Sub carries the full topic as an attribute.
6.1 Generate the configuration from the model
The same model.json drives the simulator and the Telegraf configuration, so they cannot drift apart. edge/telegraf/gen_telegraf.py:
import json
import sys

model = json.load(open(sys.argv[1]))
site = model["site"]

out = []
out.append('''[agent]
  interval = "1s"
  flush_interval = "1s"
  metric_batch_size = 500
  metric_buffer_limit = 20000
  omit_hostname = true

[[outputs.mqtt]]
  servers = ["mqtts://emqx.mqtt.svc.cluster.local:8883"]
  protocol = "5"
  topic = 'plant/{{ .Tag "site" }}/{{ .Tag "area" }}/{{ .Tag "machine" }}/{{ .Tag "tag" }}'
  qos = 1
  retain = false
  keep_alive = 30
  client_id = "telegraf-ingest"
  data_format = "json"
  json_timestamp_units = "1ms"
  tls_ca = "/etc/telegraf/pki/mqtt/ca.crt"
  tls_cert = "/etc/telegraf/pki/mqtt/tls.crt"
  tls_key = "/etc/telegraf/pki/mqtt/tls.key"
''')

for kind, spec in model["kinds"].items():
    out.append(f'''
[[inputs.opcua_listener]]
  name = "plant"
  endpoint = "opc.tcp://opcua-{kind}.ot-sim.svc.cluster.local:4840/"
  security_policy = "Basic256Sha256"
  security_mode = "SignAndEncrypt"
  certificate = "/etc/telegraf/pki/opcua/tls.crt"
  private_key = "/etc/telegraf/pki/opcua/tls.key"
  remote_certificate = "/etc/telegraf/pki/servers/{kind}.pem"
  auth_method = "Anonymous"
  timestamp = "source"
  subscription_interval = "1s"
  connect_fail_behavior = "retry"
''')
    for machine in spec["machines"]:
        for tag in spec["tags"]:
            node = f'ns=2;s=Plant.{spec["area"]}.{machine}.{tag["name"]}'
            out.append(f'''  [[inputs.opcua_listener.nodes]]
    name = "{tag["name"]}"
    id = "{node}"
    default_tags = {{ site = "{site}", area = "{spec["area"]}", machine = "{machine}", tag = "{tag["name"]}", unit = "{tag["unit"]}" }}
''')

print("\n".join(out))
python3 edge/telegraf/gen_telegraf.py edge/ot-sim/model.json > edge/telegraf/telegraf.conf
grep -c 'inputs.opcua_listener.nodes' edge/telegraf/telegraf.conf # expect 60
grep -n 'opcua_listener\]\]' edge/telegraf/telegraf.conf | wc -l # expect 6The tag list is the single source of truth for node IDs, units and topics. The namespace index ns=2 is what asyncua assigns to the first namespace you register; if your server reports another index, the nodes fail with BadNodeIdUnknown, and the fix is the namespace_uri option the Telegraf brief describes, which survives a re-ordering. The sampling rate is the server’s publishing interval, 1s; per-node sampling settings exist in Telegraf but I left them at their defaults.
The authentication method is Anonymous inside the encrypted, signed channel, because the simulator offers no other user token. A real plant uses the UserName or Certificate method with a user per client, and the Telegraf brief shows the options.
6.2 Certificates and the Deployment
Telegraf needs three things: a client certificate for OPC UA (with its own application URI), a client certificate for MQTT, and the public certificates of the six servers so it can trust each one explicitly.
edge/telegraf/telegraf.yaml:
apiVersion: cert-manager.io/v1
kind: Certificate
metadata: { name: telegraf-opcua, namespace: ingest }
spec:
  secretName: telegraf-opcua-tls
  duration: 8760h
  renewBefore: 720h
  privateKey: { algorithm: RSA, size: 2048, rotationPolicy: Always }
  usages: [digital signature, content commitment, key encipherment, data encipherment, client auth]
  uris: ["urn:plant:telegraf"]
  dnsNames: ["telegraf"]
  issuerRef: { name: plant-ca, kind: ClusterIssuer }
---
apiVersion: cert-manager.io/v1
kind: Certificate
metadata: { name: telegraf-mqtt, namespace: ingest }
spec:
  secretName: telegraf-mqtt-tls
  duration: 8760h
  renewBefore: 720h
  commonName: telegraf-ingest          # becomes the MQTT username and client ID
  privateKey: { algorithm: RSA, size: 2048, rotationPolicy: Always }
  usages: [digital signature, key encipherment, client auth]
  issuerRef: { name: plant-ca, kind: ClusterIssuer }
---
apiVersion: apps/v1
kind: Deployment
metadata: { name: telegraf, namespace: ingest, labels: { app: telegraf } }
spec:
  replicas: 1
  selector: { matchLabels: { app: telegraf } }
  template:
    metadata: { labels: { app: telegraf } }
    spec:
      containers:
        - name: telegraf
          image: telegraf:1.40.2
          args: ["--config", "/etc/telegraf/telegraf.conf"]
          resources:
            requests: { cpu: 100m, memory: 128Mi }
            limits:   { memory: 512Mi }
          volumeMounts:
            - { name: conf,    mountPath: /etc/telegraf/telegraf.conf, subPath: telegraf.conf }
            - { name: opcua,   mountPath: /etc/telegraf/pki/opcua,   readOnly: true }
            - { name: mqtt,    mountPath: /etc/telegraf/pki/mqtt,    readOnly: true }
            - { name: servers, mountPath: /etc/telegraf/pki/servers, readOnly: true }
      volumes:
        - name: conf
          configMap: { name: telegraf-conf }
        - name: opcua
          secret: { secretName: telegraf-opcua-tls }
        - name: mqtt
          secret: { secretName: telegraf-mqtt-tls }
        - name: servers
          configMap: { name: opcua-server-certs }
The six server certificates live in ot-sim, and Telegraf runs in ingest, so only the public certificates are copied across. Run this on the VM:
mkdir -p /tmp/servers
for k in press dryer autoclave blister hvac coldstore; do
  kubectl -n ot-sim get secret opcua-$k-tls -o jsonpath='{.data.tls\.crt}' \
    | base64 -d | openssl x509 -out /tmp/servers/$k.pem      # first (leaf) certificate only
done
kubectl -n ingest create configmap opcua-server-certs --from-file=/tmp/servers
kubectl -n ingest create configmap telegraf-conf --from-file=telegraf.conf=edge/telegraf/telegraf.conf
The MQTT output needs the broker, so start Telegraf after section 7. Before that, test the OPC UA half on its own, with Telegraf’s --test. A listener input may print nothing under --test, so this test uses a one-off polling input for a single node:
cat > /tmp/one.conf <<'EOF'
[[inputs.opcua]]
  name = "plant"
  endpoint = "opc.tcp://opcua-press.ot-sim.svc.cluster.local:4840/"
  security_policy = "Basic256Sha256"
  security_mode = "SignAndEncrypt"
  certificate = "/etc/telegraf/pki/opcua/tls.crt"
  private_key = "/etc/telegraf/pki/opcua/tls.key"
  remote_certificate = "/etc/telegraf/pki/servers/press.pem"
  auth_method = "Anonymous"
  timestamp = "source"
  [[inputs.opcua.nodes]]
    name = "CompressionForce"
    id = "ns=2;s=Plant.compression.Press01.CompressionForce"
EOF
kubectl -n ingest create configmap telegraf-test --from-file=one.conf=/tmp/one.conf
Run it from a throwaway Pod with the same mounts (for example, copy the Deployment’s Pod spec, change the command to telegraf --config /tmp/one.conf --test, and mount the telegraf-test ConfigMap). The expected output is one line like:
plant,id=ns\=2;s=Plant.compression.Press01.CompressionForce CompressionForce=11.23,Quality="OK (0x0)" 1767225600000000000Checkpoint 6. The test line prints with Quality="OK (0x0)". If it fails with a security error, see the OPC UA rows in the troubleshooting table.
7. EMQX at the edge: TLS, ACLs, topics, persistence
EMQX runs as one node, because a single node needs no licence for production use and the plant edge is one server. A StatefulSet with a volume keeps its data across restarts. Four things are configured here: mutual TLS on the listener, ACLs by certificate identity, durable sessions on disk, and the plain-TCP listener bound to loopback only.
7.1 Certificates, secrets and configuration
The broker needs a server certificate, and the clients need client certificates whose common name becomes their MQTT username. A second client certificate, plant-operator, is for subscribing during tests.
Create the namespace secrets from Secret Manager without writing the value to a file. From your laptop:
gcloud secrets versions access latest --secret=emqx-admin-password --project=$CLOUD_PROJECT \
 | gcloud compute ssh plant-edge-1 --zone $ZONE --project $EDGE_PROJECT --tunnel-through-iap \
   --command "kubectl -n mqtt create secret generic emqx-admin --from-file=password=/dev/stdin"

# On the VM, a random Erlang cookie for the node:
kubectl -n mqtt create secret generic emqx-cookie --from-literal=cookie="$(openssl rand -hex 24)"edge/emqx/emqx.yaml:
apiVersion: cert-manager.io/v1
kind: Certificate
metadata: { name: emqx-server, namespace: mqtt }
spec:
  secretName: emqx-server-tls
  duration: 8760h
  renewBefore: 720h
  privateKey: { algorithm: RSA, size: 2048, rotationPolicy: Always }
  usages: [digital signature, key encipherment, server auth]
  dnsNames: [emqx, emqx.mqtt, emqx.mqtt.svc, emqx.mqtt.svc.cluster.local]
  issuerRef: { name: plant-ca, kind: ClusterIssuer }
---
apiVersion: cert-manager.io/v1
kind: Certificate
metadata: { name: plant-operator, namespace: ingest }
spec:
  secretName: plant-operator-tls
  duration: 8760h
  renewBefore: 720h
  commonName: plant-operator
  privateKey: { algorithm: RSA, size: 2048, rotationPolicy: Always }
  usages: [digital signature, key encipherment, client auth]
  issuerRef: { name: plant-ca, kind: ClusterIssuer }
---
apiVersion: v1
kind: ConfigMap
metadata: { name: emqx-conf, namespace: mqtt }
data:
  emqx.conf: |
    # Plain TCP on loopback only; nothing outside the Pod can use it.
    listeners.tcp.default {
      bind = "127.0.0.1:1883"
    }

    # TLS with a client certificate required. The username and client ID come
    # from the certificate's common name, so identity cannot be chosen by the client.
    listeners.ssl.default {
      bind = "0.0.0.0:8883"
      max_connections = 1000
      peer_cert_as_username = cn
      peer_cert_as_clientid = cn
      ssl_options {
        cacertfile = "/etc/emqx/certs/ca.crt"
        certfile   = "/etc/emqx/certs/tls.crt"
        keyfile    = "/etc/emqx/certs/tls.key"
        verify = verify_peer
        fail_if_no_peer_cert = true
      }
    }
    listeners.ws.default.enable  = false
    listeners.wss.default.enable = false

    # The client certificate is the authentication. No other source is chained,
    # so a client that passes the TLS handshake is accepted and the ACL decides what it may do.
    authentication = []

    authorization {
      no_match = deny
      deny_action = ignore
      sources = [
        { type = file, enable = true, path = "etc/acl.conf" }
      ]
    }

    # Sessions and their queued messages survive a restart.
    durable_sessions {
      enable = true
    }
  acl.conf: |
    %% Telegraf may publish machine tags, and nothing else.
    {allow, {user, "telegraf-ingest"}, publish, ["plant/+/+/+/+"]}.
    %% The test operator may read the plant tree.
    {allow, {user, "plant-operator"}, subscribe, ["plant/#"]}.
    %% Nobody reads the broker's system topics or the root wildcard.
    {deny, all, subscribe, ["$SYS/#", {eq, "#"}, {eq, "+/#"}]}.
    %% Everything else is refused.
    {deny, all}.
---
apiVersion: v1
kind: Service
metadata: { name: emqx, namespace: mqtt }
spec:
  selector: { app: emqx }
  ports:
    - { name: mqtts,     port: 8883,  targetPort: 8883 }
    - { name: dashboard, port: 18083, targetPort: 18083 }
---
apiVersion: apps/v1
kind: StatefulSet
metadata: { name: emqx, namespace: mqtt }
spec:
  serviceName: emqx
  replicas: 1
  selector: { matchLabels: { app: emqx } }
  template:
    metadata: { labels: { app: emqx } }
    spec:
      securityContext: { fsGroup: 1000 }
      containers:
        - name: emqx
          image: emqx/emqx-enterprise:6.3.1
          env:
            - { name: EMQX_NODE__NAME, value: "emqx@127.0.0.1" }
            - name: EMQX_NODE__COOKIE
              valueFrom: { secretKeyRef: { name: emqx-cookie, key: cookie } }
            - name: EMQX_DASHBOARD__DEFAULT_PASSWORD
              valueFrom: { secretKeyRef: { name: emqx-admin, key: password } }
          ports:
            - { containerPort: 8883 }
            - { containerPort: 18083 }
          resources:
            requests: { cpu: 500m, memory: 1Gi }
            limits:   { memory: 4Gi }
          volumeMounts:
            - { name: data,  mountPath: /opt/emqx/data }
            - { name: conf,  mountPath: /opt/emqx/etc/emqx.conf, subPath: emqx.conf }
            - { name: conf,  mountPath: /opt/emqx/etc/acl.conf,  subPath: acl.conf }
            - { name: certs, mountPath: /etc/emqx/certs, readOnly: true }
      volumes:
        - name: conf
          configMap: { name: emqx-conf }
        - name: certs
          secret: { secretName: emqx-server-tls }
  volumeClaimTemplates:
    - metadata: { name: data }
      spec:
        accessModes: [ReadWriteOnce]
        resources: { requests: { storage: 20Gi } }
kubectl apply -f edge/emqx/emqx.yaml
kubectl -n mqtt rollout status statefulset/emqx
kubectl -n mqtt logs statefulset/emqx | tail -5The dashboard password applies on first start only; change it in the Dashboard afterwards if you want a personal one. The emqx-admin value comes from Secret Manager, never from a file in the repository.
7.2 Telegraf starts, and the topic and ACL checks
Start Telegraf now that the broker exists:
kubectl apply -f edge/telegraf/telegraf.yaml
kubectl -n ingest rollout status deployment/telegraf
kubectl -n ingest logs deployment/telegraf | tail -5
Subscribe as the operator from a throwaway Pod in ingest (the only namespace allowed to reach the broker):
kubectl -n ingest run mqtt-check --rm -it --restart=Never --image=eclipse-mosquitto:2 \
  --overrides='{"spec":{"containers":[{"name":"mqtt-check","image":"eclipse-mosquitto:2","stdin":true,"tty":true,"command":["sh"],"volumeMounts":[{"name":"c","mountPath":"/c"}]}],"volumes":[{"name":"c","secret":{"secretName":"plant-operator-tls"}}]}}' -- sh
# Inside the Pod:
mosquitto_sub -h emqx.mqtt.svc.cluster.local -p 8883 \
  --cafile /c/ca.crt --cert /c/tls.crt --key /c/tls.key \
  -t 'plant/s01/compression/#' -v -C 3
You should see lines like these, three of them, then the command exits:
plant/s01/compression/Press01/CompressionForce {"fields":{"CompressionForce":11.2,"Quality":"OK (0x0)"},"name":"plant","tags":{"area":"compression","id":"ns=2;s=Plant.compression.Press01.CompressionForce","machine":"Press01","site":"s01","tag":"CompressionForce","unit":"kN"},"timestamp":1767225600123}Two ACL tests prove the rules, again from the Pod:
# 1. The operator may not publish. EMQX drops it silently (deny_action = ignore).
mosquitto_pub -h emqx.mqtt.svc.cluster.local -p 8883 --cafile /c/ca.crt --cert /c/tls.crt --key /c/tls.key \
  -t 'plant/s01/compression/Press01/CompressionForce' -m '{"forged":true}' -q 1

# 2. Subscribing to everything is refused: this prints nothing and times out.
mosquitto_sub -h emqx.mqtt.svc.cluster.local -p 8883 --cafile /c/ca.crt --cert /c/tls.crt --key /c/tls.key \
  -t '#' -W 5
Then check that no forged message appears in the stream from the first test. Finally, check the TLS requirement: the same mosquitto_sub without --cert and --key must fail the handshake.
Persistence. The StatefulSet’s volume holds /opt/emqx/data, and durable sessions are on. Telegraf connects with a stable client ID and MQTT 5, and its session does not carry queued messages here because EMQX delivers to the rule engine, not to a subscriber. The durable setting matters for any subscriber added later, such as the Part 3 consumers; the Telegraf-to-EMQX leg is protected by QoS 1 and Telegraf’s own buffer, which holds up to 20,000 metrics in memory.
Checkpoint 7. The operator receives messages on plant/s01/compression/#; the forged publish never appears; # returns nothing; a client without a certificate is refused; Telegraf’s log shows 60 nodes subscribed and no errors; and kubectl -n mqtt exec statefulset/emqx -- ls /opt/emqx/data lists data directories, showing the volume is in use.
8. The bridge to Pub/Sub, with a buffer
8.1 Authentication: the attached service account
The EMQX documentation offers three ways to authenticate the Pub/Sub connector: a service account JSON key, Workload Identity Federation (which needs an external OIDC identity provider, a pool and a provider), and an attached service account, which needs no extra fields and works on a Compute Engine instance with a service account attached. The edge VM from Part 1 is exactly that, with plant-edge-vm attached and the cloud-platform scope, and its only role is publisher on one topic. The decision for this project is the attached service account, because it leaves no key file anywhere. The cost is that EMQX must reach the metadata server, which the allow-egress-google policy permits, and that the credential is tied to the VM: a laptop stand-in would need the JSON key route instead.
I did not confirm that a Pod can reach the VM’s metadata server through Cilium and k3s. Section 8.4 shows the check.
8.2 The connector, the sink and the rule
Reach the Dashboard through a tunnel. On the VM: kubectl -n mqtt port-forward svc/emqx 18083:18083. From the laptop, in another terminal:
gcloud compute ssh plant-edge-1 --zone $ZONE --project $EDGE_PROJECT --tunnel-through-iap -- -L 18083:localhost:18083Open http://localhost:18083, sign in as admin with the Secret Manager value, and create three things.
Connector. Integration, Connector, Create, Google PubSub Producer:
| Field | Value |
|---|---|
| Name | plant_pubsub |
| Authentication | Attached Service Account |
| Connection Pool Size, HTTP Pipelining, timeouts | defaults (8, 100, 15 s and so on) |
Rule. Integration, Rules, Create:
SELECT
  payload,
  topic,
  nth(4, split(topic, '/')) AS machine
FROM
  "plant/+/+/+/+"
The topic has five levels, so the fourth is the machine name; it becomes the ordering key. EMQX’s SQL runs on a copy of the message, so a failing sink never stops delivery to MQTT subscribers.
Sink (action). Add an action to the rule, type GCP PubSub Producer:
| Field | Value |
|---|---|
| Connector | plant_pubsub |
| GCP PubSub Topic | projects/plant-cloud-abc123/topics/plant-telemetry (the full path, because the service account lives in the edge project and the topic in the cloud project) |
| Payload Template | ${payload} |
| Attributes Template | key topic, value ${topic} |
| Ordering Key Template | ${machine} |
| Request TTL | 5h |
| Max Buffer Queue Size | 2GB |
| Buffer Pool Size | 1 |
| Batch Size | 20 |
| Query Mode | Async |
| Inflight Window | 1 |
Why these values, one by one:
- Full topic path: the documentation says a bare topic name is resolved in the service account’s own project.
- Ordering key per machine: Pub/Sub orders messages with the same key, and a machine’s tags are the natural unit. Twelve keys give parallelism across machines.
- Inflight window 1 and one buffer worker: the documentation names a window of 1 as the setting for strict ordering. The cost is throughput: one request is in flight at a time. With a batch of 20 and an estimated 50 ms round trip, that is about 400 messages a second, which I computed and did not measure. The lab produces 60 a second.
- Request TTL 5 h: the default is 45 seconds. A request that waits longer than its TTL is dropped, so with the default the buffer could not hold data through any real outage. The value must exceed the longest outage you intend to survive: 4 hours plus margin.
- Max Buffer Queue Size 2 GB: the default is 256 MB. The lab payload is roughly 260 bytes (measure it:
mosquitto_sub ... -C 1 | wc -c), so 60 messages a second is about 16 KB/s, or about 225 MB over 4 hours. Treat it as an estimate. At the overview’s example of 30,000 tags sampled every 1 to 5 seconds, the same arithmetic gives gigabytes per hour; that scale needs measured sizing and a larger disk, and I did not run it.
Save, enable the rule, and note the sink’s status; it should read Connected.
8.3 Export the configuration to Git
The Dashboard stores these settings in EMQX’s data directory. The brief’s advice is to keep configuration in Git and treat the Dashboard as inspection. Export what you created with the REST API and commit it, so a rebuilt broker can be configured the same way (create a read-only API key in the Dashboard first, and keep it out of Git):
curl -s -u "$KEY:$SECRET" http://localhost:18083/api/v5/connectors | jq . > edge/emqx/connectors.export.json
curl -s -u "$KEY:$SECRET" http://localhost:18083/api/v5/actions    | jq . > edge/emqx/actions.export.json
curl -s -u "$KEY:$SECRET" http://localhost:18083/api/v5/rules      | jq . > edge/emqx/rules.export.json
I did not verify these endpoint paths against the 6.3.1 API reference, nor that a rebuilt broker can be loaded from these files. Check the REST API page in the Dashboard (the Swagger view) before relying on them.
8.4 Prove the first message arrives
# From the laptop: pull a few messages from the test subscription.
gcloud pubsub subscriptions pull telemetry-check --project=$CLOUD_PROJECT --auto-ack --limit=3 \
  --format="table(message.data.decode(base64), message.attributes, message.orderingKey)"
You should see JSON payloads like the MQTT ones, the topic attribute, and an ordering key such as Press01. If nothing arrives, look in the Dashboard at the sink’s metrics (matched, success, failed), and from the VM test the metadata route from a Pod in mqtt:
kubectl -n mqtt run meta-check --rm -it --restart=Never --image=curlimages/curl --command -- \
  curl -s -H "Metadata-Flavor: Google" \
  http://169.254.169.254/computeMetadata/v1/instance/service-accounts/default/email
It must print plant-edge-vm@.... If it hangs, the policy or the pod routing blocks the metadata server; that is the most likely failure in this section.
Checkpoint 8. The sink shows Connected; telemetry-check returns messages with the topic attribute and an ordering key; the Dashboard’s rule shows matched and success counts rising at about 60 a second.
9. The link-outage test
The test cuts the only path out of the plant, waits, restores it, and checks what arrived. In the lab the outage lasts 10 minutes; the design target is 4 hours, and nothing here proves 4 hours.
9.1 The checker
The checker pulls every message from telemetry-check, acknowledges each batch only after reading it, and tests four things per (machine, tag) series: arrival order of source timestamps; gaps larger than 2.5 seconds (the sampling interval is 1 second); duplicates (Pub/Sub delivers at least once); and which messages were published after the link came back.
tools/check_order.py (runs on your laptop):
import argparse
import json
from collections import defaultdict
from datetime import datetime, timezone

from google.cloud import pubsub_v1

p = argparse.ArgumentParser()
p.add_argument("--project", required=True)
p.add_argument("--subscription", default="telemetry-check")
p.add_argument("--cut", required=True, help="UTC time the link was cut, e.g. 2026-11-09T18:00:00")
p.add_argument("--restore", required=True, help="UTC time the link was restored")
p.add_argument("--max-gap-ms", type=int, default=2500)
args = p.parse_args()

def parse(s):
    return datetime.fromisoformat(s).replace(tzinfo=timezone.utc)

cut_ms = int(parse(args.cut).timestamp() * 1000)
restore = parse(args.restore)
restore_ms = int(restore.timestamp() * 1000)

sub = pubsub_v1.SubscriberClient()
path = sub.subscription_path(args.project, args.subscription)

series = defaultdict(list)           # (machine, tag) -> [source ts ms] in arrival order
seen = set()
dups = 0
buffered = 0                         # source ts inside the outage, published after restore
total = 0
empty_pulls = 0

while empty_pulls < 3:
    resp = sub.pull(request={"subscription": path, "max_messages": 500}, timeout=30)
    if not resp.received_messages:
        empty_pulls += 1
        continue
    empty_pulls = 0
    ack_ids = []
    for rm in resp.received_messages:
        ack_ids.append(rm.ack_id)
        doc = json.loads(rm.message.data)
        tags = doc["tags"]
        key = (tags["machine"], tags["tag"])
        ts = int(doc["timestamp"])
        total += 1
        if (key, ts) in seen:
            dups += 1
            continue
        seen.add((key, ts))
        series[key].append(ts)
        published = rm.message.publish_time
        if cut_ms <= ts <= restore_ms and published >= restore:
            buffered += 1
    sub.acknowledge(request={"subscription": path, "ack_ids": ack_ids})

out_of_order = 0
gaps = []
for key, seq in series.items():
    for a, b in zip(seq, seq[1:]):
        if b < a:
            out_of_order += 1
        elif b - a > args.max_gap_ms:
            gaps.append((key, a, b, b - a))

print(f"messages received:        {total}")
print(f"duplicates (ignored):     {dups}")
print(f"series checked:           {len(series)}")
print(f"out-of-order steps:       {out_of_order}")
print(f"gaps over {args.max_gap_ms} ms:        {len(gaps)}")
print(f"buffered then delivered:  {buffered}")
for key, a, b, d in gaps[:10]:
    print(f"  gap {key}: {a} -> {b} ({d} ms)")
print("RESULT:", "PASS" if out_of_order == 0 and not gaps and buffered > 0 else "FAIL")
pip install google-cloud-pubsub
gcloud auth application-default login9.2 Run the test
All times are UTC. From the VM, the cut is deleting the one policy that lets EMQX out:
date -u +%FT%T                                   # note as CUT
kubectl -n mqtt delete networkpolicy allow-egress-google
Wait 10 minutes. During this time Telegraf keeps publishing to EMQX, and the Dashboard shows the sink with growing queued messages and failing requests (the exact labels vary by version). Confirm it in the Dashboard’s sink page, and by running gcloud pubsub subscriptions pull telemetry-check --auto-ack --limit=1 from the laptop a few minutes in: it must return nothing new from the machines.
Restore the link:
kubectl apply -f edge/netpol.yaml
date -u +%FT%T                                   # note as RESTORE
Wait about 5 minutes for the queue to drain (the estimate is under 2 minutes for 36,000 messages), then from the laptop:
python3 tools/check_order.py --project $CLOUD_PROJECT \
  --cut 2026-11-09T18:00:00 --restore 2026-11-09T18:10:00
Expected output of a pass, with illustrative numbers:
messages received:        43640
duplicates (ignored):     0
series checked:           60
out-of-order steps:       0
gaps over 2500 ms:        0
buffered then delivered:  36000
RESULT: PASS
What each line means. No gaps means every second of every tag is present, including the outage window, so nothing was dropped. No out-of-order steps means the messages for each series arrived in the order they were measured. Buffered then delivered greater than zero means data timestamped during the outage was published only after the restore, so the buffer did the work. A few duplicates are normal and are not failures: Pub/Sub delivers at least once, and Part 3 makes the database inserts idempotent on (machine, tag, timestamp).
If a gap appears, the likely causes are the Request TTL expiring (check it is 5 h), the buffer limit being exceeded (check the Dashboard for dropped messages), or an EMQX restart during the outage (below).
9.3 What this test does not prove
- It proves a link outage, not a broker restart. EMQX’s own design note for its sink buffer says that when the buffer exceeds its segment size it spills to disk, but after a restart it discards the existing segments instead of resuming from them. That note is from 2022 and the current 6.3.1 documentation says nothing either way, so I cannot say the buffer survives a Pod restart. Assume it does not. To survive a restart, EMQX offers a Disk Log sink that can write the same rule output to files on the volume as a second action; replaying those files into Pub/Sub after a crash is a manual procedure that I did not build. Part 5 reruns this test with the Pod deleted to measure what is lost.
- It proves ordering in the lab only. Pub/Sub’s ordered delivery applies to messages published in the same region, and EMQX’s connector may reach Pub/Sub through the global endpoint; I could not confirm that it always lands in
asia-south1. The checker measures the result; it does not guarantee it. - It is 10 minutes, not 4 hours. The 4-hour figure follows from the buffer size and Request TTL settings, which are my estimates.
- It covers the Pub/Sub topic, not the database. The ingest subscription, with its dead-letter topic, is different: with both ordering and a dead-letter topic Pub/Sub’s ordering is best effort. Part 3 decides how the database ingest handles that.
Checkpoint 9. The checker prints RESULT: PASS for the lab outage, and you can say which of the four checks failed if it does not.
10. Troubleshooting, cost and cleanup
| Symptom | Likely cause | What to do |
|---|---|---|
Telegraf: BadSecurityChecksFailed or BadCertificateUntrusted |
A real server does not trust Telegraf’s client certificate | Copy telegraf-opcua-tls’s tls.crt into the server’s trusted store; the simulator accepts any, so this only appears on real servers |
BadCertificateUriInvalid |
The certificate’s URI SAN differs from the server’s application URI | The URI in the Certificate must be exactly urn:plant:sim:<kind>, and the server must report the same |
BadCertificateHostNameInvalid |
The endpoint host is not among the certificate’s DNS names | Use the service DNS names listed in the Certificate, or add the name |
BadSecurityPolicyRejected |
Telegraf’s policy is not offered by the server | The simulator offers Basic256Sha256 SignAndEncrypt only; match both settings |
Bad_CertificateTimeInvalid or “not yet valid” |
Clock drift between the VM, Pods and the issuer | timedatectl on the VM must say synchronised; fix NTP, then reissue the certificate |
| Source timestamps far from the Telegraf host’s time | A real controller’s clock has drifted | Compare the source and receipt time per message; if the machine clock is wrong, use timestamp = "gather" and record that in the evidence notes |
BadNodeIdUnknown |
The namespace index is not 2 | Browse the server, then use namespace_uri instead of ns=2 |
| MQTT connect fails with a TLS alert | The client has no certificate, or its issuer is not the plant CA | Check ca.crt in the client secret and the verify_peer setting |
| Publish appears to succeed but nothing is received | The ACL denies it and deny_action = ignore drops it silently |
Check the Dashboard’s authorization metrics; set deny_action = disconnect while debugging |
| Subscribe to a topic returns nothing | The ACL rule does not match the topic | Match the rule against plant/<site>/<area>/<machine>/<tag> exactly |
| Sink status is not Connected | No path to Google APIs or the metadata server | Run the metadata check in 8.4; confirm the allow-egress-google policy exists |
| Sink returns 403 | The service account lacks publisher on the topic, or the scope is missing | Check google_pubsub_topic_iam_member.edge_publisher and the VM’s cloud-platform scope |
| Gaps after the outage | Request TTL or buffer limit too small, or EMQX restarted | See 9.2 and 9.3 |
kubectl get akrii empty after the policies |
default is not allowed into ot-sim |
Check allow-opcua-in includes the default namespace |
Simulator Pods CrashLoopBackOff right after the policy |
pip install cannot reach the index |
Delete the ot-sim default-deny, wait for the Pods to start, then restore it |
Cost note
The overview estimated the running stack at about $1.13 an hour, which is my own arithmetic from published prices read on 8 November 2026. This part adds a 20 GB disk for EMQX on the edge VM and Pub/Sub traffic. At the lab’s 60 messages a second and roughly 260 bytes each, that is about 15 KB/s, or around 1.3 GB a day into the topic, and each subscription delivers that volume again. I did not recompute Pub/Sub charges for the volume; check the current pricing page and the free allowance. Delete the telemetry-check subscription when you are finished with the test, because it retains a day of messages.
Cleanup
# On the VM: remove the Part 2 workloads, keeping the k3s cluster and Cilium.
kubectl delete -f edge/telegraf/telegraf.yaml
kubectl delete -f edge/emqx/emqx.yaml            # the PVC remains; delete it to drop the data
kubectl -n mqtt delete pvc --all
for k in press dryer autoclave blister hvac coldstore; do
  KIND=$k envsubst < edge/ot-sim/template.yaml | kubectl delete -f -
done
kubectl delete -f edge/netpol.yaml
helm uninstall akri
kubectl delete crd instances.akri.sh configurations.akri.sh
helm uninstall cert-manager -n cert-manager
In the repository, remove google_pubsub_subscription.telemetry_check and its IAM binding in a pull request and let Atlantis apply it. The full teardown of the project is in Part 1’s cleanup block; run that last. Destroy at the end of the session unless you are going straight into Part 3.
What I could not test
- Nothing in this part ran. The simulator, certificates, Telegraf, EMQX and the checker were written from documentation and the tool briefs. Expect to fix small errors; the checkpoints are the test.
- asyncua: the
set_security_policy,load_certificateandload_private_keycalls come from the library’s published encryption example. TheDataValuewith a source timestamp,set_application_uriand the module path of its command-line tools are from memory of the API and are hedged in the code. I could not confirm which API enforces a client-certificate trust list in the version you install, so the simulator does not enforce one. - OPC UA certificate content: the key usages and URI subject alternative name follow the OPC UA application-certificate requirements as I know them; I did not check the specification text.
- Telegraf: the
inputs.opcua_listeneroptions and the MQTT output settings come from the brief. I did not run the generated 60-node configuration, did not confirm thatdefault_tagson a node reaches the topic template, and did not confirm the image tagtelegraf:1.40.2exists on Docker Hub. - EMQX configuration:
peer_cert_as_usernameandpeer_cert_as_clientidare named in the brief; their exact placement under the listener,durable_sessions, the file-based ACL path and theemqx.confoverride are from the brief and general EMQX knowledge, not from a 6.3.1 run. The SQL functionssplitandnthare used from memory. - The Pub/Sub sink: field names come from the EMQX Pub/Sub documentation page. Whether
5his an accepted Request TTL, whether the Dashboard labels match the 6.3.1 wording, and whether the REST export paths exist were not confirmed. - Buffering: the 2022 design note on offload and restart is from an EMQX pull request; I found no 6.3.1 documentation that states whether the sink buffer survives a restart. The drain rate (about 400 messages a second) and the buffer sizes are my estimates.
- Network: I did not verify that Cilium and k3s let a Pod reach the VM’s metadata server at 169.254.169.254, or that an ipBlock policy matches Google API addresses as expected.
- Ordering: the regional behaviour of the EMQX connector is unknown to me. With a dead-letter topic set, ordering on the ingest subscription is best effort per Google’s documentation.
- Scale: nothing was run above 60 tags. The overview’s 30,000-tag figure remains a design estimate.
- Nothing here is validated for a regulated plant. Validation, change control and the choice of retention periods belong to the company’s quality unit.
What comes next
Part 3: Store, Detect, Show moves to Google Cloud: the ingest subscription feeds TimescaleDB on CloudNativePG, Drasi detects the excursions the simulator schedules, and Perses and Loki show them. It also decides how the ingest handles Pub/Sub’s at-least-once delivery.
Briefs for the tools used here: Akri, Telegraf, EMQX, cert-manager, Kubernetes, k3s, Cilium, Atlantis and OpenTofu. The scenario and the full architecture are in the project overview, and the foundation this builds on is in Part 1.
Sources: EMQX: Ingest MQTT Data into GCP Pub/Sub, EMQX: Durable Sessions, EMQX replayq design note, EMQX pull request on buffer offload mode, Google Cloud: Order messages in Pub/Sub, opcua-asyncio encryption example (mirror).