This is Part 3 of the five-part build in the Sprint 4 project overview. Part 1 built the Google Cloud foundation and Part 2 got 60 simulated tags from 12 machines into the Pub/Sub topic plant-telemetry. This part is everything after the topic: store every reading, detect an excursion within 10 seconds, tell a person, and show the data on dashboards.
What this is and is not. This is engineering guidance, not legal or regulatory advice, and nothing here is validated or compliant on its own. I wrote every file from the tool briefs and current documentation. I did not run any of it against a live cluster, so there are no measured latencies in this post. Section 9 gives the method and the pass criterion; the numbers are yours to produce. The last section lists what I could not check.
What you build
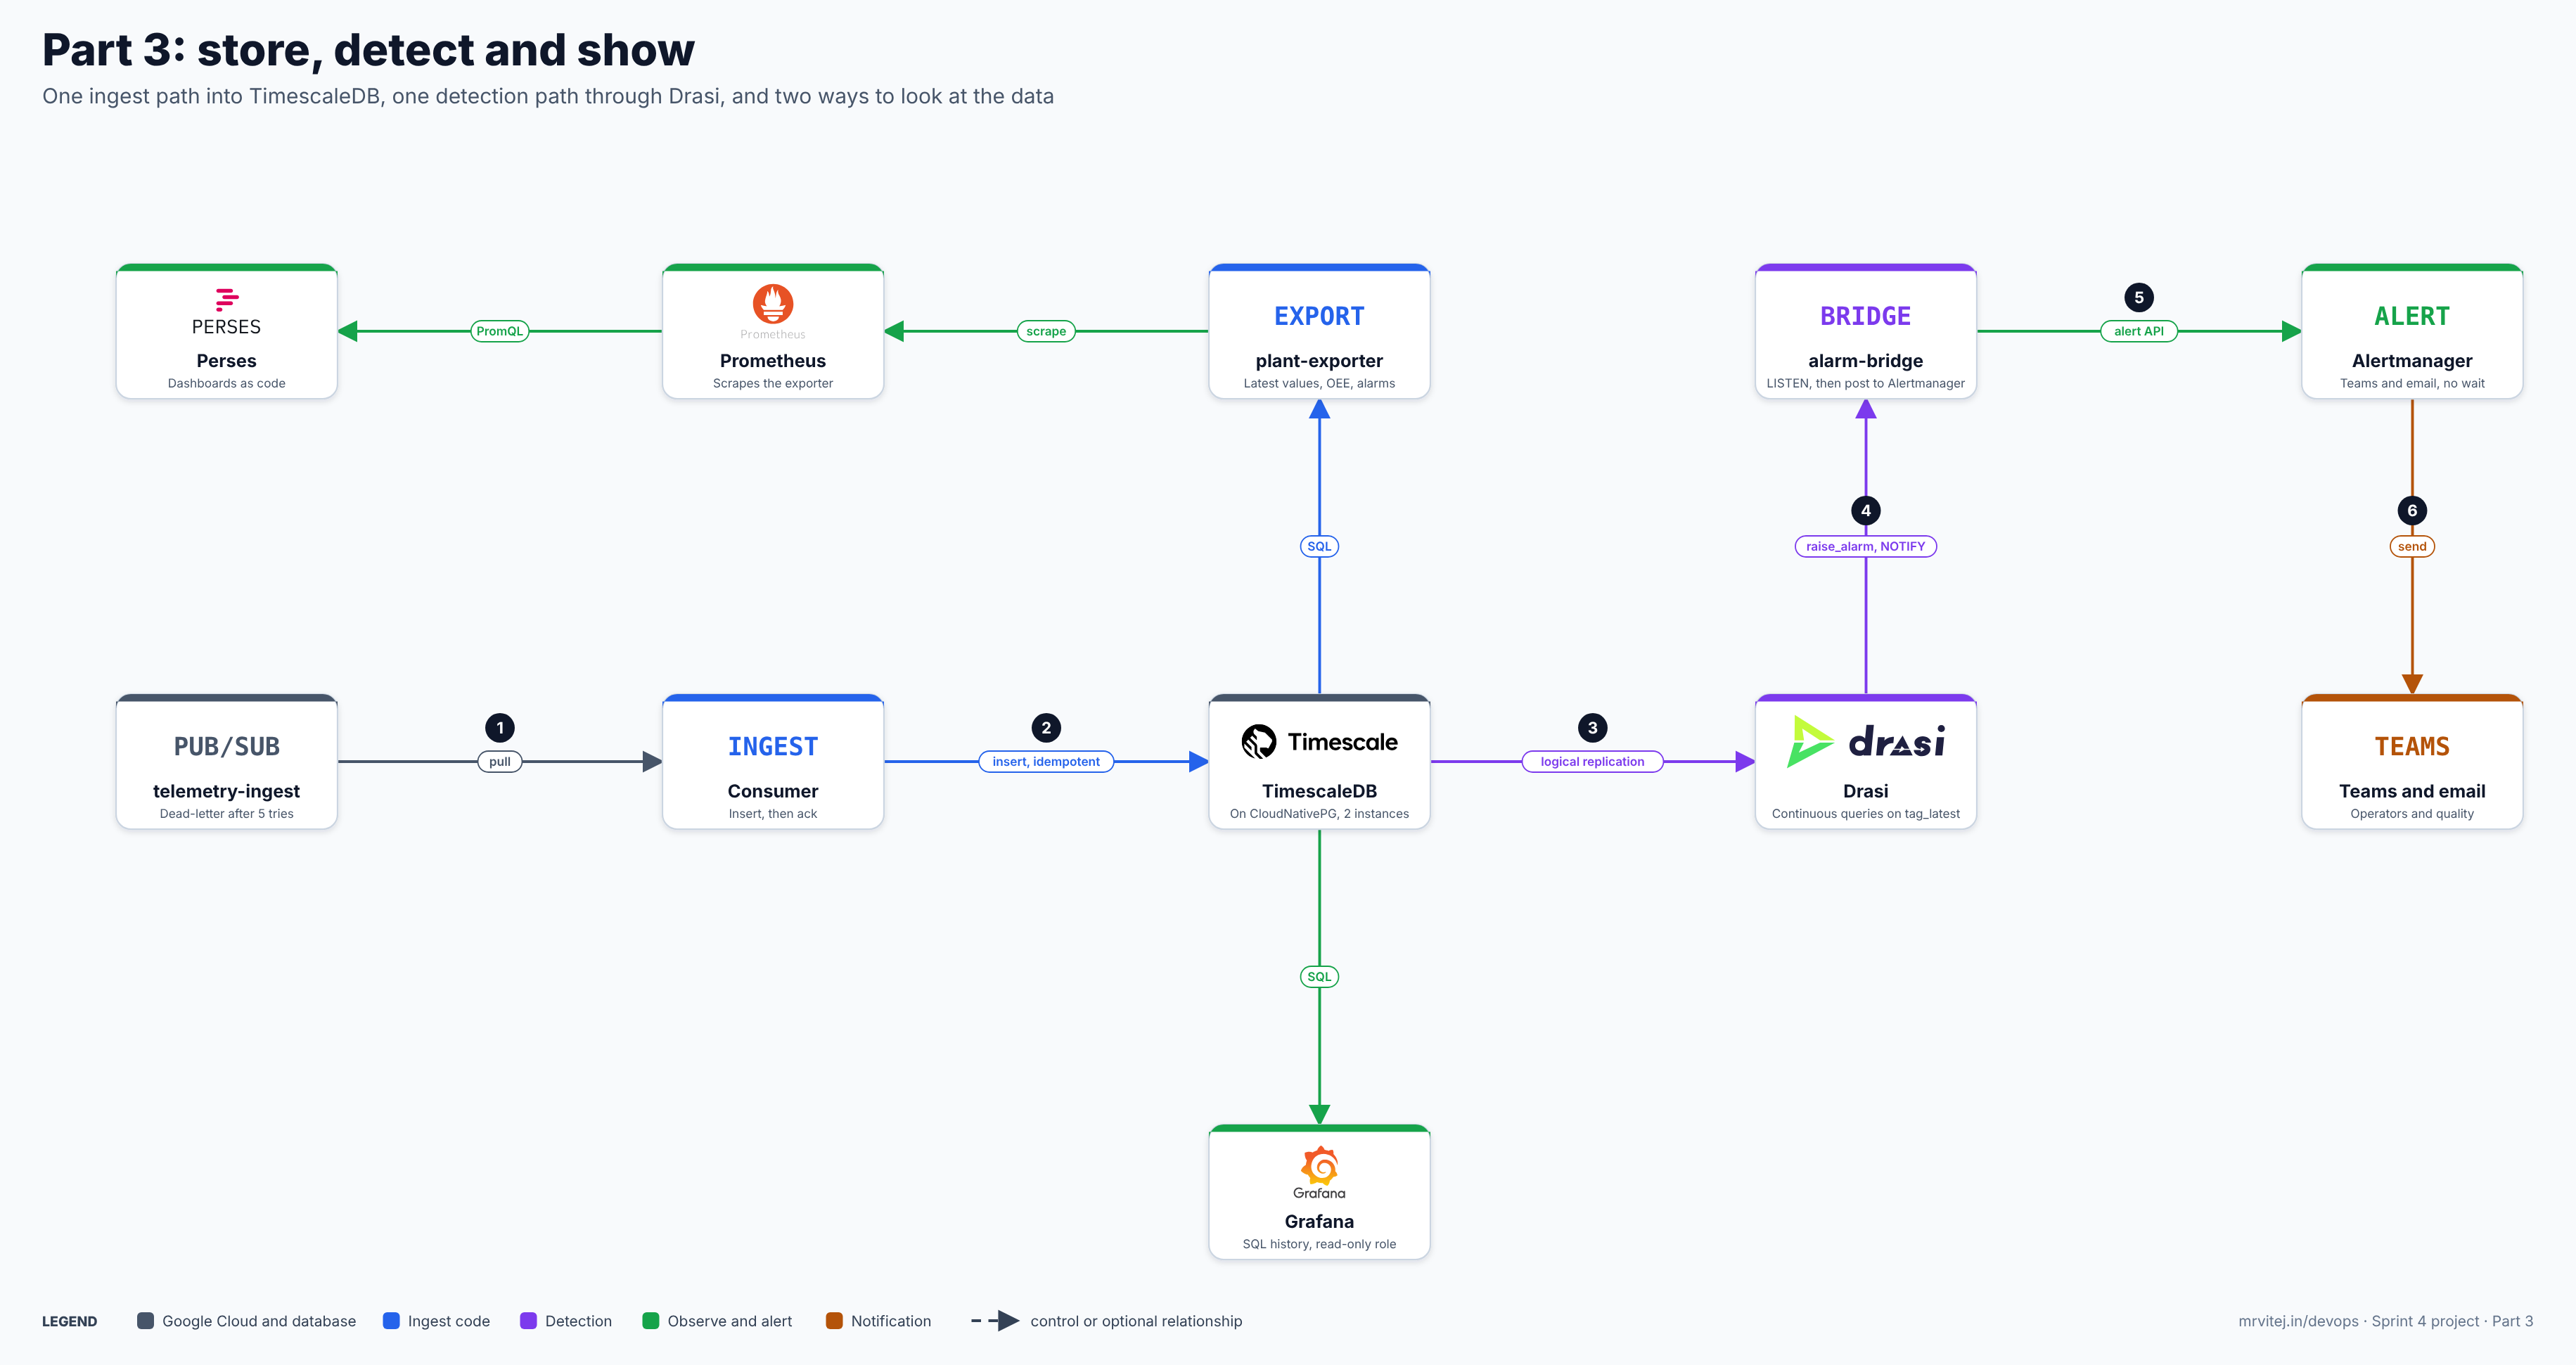
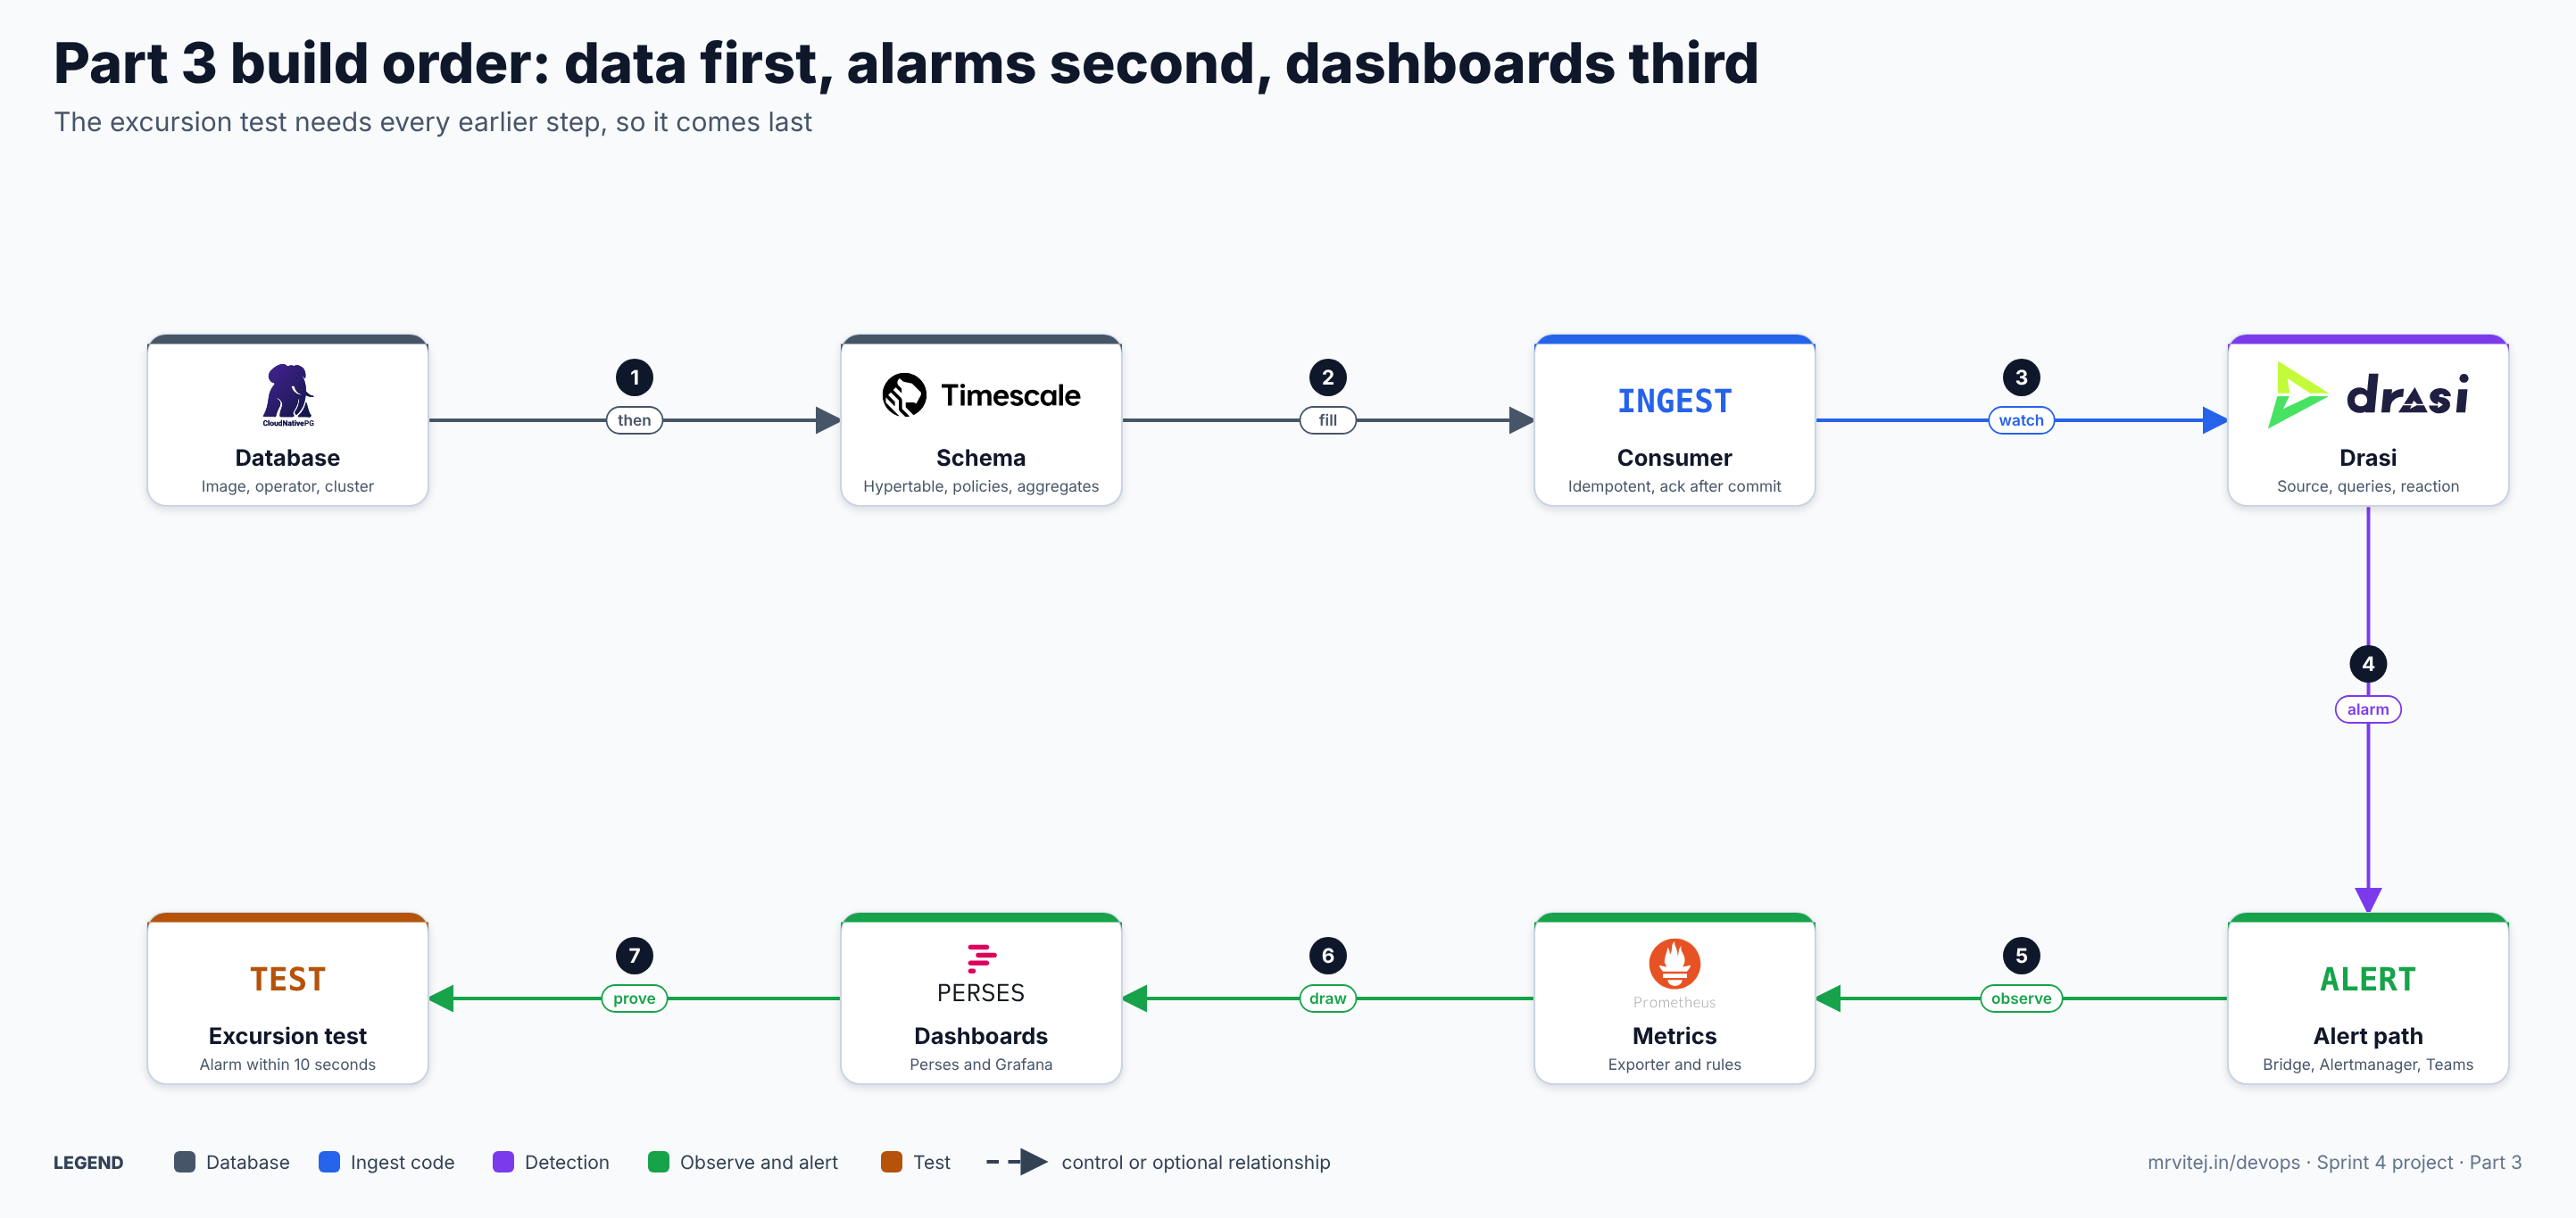
Four decisions shape the design, and each is explained where it appears:
- A small custom consumer, not Telegraf’s PostgreSQL output. Pub/Sub delivers at least once, so the insert must tolerate duplicates. I could not find
ON CONFLICThandling in Telegraf’s PostgreSQL output documentation, so I wrote 80 lines of Python where I control the SQL and the acknowledgement. - Drasi watches a plain table, not the hypertable. Hypertables and logical replication do not mix well, so the consumer also keeps a one-row-per-tag table,
tag_latest, and Drasi watches that. - Drasi has no Alertmanager reaction, and I found no first-party MQTT or Pub/Sub one either. The documented reactions that fit are Stored Procedure and Dapr pub/sub. I use Stored Procedure to write an
alarm_eventsrow, and a tiny bridge turns each row into an Alertmanager alert. - Perses has no PostgreSQL datasource in the documentation I read. Perses reads Prometheus, so a small exporter publishes the values that matter as metrics. Grafana, which does have a PostgreSQL datasource, covers the raw SQL history.
The sections:
- Prerequisites and versions
- The database: image, operator and cluster
- The schema: hypertable, compression, retention, aggregates
- The consumer
- Drasi: source, queries and reaction
- The alarm path: bridge, Alertmanager, Teams and email
- Exporter, Prometheus rules and dashboards
- An EMQX rule that still works when the link is down
- The excursion test
- Troubleshooting, cost and cleanup
1. Prerequisites and versions
| Item | Version | Source |
|---|---|---|
| Parts 1 and 2 complete | GKE plant-gke running, Pub/Sub subscription telemetry-ingest receiving messages, Atlantis working |
Part 1, Part 2 |
| TimescaleDB | 2.31.0, Community (TSL) edition. Check with SHOW timescaledb.license;, which must return timescale |
TimescaleDB brief |
| PostgreSQL | 18, from the CloudNativePG base image | CloudNativePG brief |
| CloudNativePG | 1.30 line, installed by Helm; pin the chart version after helm search repo cnpg (I did not confirm a patch version) |
CloudNativePG brief |
| Drasi for Kubernetes | Whatever drasi init installs; record drasi version |
Drasi brief |
| kube-prometheus-stack | Pin after helm search repo prometheus-community/kube-prometheus-stack; it brings Prometheus, Alertmanager and Grafana |
Prometheus brief |
| Perses | 0.54.0 line, Helm chart perses/perses, and the percli command line from the Perses releases page |
Perses brief |
| Python | 3.12 in the container image; psycopg[binary] 3.2 or newer, google-cloud-pubsub 2.x, prometheus-client |
below |
| Laptop tools | gcloud, kubectl, helm, docker, jq, openssl, Python 3.10+ with psycopg for the test script |
Set these in your shell. The project ID and region come from Part 1:
export CLOUD_PROJECT=plant-cloud-abc123        # your suffix
export REGION=asia-south1
export REPO=$REGION-docker.pkg.dev/$CLOUD_PROJECT/plant
gcloud container clusters get-credentials plant-gke --zone ${REGION}-a --project $CLOUD_PROJECT
kubectl get nodes
Use your real zone if Part 1 chose another. All nodes should be Ready.
New files in your repository, which this part adds:
platform/db/Dockerfile              TimescaleDB on the CloudNativePG base image
platform/db/cluster.yaml            the CloudNativePG Cluster
platform/db/schema.sql              tables, policies, procedures, trigger
platform/apps/Dockerfile            one image for consumer, bridge, exporter, sink
platform/apps/consumer.py
platform/apps/bridge.py
platform/apps/exporter.py
platform/apps/sink.py
platform/apps/apps.yaml             Deployments, ServiceAccount, Service, ServiceMonitor
platform/drasi/source.yaml          Drasi source
platform/drasi/queries.yaml         three continuous queries
platform/drasi/reaction.yaml        Stored Procedure reaction
platform/monitoring/values.yaml     kube-prometheus-stack values
platform/monitoring/rules.yaml      pipeline alert rules
platform/dashboards/perses/*.yaml   Perses project, datasource, three dashboards
platform/dashboards/grafana.yaml    Grafana dashboard ConfigMap
tools/measure_alarm.py              the latency measurement
Create the namespaces and the three database passwords. The passwords are random and live only in the cluster for now; Part 4 moves secrets to external-secrets and Secret Manager. Until then, treat these as lab credentials.
for ns in ingest cnpg-system plant-db drasi-system monitoring dashboards; do
  kubectl create namespace $ns --dry-run=client -o yaml | kubectl apply -f -
done

mkpw() { openssl rand -hex 16; }
for role in drasi reader; do
  kubectl -n plant-db create secret generic plant-db-$role \
    --type=kubernetes.io/basic-auth \
    --from-literal=username=$role --from-literal=password=$(mkpw)
  kubectl -n plant-db label secret plant-db-$role cnpg.io/reload=true
done
CloudNativePG’s managed roles read a kubernetes.io/basic-auth secret with username and password, which is why the type is set. The cnpg.io/reload label makes the operator pick up changes.
Checkpoint 1. kubectl get ns lists the six namespaces, and kubectl -n plant-db get secret shows plant-db-drasi and plant-db-reader.
2. The database: image, operator and cluster
2.1 The image
The stock CloudNativePG image has no TimescaleDB. There are two routes: CloudNativePG’s extension containers, and a custom image. The Tiger Data page on CloudNativePG describes the extension-container route, but it names the OSS extension container, and the open-source licence (Apache) build lacks compression and continuous aggregates, which this part needs. So build an image from the CloudNativePG base with the Community package. CloudNativePG expects images to run as a non-root user (UID 26) and does not run the Docker image’s init scripts, so do not use the timescale/timescaledb Docker image.
platform/db/Dockerfile:
FROM ghcr.io/cloudnative-pg/postgresql:18
USER root
RUN set -eux; \
    apt-get update; \
    apt-get install -y --no-install-recommends curl gnupg ca-certificates; \
    . /etc/os-release; \
    curl -fsSL https://packagecloud.io/timescale/timescaledb/gpgkey \
      | gpg --dearmor -o /usr/share/keyrings/timescaledb.gpg; \
    echo "deb [signed-by=/usr/share/keyrings/timescaledb.gpg] https://packagecloud.io/timescale/timescaledb/debian/ ${VERSION_CODENAME} main" \
      > /etc/apt/sources.list.d/timescaledb.list; \
    apt-get update; \
    apt-get install -y --no-install-recommends timescaledb-2-postgresql-18; \
    apt-get purge -y curl gnupg; apt-get autoremove -y; \
    rm -rf /var/lib/apt/lists/*
USER 26
The package timescaledb-2-postgresql-18 is the Community build; the -oss suffix is the Apache one, so avoid it. To pin 2.31.0, run apt-cache policy timescaledb-2-postgresql-18 in the base image and add the exact version string to the install line.
gcloud auth configure-docker $REGION-docker.pkg.dev --quiet
docker build -t $REPO/timescaledb-cnpg:18-ts2.31.0 platform/db
docker push $REPO/timescaledb-cnpg:18-ts2.31.0
The tag format matters: CloudNativePG reads the PostgreSQL version from the image tag, and a write-up on running TimescaleDB on EKS says a tag that does not look like a PostgreSQL version fails validation. If the operator rejects 18-ts2.31.0, use 18.<minor>-ts2.31.0 with the real minor version from docker run --rm $REPO/timescaledb-cnpg:18-ts2.31.0 postgres --version.
GKE nodes must be allowed to pull from Artifact Registry: the node service account needs roles/artifactregistry.reader on the repository. Part 1 created the repository; if a Pod later shows ImagePullBackOff, grant that role.
2.2 The operator
helm repo add cnpg https://cloudnative-pg.github.io/charts
helm repo update
helm upgrade --install cnpg cnpg/cloudnative-pg --namespace cnpg-system --create-namespace
kubectl -n cnpg-system rollout status deploy/cnpg-cloudnative-pg
2.3 The cluster
platform/db/cluster.yaml:
apiVersion: postgresql.cnpg.io/v1
kind: Cluster
metadata:
  name: plant-db
  namespace: plant-db
spec:
  instances: 2
  imageName: asia-south1-docker.pkg.dev/plant-cloud-abc123/plant/timescaledb-cnpg:18-ts2.31.0
  storage:
    size: 20Gi
    storageClass: premium-rwo
  resources:
    requests: { cpu: "1", memory: 2Gi }
    limits:   { memory: 4Gi }
  postgresql:
    shared_preload_libraries:
      - timescaledb
    parameters:
      wal_level: logical
      timescaledb.telemetry_level: "off"
      max_locks_per_transaction: "128"
      shared_buffers: 512MB
  bootstrap:
    initdb:
      database: plant
      owner: plant
      postInitApplicationSQL:
        - CREATE EXTENSION IF NOT EXISTS timescaledb
  managed:
    roles:
      - name: drasi
        ensure: present
        login: true
        replication: true
        passwordSecret: { name: plant-db-drasi }
      - name: reader
        ensure: present
        login: true
        passwordSecret: { name: plant-db-reader }
  monitoring:
    enablePodMonitor: true
Replace the project ID in imageName. What each part does:
shared_preload_libraries: [timescaledb]must load at server start. CloudNativePG rejects the rawshared_preload_librariesparameter and wants this dedicated field.wal_level: logicalis what Drasi’s PostgreSQL source needs. CloudNativePG setswal_levelitself unless you override it; this is the override.drasiwithreplication: trueis the role Drasi connects as. The brief lists REPLICATION and SELECT as the source’s requirements; theSELECTgrant is in the schema file.readeris a login role with no privileges yet; the schema gives itSELECTonly. Grafana and the exporter use it.- Two instances give a replica for the read-only service
plant-db-ro. This is availability for the lab, not a tested failover; see the last section for what logical replication does at failover. - There is no backup configured here. The overview put backups and restore evidence in the data-integrity work of Part 4, so until then this database has a replica and nothing else.
kubectl apply -f platform/db/cluster.yaml
kubectl -n plant-db get cluster plant-db -w
Wait for Cluster in healthy state and two ready instances (a few minutes). Then check the two things that most often go wrong:
kubectl -n plant-db exec plant-db-1 -c postgres -- psql -U postgres -d plant -Atc "SHOW timescaledb.license; SHOW wal_level; SELECT extversion FROM pg_extension WHERE extname='timescaledb';"Expected (shape, not captured output):
timescale
logical
2.31.0
Checkpoint 2. The license is timescale (not apache), wal_level is logical, and the extension version is 2.31.0. If the license says apache, you installed the OSS package; rebuild the image.
3. The schema: hypertable, compression, retention, aggregates
Two rules from the overview apply here: the raw reading is stored unchanged and derived values go in separate tables, and inserts are idempotent on tag and timestamp.
platform/db/schema.sql (the periods are lab placeholders; real retention is a records decision for the quality unit):
SET ROLE plant;

-- 1. The raw readings. Never updated, never rewritten.
CREATE TABLE readings (
  time        timestamptz      NOT NULL,           -- source timestamp from the machine
  machine     text             NOT NULL,
  tag         text             NOT NULL,
  area        text             NOT NULL,
  value       double precision,
  unit        text,
  quality     text             NOT NULL,           -- OPC UA status text, kept as received
  received_at timestamptz      NOT NULL DEFAULT now()
) WITH (
  tsdb.hypertable,
  tsdb.partition_column = 'time',
  tsdb.chunk_interval   = '1 day',
  tsdb.segmentby        = 'machine, tag',
  tsdb.orderby          = 'time DESC'
);

-- Idempotency: one reading per machine, tag and source time.
CREATE UNIQUE INDEX readings_uniq ON readings (machine, tag, time);

-- Compress chunks older than two days (the automatic policy, if present, is replaced).
CALL remove_columnstore_policy('readings', if_exists => true);
CALL add_columnstore_policy('readings', after => INTERVAL '2 days');

-- Drop raw chunks after 30 days (placeholder).
SELECT add_retention_policy('readings', drop_after => INTERVAL '30 days');

-- 2. One-minute summary, kept for a year.
CREATE MATERIALIZED VIEW readings_1m
WITH (timescaledb.continuous) AS
SELECT time_bucket('1 minute', time) AS bucket,
       machine, tag, area,
       avg(value) AS avg_value,
       min(value) AS min_value,
       max(value) AS max_value,
       last(value, time) AS last_value,
       count(*)   AS samples
FROM readings
GROUP BY bucket, machine, tag, area
WITH NO DATA;

SELECT add_continuous_aggregate_policy('readings_1m',
  start_offset      => INTERVAL '2 hours',
  end_offset        => INTERVAL '1 minute',
  schedule_interval => INTERVAL '1 minute');

SELECT add_retention_policy('readings_1m', drop_after => INTERVAL '400 days');

-- 3. The latest value per tag. A plain table: Drasi watches this one.
CREATE TABLE tag_latest (
  machine text NOT NULL,
  tag     text NOT NULL,
  area    text NOT NULL,
  time    timestamptz NOT NULL,
  value   double precision,
  unit    text,
  quality text NOT NULL,
  PRIMARY KEY (machine, tag)
);
ALTER TABLE tag_latest REPLICA IDENTITY FULL;

-- 4. Alarm events: append-only by convention (Part 4 enforces it).
CREATE TABLE alarm_events (
  id          bigserial PRIMARY KEY,
  rule        text NOT NULL,
  machine     text NOT NULL,
  tag         text NOT NULL,
  state       text NOT NULL CHECK (state IN ('raised', 'cleared')),
  value       double precision,
  reading_ts  timestamptz,                         -- source time of the reading that tripped the rule
  detected_at timestamptz NOT NULL DEFAULT now()
);

-- Drasi passes every value as text; the procedure casts.
CREATE PROCEDURE raise_alarm(p_rule text, p_machine text, p_tag text, p_value text, p_ts text)
LANGUAGE sql AS $$
  INSERT INTO alarm_events (rule, machine, tag, state, value, reading_ts)
  VALUES (p_rule, p_machine, p_tag, 'raised', p_value::double precision, p_ts::timestamptz);
$$;

CREATE PROCEDURE clear_alarm(p_rule text, p_machine text, p_tag text, p_value text, p_ts text)
LANGUAGE sql AS $$
  INSERT INTO alarm_events (rule, machine, tag, state, value, reading_ts)
  VALUES (p_rule, p_machine, p_tag, 'cleared', p_value::double precision, p_ts::timestamptz);
$$;

-- A NOTIFY wakes the bridge. The table is the record; the notification is only a nudge.
CREATE FUNCTION notify_alarm() RETURNS trigger LANGUAGE plpgsql AS $$
BEGIN
  PERFORM pg_notify('plant_alarm', NEW.id::text);
  RETURN NEW;
END $$;
CREATE TRIGGER alarm_notify AFTER INSERT ON alarm_events
  FOR EACH ROW EXECUTE FUNCTION notify_alarm();

-- 5. A derived view, separate from the raw data. See the note below on what it is.
CREATE VIEW oee_blister_last_hour AS
WITH m AS (
  SELECT machine, bucket, avg_value FROM readings_1m
  WHERE tag = 'LineSpeed' AND bucket >= now() - INTERVAL '1 hour'
), ref AS (
  SELECT machine, max(max_value) AS ref_speed FROM readings_1m
  WHERE tag = 'LineSpeed' AND bucket >= now() - INTERVAL '7 days'
  GROUP BY machine
)
SELECT m.machine,
       count(*) FILTER (WHERE m.avg_value > 0)::double precision / 60 AS availability,
       coalesce(avg(m.avg_value) FILTER (WHERE m.avg_value > 0) / NULLIF(ref.ref_speed, 0), 0) AS performance
FROM m JOIN ref USING (machine)
GROUP BY m.machine, ref.ref_speed;

-- 6. Publication for Drasi, and read access.
CREATE PUBLICATION drasi_pub FOR TABLE tag_latest;
GRANT SELECT ON tag_latest TO drasi;
GRANT SELECT ON ALL TABLES IN SCHEMA public TO reader;
ALTER DEFAULT PRIVILEGES IN SCHEMA public GRANT SELECT ON TABLES TO reader;
The design choices, one by one:
- Source time, not arrival time, is the key.
timeis the machine’s timestamp;received_atrecords when the row arrived. The unique index on(machine, tag, time)includes the partition column, as TimescaleDB requires. - Duplicates after compression. The unique index is enforced against rows in uncompressed chunks cheaply. A Pub/Sub redelivery arrives within minutes to hours, long before the two-day compression delay, so the conflict check hits uncompressed data. A message delayed past two days (the subscription retains seven) would be checked against compressed data, which is slower and has restrictions in TimescaleDB; I did not test that path.
readings_1mafter an outage. The refresh window looks back two hours. After a link outage longer than that, the backfilled readings fall outside it, so runCALL refresh_continuous_aggregate('readings_1m', now() - INTERVAL '1 day', now());once the data has drained. Real-time aggregation is off by default for aggregates made on 2.13 or later, so the newest minute is not in the view until its refresh.tag_latestis separate because the overview’s “original” rule says the raw record is never touched, and because Drasi needs a small plain table. The consumer upserts it only when the new reading is newer.- Publication. I created
drasi_pubfortag_latestonly. I could not confirm from the documentation I could reach whether the Drasi source creates its own publication or uses one that exists. If the source logs that it created one, drop mine; if it asks for a name, give it this one. Either way, do not publish the hypertable. - Procedures take text. I could not confirm how Drasi types the values it passes, so every parameter is text and the procedure casts. The
@names in the reaction must match theRETURNaliases in the queries. - Alarm rows come from Drasi, not the consumer. Detection is in the Drasi queries; nothing else writes
alarm_events. - The OEE view is illustrative. Availability is the share of the last 60 minutes with a
LineSpeedabove zero; performance is average speed against the highest speed seen in seven days. Quality is not computable from the lab tags (there is no good-count to set against theRejectCount), so the dashboard shows availability times performance and says so. Two more caveats: a minute with no data counts as down, which cannot tell a link outage from a stopped machine, and the simulator never stops the line, so the number is near 100 percent. A real OEE needs a machine-state tag.
Apply it as the database superuser, with SET ROLE plant at the top so the owner is the application role:
kubectl -n plant-db exec -i plant-db-1 -c postgres -- \
  psql -U postgres -d plant -v ON_ERROR_STOP=1 < platform/db/schema.sql
Check it:
kubectl -n plant-db exec plant-db-1 -c postgres -- psql -U postgres -d plant -c "SELECT hypertable_name FROM timescaledb_information.hypertables;" -c "SELECT proc_name, job_id FROM timescaledb_information.jobs ORDER BY job_id;" -c "\dp tag_latest"Expected (shape): readings listed as a hypertable; jobs for the columnstore policy, two retention policies and one continuous-aggregate refresh; tag_latest shows drasi=r/plant.
Checkpoint 3. The hypertable exists, the policy jobs are listed, and INSERT of the same (machine, tag, time) twice by hand, with ON CONFLICT DO NOTHING, leaves one row. If CALL remove_columnstore_policy errors on your version, the function or its if_exists argument differs; delete that line and use add_columnstore_policy alone.
4. The consumer
4.1 Why a custom consumer
Telegraf has inputs.cloud_pubsub and a PostgreSQL output, and it acknowledges a message only after the outputs accept it. That is almost right. The gap is duplicates: the PostgreSQL output’s documented options are table templates and column handling, and I found no way to say ON CONFLICT DO NOTHING. A unique index plus a redelivered message would then fail the batch, and Telegraf would retry it, which is a poison loop. The cleaner fix is to own the SQL. The consumer also writes tag_latest in the same transaction, which Telegraf’s output cannot do.
4.2 The code
platform/apps/consumer.py:
"""Pull from Pub/Sub, insert idempotently, acknowledge after commit."""
import json, logging, os, sys, time
from datetime import datetime, timezone

import psycopg
from google.api_core import exceptions as gexc
from google.cloud import pubsub_v1

SUB = os.environ["SUBSCRIPTION"]          # projects/<p>/subscriptions/telemetry-ingest
DSN = os.environ["DATABASE_URL"]
BATCH = int(os.getenv("BATCH", "500"))

log = logging.getLogger("consumer")
logging.basicConfig(level=logging.INFO, format="%(asctime)s %(levelname)s %(message)s")

INSERT_READING = """
INSERT INTO readings (time, machine, tag, area, value, unit, quality)
VALUES (%s, %s, %s, %s, %s, %s, %s)
ON CONFLICT (machine, tag, time) DO NOTHING
"""

UPSERT_LATEST = """
INSERT INTO tag_latest (machine, tag, area, time, value, unit, quality)
VALUES (%s, %s, %s, %s, %s, %s, %s)
ON CONFLICT (machine, tag) DO UPDATE
   SET area = EXCLUDED.area, time = EXCLUDED.time, value = EXCLUDED.value,
       unit = EXCLUDED.unit, quality = EXCLUDED.quality
 WHERE tag_latest.time < EXCLUDED.time
"""


def parse(data: bytes):
    m = json.loads(data)
    t, f = m["tags"], m["fields"]
    tag = t["tag"]
    value = f.get(tag)
    if value is not None:
        value = float(value)                       # booleans become 0.0 / 1.0
    ts = datetime.fromtimestamp(m["timestamp"] / 1000, tz=timezone.utc)  # milliseconds, as in Part 2
    return (ts, t["machine"], tag, t["area"], value, t.get("unit"), f.get("Quality", "unknown"))


def main():
    sub = pubsub_v1.SubscriberClient()
    conn = psycopg.connect(DSN)
    log.info("started, subscription=%s", SUB)
    while True:
        try:
            resp = sub.pull(request={"subscription": SUB, "max_messages": BATCH}, timeout=30)
        except gexc.DeadlineExceeded:
            continue
        except gexc.ServiceUnavailable:
            time.sleep(2)
            continue
        if not resp.received_messages:
            continue

        rows, good_ids, bad = [], [], 0
        for rm in resp.received_messages:
            try:
                rows.append(parse(rm.message.data))
                good_ids.append(rm.ack_id)
            except Exception as e:                  # poison message: do not ack, it will reach the DLQ
                bad += 1
                log.error("unparseable message %s: %s", rm.message.message_id, e)

        try:
            with conn.transaction():
                with conn.cursor() as cur:
                    cur.executemany(INSERT_READING, rows)
                    cur.executemany(UPSERT_LATEST, rows)
        except psycopg.Error as e:
            log.error("database error, nothing acknowledged: %s", e)
            conn.close()
            time.sleep(2)
            conn = psycopg.connect(DSN)
            continue

        if good_ids:
            sub.acknowledge(request={"subscription": SUB, "ack_ids": good_ids})
        log.info("committed=%d poison=%d", len(good_ids), bad)


if __name__ == "__main__":
    sys.exit(main())
What it guarantees, and what it does not:
- Ack after commit. If the process dies between the commit and the acknowledgement, Pub/Sub redelivers, and
ON CONFLICT DO NOTHINGmakes the second insert a no-op. TheWHERE tag_latest.time < EXCLUDED.timeguard keeps a late or repeated message from movingtag_latestbackwards. - Order does not matter here, because the key is the source time. That is why
telemetry-ingestneeds no ordering key to be correct (Part 2 explains the ordering test on a separate subscription). - Poison messages are not acknowledged. After five delivery attempts the subscription’s dead-letter policy moves them to
plant-telemetry-dlq. - Throughput. Unary
pullin a loop is the simplest correct form. At the lab’s 60 messages a second it is more than enough; a streaming pull would be the next step at higher rates. I did not measure it.
4.3 One image for all the apps, and the deployment
The bridge, exporter and test sink share an image with the consumer. platform/apps/Dockerfile:
FROM python:3.12-slim
RUN pip install --no-cache-dir "psycopg[binary]>=3.2,<4" "google-cloud-pubsub>=2,<3" "prometheus-client>=0.20"
WORKDIR /app
COPY consumer.py bridge.py exporter.py sink.py /app/
USER 10001
docker build -t $REPO/plant-apps:1 platform/apps && docker push $REPO/plant-apps:1Copy the database credentials into the namespaces that need them. The operator creates plant-db-app, with a ready-made connection URI:
copy_secret() {  # name, from-ns, to-ns
  kubectl -n $2 get secret $1 -o json \
   | jq 'del(.metadata.namespace,.metadata.uid,.metadata.resourceVersion,.metadata.creationTimestamp,.metadata.ownerReferences,.metadata.labels,.metadata.annotations)' \
   | kubectl -n $3 apply -f -
}
copy_secret plant-db-app    plant-db ingest
copy_secret plant-db-reader plant-db monitoring
copy_secret plant-db-drasi  plant-db drasi-system
platform/apps/apps.yaml starts with the consumer. The ServiceAccount name telegraf is the name Part 1 bound to the Google service account plant-ingest, which already has the subscriber role; the name is a leftover from the first design and is renamed in a later pull request. (If Part 1’s binding used a different name, use that one.) The other Deployments are added in the sections where they are written.
apiVersion: v1
kind: ServiceAccount
metadata:
  name: telegraf
  namespace: ingest
  annotations:
    iam.gke.io/gcp-service-account: plant-ingest@plant-cloud-abc123.iam.gserviceaccount.com
---
apiVersion: apps/v1
kind: Deployment
metadata: { name: consumer, namespace: ingest }
spec:
  replicas: 2                     # two consumers share one subscription; duplicates are harmless
  selector: { matchLabels: { app: consumer } }
  template:
    metadata: { labels: { app: consumer } }
    spec:
      serviceAccountName: telegraf
      containers:
        - name: consumer
          image: asia-south1-docker.pkg.dev/plant-cloud-abc123/plant/plant-apps:1
          command: ["python", "/app/consumer.py"]
          env:
            - name: SUBSCRIPTION
              value: projects/plant-cloud-abc123/subscriptions/telemetry-ingest
            - name: DATABASE_URL
              valueFrom: { secretKeyRef: { name: plant-db-app, key: uri } }
          resources:
            requests: { cpu: 100m, memory: 128Mi }
            limits:   { memory: 256Mi }
Replace the project ID in both places. Apply it, then watch the data arrive:
kubectl apply -f platform/apps/apps.yaml
kubectl -n ingest logs deploy/consumer --tail=5
kubectl -n plant-db exec plant-db-1 -c postgres -- psql -U postgres -d plant -c \
 "SELECT count(*), max(time), now()-max(time) AS age FROM readings;" -c \
 "SELECT machine, tag, value, time FROM tag_latest ORDER BY machine, tag LIMIT 5;"
Expected (shape): log lines such as committed=7 poison=0 several times a second; count rising by about 60 a second; age of a second or two; five rows from tag_latest.
The duplicate test, which proves idempotency. Pull the same message twice into the table by replaying one row:
kubectl -n plant-db exec plant-db-1 -c postgres -- psql -U postgres -d plant -c \
 "INSERT INTO readings (time,machine,tag,area,value,unit,quality) SELECT time,machine,tag,area,value,unit,quality FROM readings ORDER BY time DESC LIMIT 1 ON CONFLICT (machine,tag,time) DO NOTHING;"
It prints INSERT 0 0.
Checkpoint 4. readings grows at about 60 rows a second; tag_latest holds 60 rows (12 machines, five tags each); the replay prints INSERT 0 0; and gcloud pubsub subscriptions pull telemetry-ingest --project $CLOUD_PROJECT --limit 1 returns nothing new unacknowledged (the backlog is not growing). Check the subscription’s backlog in the console as well; the consumer should hold it near zero.
5. Drasi: source, queries and reaction
5.1 Install Drasi
# Install the Drasi CLI from the instructions at drasi.io, then:
drasi init
kubectl -n drasi-system get pods
drasi init installs the control plane into drasi-system, along with the components it depends on (Dapr, Redis and MongoDB in the version I read about). Wait for the Pods to become Running. Drasi is a sizeable add-on for a three-node lab cluster; check kubectl top nodes before and after.
5.2 The source
platform/drasi/source.yaml:
apiVersion: v1
kind: Source
name: plant-db
spec:
  kind: PostgreSQL
  properties:
    host: plant-db-rw.plant-db.svc.cluster.local
    port: 5432
    user: drasi
    password:
      kind: Secret
      name: plant-db-drasi
      key: password
    database: plant
    ssl: false
    tables:
      - public.tag_latest
Rows of tag_latest become graph nodes labelled tag_latest. ssl: false is a lab shortcut: CloudNativePG serves TLS, and Part 4 turns verification on. The secret plant-db-drasi sits in drasi-system, where the source runs; that is why you copied it there.
drasi apply -f platform/drasi/source.yaml
drasi wait -f platform/drasi/source.yaml -t 120
drasi list source
Expected (shape): plant-db with status Available. Then confirm Postgres sees the replication slot:
kubectl -n plant-db exec plant-db-1 -c postgres -- psql -U postgres -d plant -c "SELECT slot_name, plugin, active FROM pg_replication_slots;"A logical slot owned by Drasi, active = t, is the proof the source is streaming. Warning: an unused logical slot makes PostgreSQL retain WAL without limit. If you stop Drasi for days, drop the slot (cleanup section), or the volume fills.
5.3 The queries
Three rules, one per excursion the simulator schedules on the first machine of each type. The thresholds are lab values chosen for the simulator’s nominal numbers (autoclave chamber 121 °C, cleanroom differential pressure 12.5 Pa, cold store 5 °C), not process limits. Setting real limits is the quality unit’s job.
platform/drasi/queries.yaml:
apiVersion: v1
kind: ContinuousQuery
name: autoclave-low-temp
spec:
  mode: query
  sources:
    subscriptions:
      - id: plant-db
  query: >
    MATCH (t:tag_latest)
    WHERE t.tag = 'ChamberTemp'
      AND drasi.trueFor(t.value < 119.0, duration({seconds: 3}))
    RETURN 'autoclave-low-temp' AS rule, t.machine AS machine, t.tag AS tag,
           t.value AS value, t.time AS ts
---
apiVersion: v1
kind: ContinuousQuery
name: hvac-low-diffpressure
spec:
  mode: query
  sources:
    subscriptions:
      - id: plant-db
  query: >
    MATCH (t:tag_latest)
    WHERE t.tag = 'DiffPressure'
      AND drasi.trueFor(t.value < 8.0, duration({seconds: 3}))
    RETURN 'hvac-low-diffpressure' AS rule, t.machine AS machine, t.tag AS tag,
           t.value AS value, t.time AS ts
---
apiVersion: v1
kind: ContinuousQuery
name: coldstore-high-temp
spec:
  mode: query
  sources:
    subscriptions:
      - id: plant-db
  query: >
    MATCH (t:tag_latest)
    WHERE t.tag = 'Temp'
      AND drasi.trueFor(t.value > 8.0, duration({seconds: 3}))
    RETURN 'coldstore-high-temp' AS rule, t.machine AS machine, t.tag AS tag,
           t.value AS value, t.time AS ts
How they work. drasi.trueFor(condition, duration) is true only after the condition has held for that long without a break; the row then enters the result set (an “added” result). When the condition ends, the row leaves it (a “deleted” result). A reading that dips for one sample never fires, which is the debounce that keeps a noisy sensor from paging anyone. The cost is the 3 seconds, which comes straight out of the 10-second budget in section 9.
The tag names are unique to one kind of machine (Temp is the cold store only; the cleanroom’s temperature is RoomTemp), so no machine filter is needed. Each node is evaluated on its own, so Autoclave01 and Autoclave02 are independent.
Drasi’s query language supports MATCH, WHERE, RETURN, WITH and aggregates, but not ORDER BY, LIMIT or DISTINCT, so these queries use none of them. The literal 'autoclave-low-temp' AS rule in RETURN is the one construct I could not confirm; if the query fails to start, drop the literal and give each query its own reaction with the rule name fixed in the command (section 10).
drasi apply -f platform/drasi/queries.yaml
drasi wait -f platform/drasi/queries.yaml -t 120
drasi list query
5.4 The reaction
platform/drasi/reaction.yaml:
apiVersion: v1
kind: Reaction
name: plant-alarm
spec:
  kind: StoredProc
  queries:
    autoclave-low-temp:
    hvac-low-diffpressure:
    coldstore-high-temp:
  properties:
    databaseClient: pg
    databaseHostname: plant-db-rw.plant-db.svc.cluster.local
    databasePort: 5432
    databaseUser: plant
    databaseDbname: plant
    databasePassword:
      kind: Secret
      name: plant-db-app
      key: password
    databaseSsl: false
    addedResultCommand: public.raise_alarm(@rule, @machine, @tag, @value, @ts)
    deletedResultCommand: public.clear_alarm(@rule, @machine, @tag, @value, @ts)
The property names follow the Drasi Stored Procedure how-to (client pg, hostname, port, user, databaseDbname, password as a secret reference, databaseSsl, and @field names in the commands). The reaction connects as the application owner plant, which is more privilege than it needs; Part 4 gives it a role that can only execute the two procedures. Copy that secret too:
copy_secret plant-db-app plant-db drasi-system
drasi apply -f platform/drasi/reaction.yaml
drasi wait -f platform/drasi/reaction.yaml -t 120
drasi list reaction
Now prove the chain without waiting 5 minutes for the simulator. Check that a query reports no results (no excursion is running), then force one row into the source table and watch it:
kubectl -n plant-db exec plant-db-1 -c postgres -- psql -U postgres -d plant -c \
 "UPDATE tag_latest SET value = 100, time = now() WHERE machine='Autoclave01' AND tag='ChamberTemp';"
sleep 5
kubectl -n plant-db exec plant-db-1 -c postgres -- psql -U postgres -d plant -c \
 "SELECT id, rule, machine, state, value, detected_at FROM alarm_events ORDER BY id DESC LIMIT 5;"
The consumer rewrites that row about once a second with the real value, so the forced 100 lasts under a second and the 3-second hold never completes; this check therefore does not fire an alarm, and that is the point of trueFor. To exercise the reaction itself, call the procedure directly and confirm the NOTIFY trigger works:
kubectl -n plant-db exec plant-db-1 -c postgres -- psql -U postgres -d plant -c \
 "CALL raise_alarm('manual-test','Autoclave01','ChamberTemp','100','2026-11-10T06:00:00+05:30');" -c \
 "CALL clear_alarm('manual-test','Autoclave01','ChamberTemp','121','2026-11-10T06:01:00+05:30');"
Remove these two rows’ influence later by filtering on rule = 'manual-test'; do not delete them (the table is a record).
Checkpoint 5. drasi list source, query and reaction all show available; a replication slot is active; the two manual calls produce two rows in alarm_events; and, after the simulator’s first excursion (section 9), autoclave-low-temp produces a raised row about 3 seconds after the value drops.
6. The alarm path: bridge, Alertmanager, Teams and email
6.1 Prometheus, Alertmanager and Grafana
One chart installs all three. platform/monitoring/values.yaml:
alertmanager:
  alertmanagerSpec:
    secrets:
      - alertmanager-secrets
  config:
    global:
      resolve_timeout: 5m
      smtp_smarthost: smtp.example.com:587
      smtp_from: plant-alerts@example.com
      smtp_auth_username: plant-alerts@example.com
      smtp_auth_password_file: /etc/alertmanager/secrets/alertmanager-secrets/smtp-password
    route:
      receiver: "null"
      group_by: [alertname, machine]
      group_wait: 30s
      group_interval: 5m
      repeat_interval: 4h
      routes:
        # Every Drasi alarm also goes to the latency sink (used only by the test), then continues.
        - matchers: ['source="drasi"']
          receiver: latency-sink
          continue: true
          group_wait: 0s
          group_interval: 1m
        - matchers: ['source="drasi"', 'severity="critical"']
          receiver: plant-critical
          group_wait: 0s
          group_interval: 1m
          repeat_interval: 1h
        - matchers: ['plant="pipeline"']
          receiver: plant-critical
    receivers:
      - name: "null"
      - name: latency-sink
        webhook_configs:
          - url: http://alarm-sink.monitoring.svc:8080/alert
            send_resolved: true
      - name: plant-critical
        msteamsv2_configs:
          - webhook_url_file: /etc/alertmanager/secrets/alertmanager-secrets/teams-webhook
            send_resolved: true
            title: '{{ .Status | toUpper }}: {{ .CommonLabels.alertname }} on {{ .CommonLabels.machine }}'
            text: '{{ range .Alerts }}{{ .Annotations.summary }}{{ "\n" }}{{ end }}'
        email_configs:
          - to: quality@example.com
            send_resolved: true
            headers:
              Subject: '[{{ .Status | toUpper }}] {{ .CommonLabels.alertname }} {{ .CommonLabels.machine }}'

grafana:
  admin:
    existingSecret: grafana-admin
    userKey: admin-user
    passwordKey: admin-password
  envValueFrom:
    DB_PASSWORD:
      secretKeyRef: { name: plant-db-reader, key: password }
  additionalDataSources:
    - name: Plant TimescaleDB
      type: postgres
      url: plant-db-ro.plant-db.svc.cluster.local:5432
      user: reader
      database: plant
      jsonData:
        sslmode: require
        timescaledb: true
      secureJsonData:
        password: ${DB_PASSWORD}
  sidecar:
    dashboards:
      enabled: true
      label: grafana_dashboard

prometheus:
  prometheusSpec:
    serviceMonitorSelectorNilUsesHelmValues: false
    ruleSelectorNilUsesHelmValues: false
Why each part:
group_wait: 0son the plant routes. The default 30 seconds would delay the first notification by half the whole 10-second budget, three times over. Zero sends the first alert at once.group_intervalstill batches follow-ups so a flapping alarm does not spam.- Secrets by file.
smtp_auth_password_fileandwebhook_url_fileread from the mounted secret instead of putting the SMTP password and the Teams URL into the Helm values and Git. Both come from the Alertmanager documentation as I remember it, not from a run;amtool check-configbelow tells you in seconds if a key is wrong. - Teams.
msteamsv2_configsposts to a Workflows webhook (the new style); the oldermsteams_configstargets the retired Office 365 connectors. Create the webhook with the Workflows app in Teams and put its URL in the secret. - Google Chat instead of Teams. I could not confirm a native Google Chat receiver in Alertmanager. The usual route is a relay such as the third-party
calertproject, which accepts Alertmanager’s webhook and posts to a Chat space; the receiver then looks likewebhook_configs: [{url: http://calert.monitoring.svc:6000/dispatch, send_resolved: true}]. I did not build or test it. Grafana, by contrast, ships a Google Chat contact point. serviceMonitorSelectorNilUsesHelmValues: falselets Prometheus pick up the ServiceMonitors and PrometheusRules in this part without areleaselabel.
Create the secrets and install. Use real values for the webhook and SMTP password; the Grafana password comes from the Secret Manager secret from Part 1 (grafana-admin-password, which holds only a container until you add a version):
printf '%s' "$(openssl rand -base64 18)" | gcloud secrets versions add grafana-admin-password --data-file=- --project $CLOUD_PROJECT
kubectl -n monitoring create secret generic grafana-admin \
  --from-literal=admin-user=admin \
  --from-literal=admin-password="$(gcloud secrets versions access latest --secret grafana-admin-password --project $CLOUD_PROJECT)"
kubectl -n monitoring create secret generic alertmanager-secrets \
  --from-literal=teams-webhook='https://prod-00.example.logic.azure.com/workflows/REPLACE_ME' \
  --from-literal=smtp-password='REPLACE_ME'

helm repo add prometheus-community https://prometheus-community.github.io/helm-charts
helm repo update
helm upgrade --install monitoring prometheus-community/kube-prometheus-stack \
  -n monitoring -f platform/monitoring/values.yaml
kubectl -n monitoring rollout status statefulset/alertmanager-monitoring-kube-prometheus-alertmanager
If the Secret Manager call is not allowed from your laptop, put the password in grafana-admin by hand; the secret is only needed in the cluster. Validate Alertmanager’s configuration, whose generated file you can read from its Pod:
kubectl -n monitoring exec alertmanager-monitoring-kube-prometheus-alertmanager-0 -c alertmanager -- \
  amtool check-config /etc/alertmanager/config_out/alertmanager.env.yaml
Expected (shape): SUCCESS, with a count of one route tree and the three receivers. An unknown field, such as a wrong _file key, is reported here with its name.
6.2 The alarm bridge
The bridge reads alarm_events and posts alerts. The NOTIFY only wakes it; the table is what it believes, so a missed notification (the bridge was down) is caught up by id.
platform/apps/bridge.py:
"""Turn alarm_events rows into Alertmanager alerts."""
import json, logging, os, time, urllib.request
from datetime import datetime, timezone

import psycopg

DSN = os.environ["DATABASE_URL"]
AM = os.environ.get("ALERTMANAGER_URL", "http://monitoring-kube-prometheus-alertmanager.monitoring:9093")
REFRESH = 60            # re-post open alarms; Alertmanager resolves an alert not refreshed in resolve_timeout (5 min)

log = logging.getLogger("bridge")
logging.basicConfig(level=logging.INFO, format="%(asctime)s %(levelname)s %(message)s")


def iso(dt):
    return dt.astimezone(timezone.utc).isoformat()


def post(alerts):
    req = urllib.request.Request(AM + "/api/v2/alerts", data=json.dumps(alerts).encode(),
                                 headers={"Content-Type": "application/json"}, method="POST")
    with urllib.request.urlopen(req, timeout=5) as r:
        if r.status >= 300:
            raise RuntimeError(f"alertmanager returned {r.status}")


def alert(row, ended=False):
    _id, rule, machine, tag, state, value, reading_ts, detected_at = row
    a = {
        "labels": {"alertname": rule, "machine": machine, "tag": tag,
                   "severity": "critical", "source": "drasi"},
        "annotations": {
            "summary": f"{rule}: {machine} {tag} = {value} (reading at {iso(reading_ts) if reading_ts else 'n/a'})",
            "reading_ts": iso(reading_ts) if reading_ts else "",
            "detected_at": iso(detected_at),
        },
        "startsAt": iso(detected_at),
    }
    if ended:
        a["endsAt"] = iso(datetime.now(timezone.utc))
    return a


SELECT = ("SELECT id, rule, machine, tag, state, value, reading_ts, detected_at "
          "FROM alarm_events WHERE id > %s ORDER BY id")


def main():
    with psycopg.connect(DSN, autocommit=True) as conn:
        conn.execute("LISTEN plant_alarm")
        # Rebuild what is open now: the latest state per rule, machine and tag.
        rows = conn.execute(
            "SELECT DISTINCT ON (rule, machine, tag) id, rule, machine, tag, state, value, reading_ts, detected_at "
            "FROM alarm_events ORDER BY rule, machine, tag, id DESC").fetchall()
        open_ = {(r[1], r[2], r[3]): r for r in rows if r[4] == "raised"}
        last_id = conn.execute("SELECT coalesce(max(id), 0) FROM alarm_events").fetchone()[0]
        next_refresh = time.monotonic() + REFRESH
        log.info("started, open alarms=%d, last_id=%d", len(open_), last_id)
        if open_:
            post([alert(r) for r in open_.values()])

        while True:
            for _ in conn.notifies(timeout=5, stop_after=1):   # wake on NOTIFY or after 5 s
                pass
            for row in conn.execute(SELECT, (last_id,)).fetchall():
                last_id = row[0]
                key = (row[1], row[2], row[3])
                if row[4] == "raised":
                    open_[key] = row
                    post([alert(row)])
                else:
                    open_.pop(key, None)
                    post([alert(row, ended=True)])
                log.info("posted %s %s %s id=%d", row[4], row[1], row[2], row[0])
            if open_ and time.monotonic() >= next_refresh:
                post([alert(r) for r in open_.values()])
                next_refresh = time.monotonic() + REFRESH


if __name__ == "__main__":
    main()
Points to know:
- The restart story. On start it re-posts every alarm whose last state is
raised, so a restart does not lose an open alarm, and it starts after the current last id, so it does not re-announce history. - Why re-post every minute. An alert posted without an end time is resolved by Alertmanager after
resolve_timeout. A long excursion needs the refresh. - A cleared alarm posts the same labels with an end time, which Alertmanager treats as a resolve, and
send_resolved: truetells the person. - The bridge is one Pod.
replicas: 1is deliberate; two would double-post, which Alertmanager de-duplicates by labels anyway, but there is no reason to run two. If it is down, up to 5 seconds of polling and the restart time is the delay. - It uses
conn.notifies(timeout=..., stop_after=...), which exists in psycopg 3.2 and later.
6.3 The test sink and the remaining Deployments
The sink is a receiver that records when each alert arrives; section 9 uses it. Add platform/apps/sink.py:
"""Record when Alertmanager notifications arrive. Used by the latency test only."""
import json, sys, time
from http.server import BaseHTTPRequestHandler, HTTPServer


class H(BaseHTTPRequestHandler):
    def do_POST(self):
        body = json.loads(self.rfile.read(int(self.headers.get("Content-Length", 0))) or b"{}")
        recv = time.time()
        for a in body.get("alerts", []):
            print(json.dumps({"recv": recv, "status": a.get("status"), "labels": a.get("labels"),
                              "annotations": a.get("annotations"), "startsAt": a.get("startsAt")}), flush=True)
        self.send_response(200); self.end_headers(); self.wfile.write(b"ok")

    def log_message(self, *a):
        pass


HTTPServer(("0.0.0.0", 8080), H).serve_forever()
Append to platform/apps/apps.yaml (the bridge and the sink; the exporter comes in section 7):
---
apiVersion: apps/v1
kind: Deployment
metadata: { name: alarm-bridge, namespace: ingest }
spec:
  replicas: 1
  selector: { matchLabels: { app: alarm-bridge } }
  template:
    metadata: { labels: { app: alarm-bridge } }
    spec:
      containers:
        - name: bridge
          image: asia-south1-docker.pkg.dev/plant-cloud-abc123/plant/plant-apps:1
          command: ["python", "/app/bridge.py"]
          env:
            - name: DATABASE_URL
              valueFrom: { secretKeyRef: { name: plant-db-app, key: uri } }
          resources:
            requests: { cpu: 50m, memory: 64Mi }
            limits:   { memory: 128Mi }
---
apiVersion: apps/v1
kind: Deployment
metadata: { name: alarm-sink, namespace: monitoring }
spec:
  replicas: 1
  selector: { matchLabels: { app: alarm-sink } }
  template:
    metadata: { labels: { app: alarm-sink } }
    spec:
      containers:
        - name: sink
          image: asia-south1-docker.pkg.dev/plant-cloud-abc123/plant/plant-apps:1
          command: ["python", "/app/sink.py"]
          ports: [{ containerPort: 8080 }]
---
apiVersion: v1
kind: Service
metadata: { name: alarm-sink, namespace: monitoring }
spec:
  selector: { app: alarm-sink }
  ports: [{ port: 8080, targetPort: 8080 }]
Rebuild and push the image (it now contains sink.py), apply, and fire a test alert straight at Alertmanager, bypassing the database, to see Teams and email work:
docker build -t $REPO/plant-apps:1 platform/apps && docker push $REPO/plant-apps:1
kubectl apply -f platform/apps/apps.yaml
kubectl -n ingest rollout restart deploy/consumer deploy/alarm-bridge

kubectl -n monitoring port-forward svc/monitoring-kube-prometheus-alertmanager 9093:9093 &
curl -s -XPOST localhost:9093/api/v2/alerts -H 'Content-Type: application/json' -d \
 '[{"labels":{"alertname":"manual-delivery-test","machine":"none","severity":"critical","source":"drasi"},"annotations":{"summary":"Delivery test, ignore"}}]'
kubectl -n monitoring logs deploy/alarm-sink --tail=3
Expected (shape): a JSON line in the sink log within a second or two; a message in the Teams channel and an email. The test alert resolves itself after 5 minutes.
Checkpoint 6. amtool check-config says SUCCESS; the manual alert shows in the sink log and reaches Teams and the mailbox; kubectl -n ingest logs deploy/alarm-bridge says started, open alarms=0; and the two manual-test rows from section 5 appear as one raised then one cleared line in the bridge log if you replay them after the bridge started.
7. Exporter, Prometheus rules and dashboards
7.1 The exporter
Perses reads Prometheus, so the exporter publishes the latest values, alarm state and the OEE view as metrics, queried at scrape time. platform/apps/exporter.py:
"""Expose plant values from TimescaleDB as Prometheus metrics, read at scrape time."""
import os, time
import psycopg
from prometheus_client import start_http_server
from prometheus_client.core import CounterMetricFamily, GaugeMetricFamily, REGISTRY

DSN = os.environ["DATABASE_URL"]


class Plant:
    def collect(self):
        v = GaugeMetricFamily("plant_tag_value", "Latest value per tag", labels=["area", "machine", "tag", "unit"])
        age = GaugeMetricFamily("plant_last_reading_age_seconds", "Seconds since the newest source timestamp")
        act = GaugeMetricFamily("plant_alarm_active", "1 while an alarm is raised", labels=["rule", "machine", "tag"])
        tot = CounterMetricFamily("plant_alarm_events", "Alarms raised", labels=["rule"])
        a_av = GaugeMetricFamily("plant_oee_availability", "Blister availability, last hour", labels=["machine"])
        a_pf = GaugeMetricFamily("plant_oee_performance", "Blister performance against 7-day maximum", labels=["machine"])
        a_ap = GaugeMetricFamily("plant_oee_ap", "Availability x performance (quality not measured)", labels=["machine"])
        with psycopg.connect(DSN, connect_timeout=3) as c:
            for area, machine, tag, unit, value in c.execute(
                    "SELECT area, machine, tag, coalesce(unit,''), value FROM tag_latest WHERE value IS NOT NULL"):
                v.add_metric([area, machine, tag, unit], value)
            (secs,) = c.execute("SELECT extract(epoch FROM now() - max(time)) FROM tag_latest").fetchone()
            age.add_metric([], secs if secs is not None else 1e9)
            for rule, machine, tag in c.execute(
                    "SELECT rule, machine, tag FROM (SELECT DISTINCT ON (rule, machine, tag) rule, machine, tag, state "
                    "FROM alarm_events ORDER BY rule, machine, tag, id DESC) s WHERE state = 'raised'"):
                act.add_metric([rule, machine, tag], 1)
            for rule, n in c.execute("SELECT rule, count(*) FROM alarm_events WHERE state='raised' GROUP BY rule"):
                tot.add_metric([rule], n)
            for machine, a, p in c.execute("SELECT machine, availability, performance FROM oee_blister_last_hour"):
                a_av.add_metric([machine], a); a_pf.add_metric([machine], p); a_ap.add_metric([machine], a * p)
        yield from (v, age, act, tot, a_av, a_pf, a_ap)


REGISTRY.register(Plant())
start_http_server(9100)
while True:
    time.sleep(3600)
plant_alarm_events is a counter family, so Prometheus sees the series as plant_alarm_events_total. Add the Deployment, Service, ServiceMonitor and rule, and check the metrics. The exporter uses the read-only reader role, in the monitoring namespace:
---
apiVersion: apps/v1
kind: Deployment
metadata: { name: plant-exporter, namespace: monitoring }
spec:
  replicas: 1
  selector: { matchLabels: { app: plant-exporter } }
  template:
    metadata: { labels: { app: plant-exporter } }
    spec:
      containers:
        - name: exporter
          image: asia-south1-docker.pkg.dev/plant-cloud-abc123/plant/plant-apps:1
          command: ["python", "/app/exporter.py"]
          env:
            - name: DB_PASSWORD
              valueFrom: { secretKeyRef: { name: plant-db-reader, key: password } }
            - name: DATABASE_URL
              value: postgresql://reader:$(DB_PASSWORD)@plant-db-ro.plant-db.svc.cluster.local:5432/plant?sslmode=require
          ports: [{ name: metrics, containerPort: 9100 }]
          resources:
            requests: { cpu: 50m, memory: 64Mi }
            limits:   { memory: 128Mi }
---
apiVersion: v1
kind: Service
metadata: { name: plant-exporter, namespace: monitoring, labels: { app: plant-exporter } }
spec:
  selector: { app: plant-exporter }
  ports: [{ name: metrics, port: 9100, targetPort: metrics }]
---
apiVersion: monitoring.coreos.com/v1
kind: ServiceMonitor
metadata: { name: plant-exporter, namespace: monitoring }
spec:
  selector: { matchLabels: { app: plant-exporter } }
  endpoints: [{ port: metrics, interval: 10s }]
The $(DB_PASSWORD) in the URL is Kubernetes variable expansion, which works because DB_PASSWORD is defined earlier in the same list. The exporter reads from the replica service, plant-db-ro, so a slow dashboard query cannot slow the primary.
platform/monitoring/rules.yaml holds the pipeline alerts that go through the same Alertmanager, a stale-data alert and an exporter-down alert. Plant alarms come from Drasi; these ones watch the machinery itself:
apiVersion: monitoring.coreos.com/v1
kind: PrometheusRule
metadata: { name: plant-pipeline, namespace: monitoring }
spec:
  groups:
    - name: plant-pipeline
      rules:
        - alert: PlantDataStale
          expr: plant_last_reading_age_seconds > 60
          for: 1m
          labels: { severity: critical, plant: pipeline }
          annotations: { summary: "No new readings for over a minute. Check the link, EMQX and the consumer." }
        - alert: PlantExporterDown
          expr: up{job="plant-exporter"} == 0
          for: 2m
          labels: { severity: warning, plant: pipeline }
          annotations: { summary: "The plant exporter is not being scraped." }
This pipeline alert is the one that tells you the 10-second target is not being met because there is no data. The target applies while the link is up, as the overview says; when the link is down, this alert fires and the edge rule in section 8 is the fallback.
docker build -t $REPO/plant-apps:1 platform/apps && docker push $REPO/plant-apps:1
kubectl apply -f platform/apps/apps.yaml -f platform/monitoring/rules.yaml
kubectl -n monitoring port-forward svc/plant-exporter 9100:9100 &
curl -s localhost:9100/metrics | grep -E '^plant_(tag_value|last_reading|oee_ap)' | head -5
Expected (shape): plant_tag_value{...} 121.2 lines, plant_last_reading_age_seconds under 5, and plant_oee_ap{machine="Blister01"} near 1 once an hour of data exists (before that the 60-minute availability is lower, because missing minutes count as down).
7.2 Perses
helm repo add perses https://perses.github.io/helm-charts && helm repo update
helm upgrade --install perses perses/perses -n dashboards
kubectl -n dashboards rollout status deploy/perses 2>/dev/null || kubectl -n dashboards get pods
kubectl -n dashboards port-forward svc/perses 8080:8080 &
percli login http://localhost:8080
I did not set persistence or other values. Check helm show values perses/perses for the database and persistence settings before you rely on it; the dashboards are in Git, so a lost volume is recoverable by re-applying them, which is the point of dashboards as code.
platform/dashboards/perses/project.yaml:
kind: Project
metadata: { name: plant }
spec: {}
---
kind: GlobalDatasource
metadata: { name: plant-prometheus }
spec:
  default: true
  plugin:
    kind: PrometheusDatasource
    spec:
directUrl: http://monitoring-kube-prometheus-prometheus.monitoring.svc:9090platform/dashboards/perses/machine-overview.yaml:
kind: Dashboard
metadata: { name: machine-overview, project: plant }
spec:
  display: { name: Machine overview }
  duration: 1h
  refreshInterval: 10s
  panels:
    force:
      kind: Panel
      spec:
        display: { name: Compression force }
        plugin: { kind: TimeSeriesChart, spec: {} }
        queries:
          - kind: TimeSeriesQuery
            spec:
              plugin:
                kind: PrometheusTimeSeriesQuery
                spec: { query: 'plant_tag_value{tag="CompressionForce"}', seriesNameFormat: '{{machine}}' }
    dryer:
      kind: Panel
      spec:
        display: { name: Dryer inlet temperature }
        plugin: { kind: TimeSeriesChart, spec: {} }
        queries:
          - kind: TimeSeriesQuery
            spec:
              plugin:
                kind: PrometheusTimeSeriesQuery
                spec: { query: 'plant_tag_value{tag="InletTemp"}', seriesNameFormat: '{{machine}}' }
    speed:
      kind: Panel
      spec:
        display: { name: Blister line speed }
        plugin: { kind: TimeSeriesChart, spec: {} }
        queries:
          - kind: TimeSeriesQuery
            spec:
              plugin:
                kind: PrometheusTimeSeriesQuery
                spec: { query: 'plant_tag_value{tag="LineSpeed"}', seriesNameFormat: '{{machine}}' }
    age:
      kind: Panel
      spec:
        display: { name: Seconds since newest reading }
        plugin: { kind: StatChart, spec: { calculation: last-number } }
        queries:
          - kind: TimeSeriesQuery
            spec:
              plugin: { kind: PrometheusTimeSeriesQuery, spec: { query: 'plant_last_reading_age_seconds' } }
  layouts:
    - kind: Grid
      spec:
        display: { title: Machines }
        items:
          - { x: 0,  y: 0, width: 8, height: 7, content: { $ref: '#/spec/panels/force' } }
          - { x: 8,  y: 0, width: 8, height: 7, content: { $ref: '#/spec/panels/dryer' } }
          - { x: 16, y: 0, width: 8, height: 7, content: { $ref: '#/spec/panels/speed' } }
- { x: 0, y: 7, width: 6, height: 4, content: { $ref: '#/spec/panels/age' } }platform/dashboards/perses/excursions.yaml:
kind: Dashboard
metadata: { name: excursions, project: plant }
spec:
  display: { name: Excursions }
  duration: 30m
  refreshInterval: 5s
  panels:
    active:
      kind: Panel
      spec:
        display: { name: Active alarms }
        plugin: { kind: StatChart, spec: { calculation: last-number } }
        queries:
          - kind: TimeSeriesQuery
            spec:
              plugin: { kind: PrometheusTimeSeriesQuery, spec: { query: 'sum(plant_alarm_active) or vector(0)' } }
    raised:
      kind: Panel
      spec:
        display: { name: Alarms raised, by rule }
        plugin: { kind: TimeSeriesChart, spec: {} }
        queries:
          - kind: TimeSeriesQuery
            spec:
              plugin: { kind: PrometheusTimeSeriesQuery, spec: { query: 'sum by (rule) (plant_alarm_events_total)', seriesNameFormat: '{{rule}}' } }
    autoclave:
      kind: Panel
      spec:
        display: { name: Autoclave chamber temperature }
        plugin: { kind: TimeSeriesChart, spec: {} }
        queries:
          - kind: TimeSeriesQuery
            spec:
              plugin: { kind: PrometheusTimeSeriesQuery, spec: { query: 'plant_tag_value{tag="ChamberTemp"}', seriesNameFormat: '{{machine}}' } }
    hvac:
      kind: Panel
      spec:
        display: { name: Cleanroom differential pressure }
        plugin: { kind: TimeSeriesChart, spec: {} }
        queries:
          - kind: TimeSeriesQuery
            spec:
              plugin: { kind: PrometheusTimeSeriesQuery, spec: { query: 'plant_tag_value{tag="DiffPressure"}', seriesNameFormat: '{{machine}}' } }
    cold:
      kind: Panel
      spec:
        display: { name: Cold store temperature }
        plugin: { kind: TimeSeriesChart, spec: {} }
        queries:
          - kind: TimeSeriesQuery
            spec:
              plugin: { kind: PrometheusTimeSeriesQuery, spec: { query: 'plant_tag_value{tag="Temp"}', seriesNameFormat: '{{machine}}' } }
  layouts:
    - kind: Grid
      spec:
        display: { title: Alarms }
        items:
          - { x: 0,  y: 0, width: 6,  height: 5, content: { $ref: '#/spec/panels/active' } }
          - { x: 6,  y: 0, width: 18, height: 5, content: { $ref: '#/spec/panels/raised' } }
    - kind: Grid
      spec:
        display: { title: The three watched signals }
        items:
          - { x: 0,  y: 0, width: 8, height: 7, content: { $ref: '#/spec/panels/autoclave' } }
          - { x: 8,  y: 0, width: 8, height: 7, content: { $ref: '#/spec/panels/hvac' } }
- { x: 16, y: 0, width: 8, height: 7, content: { $ref: '#/spec/panels/cold' } }platform/dashboards/perses/oee.yaml:
kind: Dashboard
metadata: { name: oee, project: plant }
spec:
  display: { name: OEE, illustrative }
  duration: 6h
  refreshInterval: 1m
  panels:
    ap:
      kind: Panel
      spec:
        display: { name: Availability x performance (quality not measured) }
        plugin: { kind: TimeSeriesChart, spec: {} }
        queries:
          - kind: TimeSeriesQuery
            spec:
              plugin: { kind: PrometheusTimeSeriesQuery, spec: { query: 'plant_oee_ap', seriesNameFormat: '{{machine}}' } }
    av:
      kind: Panel
      spec:
        display: { name: Availability }
        plugin: { kind: TimeSeriesChart, spec: {} }
        queries:
          - kind: TimeSeriesQuery
            spec:
              plugin: { kind: PrometheusTimeSeriesQuery, spec: { query: 'plant_oee_availability', seriesNameFormat: '{{machine}}' } }
    pf:
      kind: Panel
      spec:
        display: { name: Performance against 7-day maximum }
        plugin: { kind: TimeSeriesChart, spec: {} }
        queries:
          - kind: TimeSeriesQuery
            spec:
              plugin: { kind: PrometheusTimeSeriesQuery, spec: { query: 'plant_oee_performance', seriesNameFormat: '{{machine}}' } }
  layouts:
    - kind: Grid
      spec:
        display: { title: Blister lines }
        items:
          - { x: 0,  y: 0, width: 24, height: 7, content: { $ref: '#/spec/panels/ap' } }
          - { x: 0,  y: 7, width: 12, height: 7, content: { $ref: '#/spec/panels/av' } }
          - { x: 12, y: 7, width: 12, height: 7, content: { $ref: '#/spec/panels/pf' } }
Lint, then apply. percli lint is the checkpoint for the schema, because I wrote these from the Perses documentation and my memory of its resource format and did not run them:
percli lint -f platform/dashboards/perses/
percli apply -f platform/dashboards/perses/project.yaml
percli apply -f platform/dashboards/perses/machine-overview.yaml
percli apply -f platform/dashboards/perses/excursions.yaml
percli apply -f platform/dashboards/perses/oee.yaml
Open http://localhost:8080, project plant. For a pipeline, run the same lint and apply from CI against the Perses URL, which is the dashboards-as-code loop; the Perses brief covers the Go and CUE SDK for generating dashboards instead of writing YAML, which I did not use here.
7.3 Grafana
The chart already installed Grafana with a PostgreSQL datasource and a sidecar that loads dashboards from ConfigMaps labelled grafana_dashboard. Grafana is the place for raw SQL history that Prometheus cannot hold. platform/dashboards/grafana.yaml:
apiVersion: v1
kind: ConfigMap
metadata:
  name: plant-sql-history
  namespace: monitoring
  labels: { grafana_dashboard: "1" }
data:
  plant-sql-history.json: |
    {
      "title": "Plant SQL history",
      "uid": "plant-sql-history",
      "schemaVersion": 39,
      "time": { "from": "now-6h", "to": "now" },
      "templating": { "list": [
        { "name": "machine", "type": "query", "datasource": "Plant TimescaleDB",
          "query": "SELECT DISTINCT machine FROM tag_latest ORDER BY 1", "refresh": 1 },
        { "name": "tag", "type": "query", "datasource": "Plant TimescaleDB",
          "query": "SELECT DISTINCT tag FROM tag_latest WHERE machine = '$machine' ORDER BY 1", "refresh": 1 }
      ] },
      "panels": [
        { "type": "timeseries", "title": "One-minute average, min and max", "gridPos": { "x": 0, "y": 0, "w": 24, "h": 9 },
          "datasource": "Plant TimescaleDB",
          "targets": [ { "format": "time_series", "rawQuery": true, "rawSql":
            "SELECT bucket AS time, avg_value AS avg, min_value AS min, max_value AS max FROM readings_1m WHERE machine = '$machine' AND tag = '$tag' AND $__timeFilter(bucket) ORDER BY 1" } ] },
        { "type": "table", "title": "Alarm events", "gridPos": { "x": 0, "y": 9, "w": 24, "h": 9 },
          "datasource": "Plant TimescaleDB",
          "targets": [ { "format": "table", "rawQuery": true, "rawSql":
            "SELECT detected_at, rule, machine, state, value, reading_ts FROM alarm_events WHERE $__timeFilter(detected_at) ORDER BY id DESC LIMIT 200" } ] }
      ]
    }
kubectl apply -f platform/dashboards/grafana.yaml
kubectl -n monitoring port-forward svc/monitoring-grafana 3000:80 &Open http://localhost:3000, sign in as admin with the password from Secret Manager, and open Plant SQL history. The $__timeFilter macro is Grafana’s, and readings_1m serves the chart so a six-hour view reads 360 rows per tag, not 21,600.
Checkpoint 7. /metrics shows the plant series; Prometheus’s Targets page lists plant-exporter as up; the three Perses dashboards load with lines; Grafana’s SQL dashboard draws a one-minute series; and percli lint passes.
8. An EMQX rule that still works when the link is down
The overview said Part 3 would show one plant-local rule. The cloud path above needs the link; a freezer alarm cannot. In the EMQX Dashboard (Integration, Rules, Create), add a rule on the edge broker from Part 2:
SELECT
  payload.fields.Temp AS temp,
  nth(4, split(topic, '/')) AS machine
FROM
  "plant/+/coldstore/+/Temp"
WHERE
  payload.fields.Temp > 8
Add the action Republish: topic plant/s01/local-alarm/${machine}, QoS 1, payload template {"rule":"coldstore-high-temp-local","machine":"${machine}","temp":${temp}}.
Two things make this safe. The republished topic has four levels, so it does not match the Pub/Sub rule’s five-level filter plant/+/+/+/+ and never reaches the cloud as telemetry. A republish action runs inside the broker, so Telegraf’s publish ACL does not apply to it. Something at the plant (a beacon, a panel) subscribes to plant/s01/local-alarm/+; that device is out of scope here.
The honest limit: this fires on one reading, with no 3-second hold, and its threshold (8) is a second copy of the number in the Drasi query. Two copies drift. In a real build the limits come from one place, and the quality unit owns them. I did not run this rule, and I used payload.fields.Temp and split/nth from memory of EMQX’s SQL on JSON payloads.
9. The excursion test
9.1 What is measured
The target from the overview is an alarm within 10 seconds of an excursion while the link is up. Define it precisely, or the number means nothing:
- t0 is the source timestamp of the first reading beyond the limit, as the machine reported it. It is the moment the process went wrong, not when anything noticed.
- t1 is when the alert arrived at a receiver after Alertmanager, recorded by the sink Pod (
recvin its log). - Latency is t1 minus t0. It includes the 3-second hold, so it is the figure the plant cares about, not just the software.
The Teams and email hops are outside this figure. Teams adds its own delivery time that I cannot control; note when the message appears on a phone, as a separate observation.
My design arithmetic, which is an estimate and not a measurement:
| Stage | Assumed time |
|---|---|
| Sample, Telegraf, MQTT, EMQX, publish to Pub/Sub | 0.3 to 1.5 s |
| Pub/Sub to consumer, insert, commit | 0.1 to 1 s |
| Logical decoding, Drasi source, query evaluation | 0.1 to 1 s |
trueFor hold |
3 s, by design |
Reaction, procedure, NOTIFY, bridge, Alertmanager (group_wait: 0s), sink |
0.2 to 1 s |
| Total | about 3.7 to 7.5 s |
If your measured worst case is near 10 seconds, the cheapest lever is the hold (2 seconds instead of 3), and the next is the consumer’s pull behaviour. Do not tune before you have numbers.
9.2 Clocks
t0 comes from the simulator’s clock on the edge VM and t1 from a GKE node. A skew of a second shifts the result by a second. Both clocks are Google Compute Engine VMs, which synchronise to Google’s time service by default, but check, and record, before you trust the result:
gcloud compute ssh plant-edge-1 --zone $ZONE --project $EDGE_PROJECT --tunnel-through-iap -- 'timedatectl | grep -i synchronized; date +%s.%N'
date +%s.%N
System clock synchronized: yes on the VM. The two epoch values, printed a moment apart, should differ by about the time between the commands, and not by seconds.
9.3 The measurement script
tools/measure_alarm.py reads the sink’s log, finds t0 in readings for each firing alert, and prints the stages:
"""Measure excursion-to-alert latency. Usage:
   python tools/measure_alarm.py --dsn postgresql://... --log sink.log [--limit 10]"""
import argparse, json, sys
from datetime import datetime, timedelta, timezone
import psycopg

# Must match platform/drasi/queries.yaml
RULES = {
    "autoclave-low-temp":    ("ChamberTemp", "<", 119.0),
    "hvac-low-diffpressure": ("DiffPressure", "<", 8.0),
    "coldstore-high-temp":   ("Temp", ">", 8.0),
}

ap = argparse.ArgumentParser()
ap.add_argument("--dsn", required=True)
ap.add_argument("--log", required=True)
ap.add_argument("--limit", type=float, default=10.0)
a = ap.parse_args()

events = []
for line in open(a.log):
    line = line.strip()
    if not line.startswith("{"):
        continue
    e = json.loads(line)
    if e.get("status") == "firing" and e["labels"].get("alertname") in RULES:
        events.append(e)
if not events:
    sys.exit("no firing alerts found in the log")

worst = 0.0
print(f"{'rule':24} {'machine':12} {'t0->received':>13} {'->commit':>9} {'->detected':>11} {'->alert':>8}")
with psycopg.connect(a.dsn) as c:
    seen = set()
    for e in events:
        l, an = e["labels"], e["annotations"]
        key = (l["alertname"], l["machine"], an["detected_at"])
        if key in seen:      # the bridge re-posts open alarms every minute; count each alarm once
            continue
        seen.add(key)
        tag, op, lim = RULES[l["alertname"]]
        rts = datetime.fromisoformat(an["reading_ts"])
        det = datetime.fromisoformat(an["detected_at"])
        row = c.execute(
            f"SELECT min(time), min(received_at) FROM readings WHERE machine=%s AND tag=%s AND value {op} %s "
            f"AND time BETWEEN %s AND %s",
            (l["machine"], tag, lim, rts - timedelta(seconds=60), rts)).fetchone()
        if row[0] is None:
            print(f"{l['alertname']:24} {l['machine']:12} no reading beyond the limit found")
            continue
        t0, rcv = row
        recv = datetime.fromtimestamp(e["recv"], tz=timezone.utc)
        total = (recv - t0).total_seconds()
        worst = max(worst, total)
        print(f"{l['alertname']:24} {l['machine']:12} {total:13.2f} {(rcv - t0).total_seconds():9.2f} "
              f"{(det - t0).total_seconds():11.2f} {(recv - det).total_seconds():8.2f}")
print(f"\nworst case {worst:.2f} s against a limit of {a.limit:.0f} s:", "PASS" if worst <= a.limit else "FAIL")
sys.exit(0 if worst <= a.limit else 1)
The columns, left to right: total latency; time to arrive in the database (received_at of the first bad row); time until the alarm row was written; time from that row to the sink. The split tells you where to look when the total is too high. The first-bad-row search window is the 60 seconds before the reading that tripped the rule; with excursions 20 minutes apart that finds the right one.
9.4 Run it
The simulator starts each excursion 300 seconds after its server starts, lasts 30 seconds and repeats every 1,200 seconds, on the first machine of each type. So the test is a deliberate restart of the three servers that matter, then a wait:
kubectl -n ot-sim rollout restart deploy/opcua-autoclave deploy/opcua-hvac deploy/opcua-coldstore
date -u            # note the time; the excursions begin about 5 minutes later
Run that on the edge VM, where kubectl points at k3s. Telegraf reconnects to the restarted servers by itself; if it does not, restart it too. Then, at least 6 minutes later:
kubectl -n monitoring logs deploy/alarm-sink > sink.log
kubectl -n ingest logs deploy/alarm-bridge | grep -E "posted (raised|cleared)"
kubectl -n plant-db port-forward svc/plant-db-ro 5433:5432 &
export PGPW=$(kubectl -n plant-db get secret plant-db-reader -o jsonpath='{.data.password}' | base64 -d)
python tools/measure_alarm.py --dsn "postgresql://reader:$PGPW@localhost:5433/plant?sslmode=require" --log sink.log
Expected (shape only; I have no real numbers): three rows, one each for the first autoclave, the first cleanroom unit and the first cold store, a raised bridge line for each about 3 seconds into the excursion and a cleared line about 30 seconds later, and a final PASS or FAIL line. Watch the dashboards live: the Perses Excursions page should show Active alarms go to 3 and back to 0, and the three signals dip or rise.
Repeat the excursion at least three times (the next cycle comes 20 minutes later, so you can keep the same Pods and run the script again on a longer log). One pass proves little; the worst of several is the figure to record. Keep the output, the sink.log and the clock check as evidence for Part 4.
9.5 What this test does not prove
- It proves the software path with the link up, not Teams or email delivery time, and not the edge rule from section 8.
- It uses one excursion shape: a step change held for 30 seconds. A slow drift, a spike shorter than the hold or a flapping signal behave differently by design and are not tested.
- The three excursions are simulator output, so the detection of real sensor noise is unproven. The simulator’s noise level decides whether the 3-second hold is enough.
- Drasi’s handling of timing is assumed. I do not know whether
trueForuses the reading’s timestamp or the time Drasi processes it. With a steady stream the two are close, but after a replay of buffered data they are not. - A failure path is not tested: kill the consumer, the bridge or Drasi in the middle of an excursion and see what is missed. The bridge’s catch-up by id is meant to cover the bridge; nothing here covers Drasi being down.
10. Troubleshooting, cost and cleanup
| Symptom | Likely cause | What to do |
|---|---|---|
Cluster Pods ImagePullBackOff |
The node service account cannot read Artifact Registry | Grant it roles/artifactregistry.reader on the plant repository |
| CloudNativePG rejects the image | The tag does not parse as a PostgreSQL version, or the image has no postgres binary on the expected path |
Retag as 18.<minor>-ts2.31.0; run docker run --rm <image> postgres --version |
CREATE EXTENSION timescaledb fails with a preload hint |
shared_preload_libraries did not take effect |
Check the Cluster spec uses the dedicated field, not a raw parameter, and that the Pods restarted |
SHOW timescaledb.license returns apache |
The OSS package was installed | Rebuild the image with timescaledb-2-postgresql-18 |
remove_columnstore_policy or add_columnstore_policy unknown |
The function names differ in your release | Use the names for your version: add_compression_policy is the older alias, per the TimescaleDB brief |
Consumer logs database error repeatedly |
Wrong DATABASE_URL, or the plant-db-app copy is stale |
Re-run copy_secret, restart the Deployment |
Consumer commits but tag_latest does not change |
The incoming time is older than the stored one |
Check the payload timestamp unit; the code assumes milliseconds |
Backlog grows on telemetry-ingest |
Consumer too slow, or down | Add replicas; check committed= rates in its log |
Messages in plant-telemetry-dlq |
Unparseable payload (poison) | Pull one and compare with the payload in Part 2 |
| Drasi source never becomes available | wal_level is not logical, the role lacks REPLICATION, or the secret is missing in drasi-system |
Re-run the checks in sections 2 and 5; look at drasi describe source plant-db |
| Source logs a publication error | The publication I created conflicts with the one Drasi wants | Drop drasi_pub or use the name Drasi asks for |
Query fails on the literal 'x' AS rule |
The language does not accept a literal in RETURN |
Remove it, and use one reaction per query with the rule name written into each command |
Reaction logs raise_alarm is a procedure or does not exist |
It calls the command with SELECT, not CALL, or the signature differs |
Add a plpgsql function with the same five text arguments that runs CALL raise_alarm(...) inside it (name it raise_alarm_fn), and point the reaction’s command at the function |
| Reaction cannot connect | databaseSsl: false against a server that insists on TLS, or the wrong secret key |
Check the CloudNativePG pg_hba result and the plant-db-app secret key password |
| No alarm during the excursion | The threshold is outside the simulator’s real values, or the hold never completes because noise crosses back | Look at tag_latest during the excursion; widen the threshold or shorten the hold |
| Alarm raised, nothing in Teams | The bridge cannot reach Alertmanager, or the route does not match | kubectl -n ingest logs deploy/alarm-bridge; check the alert’s labels against the route matchers in the Alertmanager UI |
| Email works, Teams does not | The webhook URL is for the retired connector style | Create a Workflows webhook and use msteamsv2_configs |
| Alert resolves after 5 minutes though the alarm is still open | The bridge stopped re-posting | Check the bridge is running; the refresh is every 60 seconds |
| Perses panels empty | The datasource URL is wrong, or no series for the query | Run the same PromQL in Prometheus; check the service name monitoring-kube-prometheus-prometheus |
percli lint rejects a dashboard |
A field name or plugin kind differs in your Perses version | Fix from the error, and compare with a dashboard exported from the Perses UI |
| Grafana’s datasource test fails | The reader password secret is missing in monitoring, or SSL mode |
Re-run copy_secret plant-db-reader plant-db monitoring; try sslmode: disable in the lab only |
| Disk on the database fills | An inactive logical replication slot is holding WAL | Drop the slot (cleanup) or restore Drasi |
Cost note
The overview estimated the running stack at about $1.13 an hour, my own arithmetic from published prices read on 8 November 2026. This part adds, on the existing three-node cluster, two 20 GB premium-rwo disks for the database, Drasi’s control plane and its supporting components, and the Prometheus, Alertmanager and Grafana stack, plus a few small Pods. I did not recompute the bill and did not measure the Pods’ resource use. Run kubectl top nodes before drasi init and after everything is up: if the nodes run short of CPU, Drasi and the database are the first suspects, and a fourth node is the answer. Pub/Sub delivery volume is the same 60 messages a second as Part 2, once more for the telemetry-ingest subscription. Check the current price list for disks and egress before leaving it running.
Cleanup
# Drasi: delete resources first, then drop the replication slot so WAL is not retained.
drasi delete -f platform/drasi/reaction.yaml
drasi delete -f platform/drasi/queries.yaml
drasi delete -f platform/drasi/source.yaml
kubectl -n plant-db exec plant-db-1 -c postgres -- psql -U postgres -d plant -c \
  "SELECT pg_drop_replication_slot(slot_name) FROM pg_replication_slots WHERE NOT active;"
drasi uninstall            # check `drasi --help` for the command in your CLI version

kubectl delete -f platform/apps/apps.yaml
kubectl delete -f platform/monitoring/rules.yaml -f platform/dashboards/grafana.yaml
helm uninstall perses -n dashboards
helm uninstall monitoring -n monitoring
kubectl delete -f platform/db/cluster.yaml
kubectl -n plant-db delete pvc --all
helm uninstall cnpg -n cnpg-system
kubectl delete namespace ingest plant-db drasi-system monitoring dashboards cnpg-system
On the edge VM, remove the EMQX rule from the Dashboard if you added it. In Artifact Registry, delete the timescaledb-cnpg and plant-apps images. The full project teardown is in Part 1’s cleanup block; run that last, and destroy at the end of the session unless you are going straight into Part 4.
What I could not test
- Nothing in this part ran. The image, cluster, SQL, consumer, bridge, exporter, Drasi resources, Alertmanager configuration and dashboards were written from the tool briefs and the documentation pages I could reach. There are no latency numbers; the table in section 9.1 is arithmetic on my own assumptions.
- The TimescaleDB image. I did not build it, did not confirm that
timescaledb-2-postgresql-18installs on the CloudNativePG base image or that it is the Community build, did not check the Debian codename path, and did not confirm CloudNativePG accepts the tag18-ts2.31.0. - TimescaleDB SQL. The
CREATE TABLE ... WITH (tsdb.hypertable ...)options,add_columnstore_policy,remove_columnstore_policy(..., if_exists => true)and the unique index on a columnstore hypertable come from the brief. Behaviour of the unique index against compressed chunks for very late data is untested. - Drasi. I could not read the current reference pages (the fetch was blocked), so the source properties,
drasi.trueFor, and the Stored Procedure reaction fields rest on the brief and on the Stored Procedure how-to that search returned. Not confirmed: whether the source creates its own publication, how it types values passed to the procedure, whether a literal inRETURNis accepted, whether the reaction issuesCALLorSELECT, howtrueFormeasures time, how it behaves across a Drasi restart, and the CLI command to remove Drasi. The newer Drasi Server family has its own PostgreSQL source and reactions; I did not use it and did not compare coverage. - Logical replication and failover. I did not check what happens to the replication slot when CloudNativePG fails over to the replica. The safe assumption is that the slot is lost and Drasi’s source must be recreated, and that rows changed in between are not replayed.
- Telegraf as the consumer. My statement that its PostgreSQL output has no
ON CONFLICToption is from reading the documentation, not from testing; if you find one, the custom consumer is no longer necessary. - Alertmanager.
msteamsv2_configs,webhook_url_fileandsmtp_auth_password_fileare from the documentation as I recall it and from a secondary article;amtool check-configis the real test. I did not confirm a native Google Chat receiver and did not build the relay. The kube-prometheus-stack values keys (alertmanager.config,alertmanagerSpec.secrets,grafana.envValueFrom,additionalDataSources) are from memory of the chart. - Perses. The resource format, plugin kinds (
TimeSeriesChart,StatChart,PrometheusTimeSeriesQuery,PrometheusDatasource), layout syntax,seriesNameFormatandperclicommands are from the brief and my memory;percli lintis the check. I did not set persistence. - Grafana. The datasource provisioning keys, the
$__timeFiltermacro use in raw SQL and the dashboard JSON were not loaded into Grafana. - EMQX rule. The SQL on JSON payloads and the republish template are from memory of EMQX, and I did not check them against 6.3.1.
- Scale. Nothing ran above 60 tags. Drasi watching every row update of
tag_latestis wasteful at 30,000 tags; the next step is a smaller table of only the tags that have rules, which I did not build. - Quality. The OEE view is not an OEE (no quality factor, no machine states) and the lab data has no stops.
- Nothing here is validated for a regulated plant. Alarm limits, hold times, retention periods and who is told what are decisions for the quality unit, and an alarm system that people rely on needs its own validation.
What comes next
Part 4: Data Integrity and Change Control takes this stack and makes its records trustworthy: secrets move to external-secrets and Secret Manager, the reaction and the consumer get least-privilege roles, alarm_events becomes append-only with evidence in the locked bucket, backups and a restore test are added, and the changes themselves go through a reviewed path. Part 5 then adds prediction and operations, and plans Sprint 5.
Briefs for the tools used here: TimescaleDB, CloudNativePG, Drasi, Prometheus, Perses, EMQX, Kubernetes and Telegraf. Grafana is not a CNCF project and has no brief here. The scenario and the full architecture are in the project overview, and the earlier parts are Part 1 and Part 2.
Sources: Drasi: Configure a Stored Procedure Reaction, Drasi: Getting Started, Drasi: Reactions concept, Tiger Data: CloudNativePG with TimescaleDB, OneUptime: fixing rejected CloudNativePG TimescaleDB images, AWS Builder Center: TimescaleDB on EKS with CloudNativePG, OneUptime: Alertmanager configuration, calert: Alertmanager to Google Chat, Grafana: Google Chat contact point.