This is Part 3 of the five-part build in the Sprint 5 project overview. Part 2 left readings flowing from simulated vehicles and a depot, through AWS IoT Core, onto the telemetry.raw topic on Amazon MSK, where Vector normalises them. This part gives those readings somewhere to live and something to trigger. openGemini stores each reading once. Knative functions, fed by a Kafka source, check each reading as it arrives and open an excursion case in Amazon RDS when a source has been above 8 °C for 5 minutes. Alertmanager pages. A second path takes geofence events from Amazon Location through EventBridge into Knative. A small job computes mean kinetic temperature per shipment. Grafana and Perses show it, and the last section gives a method for measuring the alert delay.
Where this part fits. This part builds storage, the reactions and the dashboards (marked Part 3 on the overall diagram). Open the zoomable Sprint 5 architecture or read the Overview.
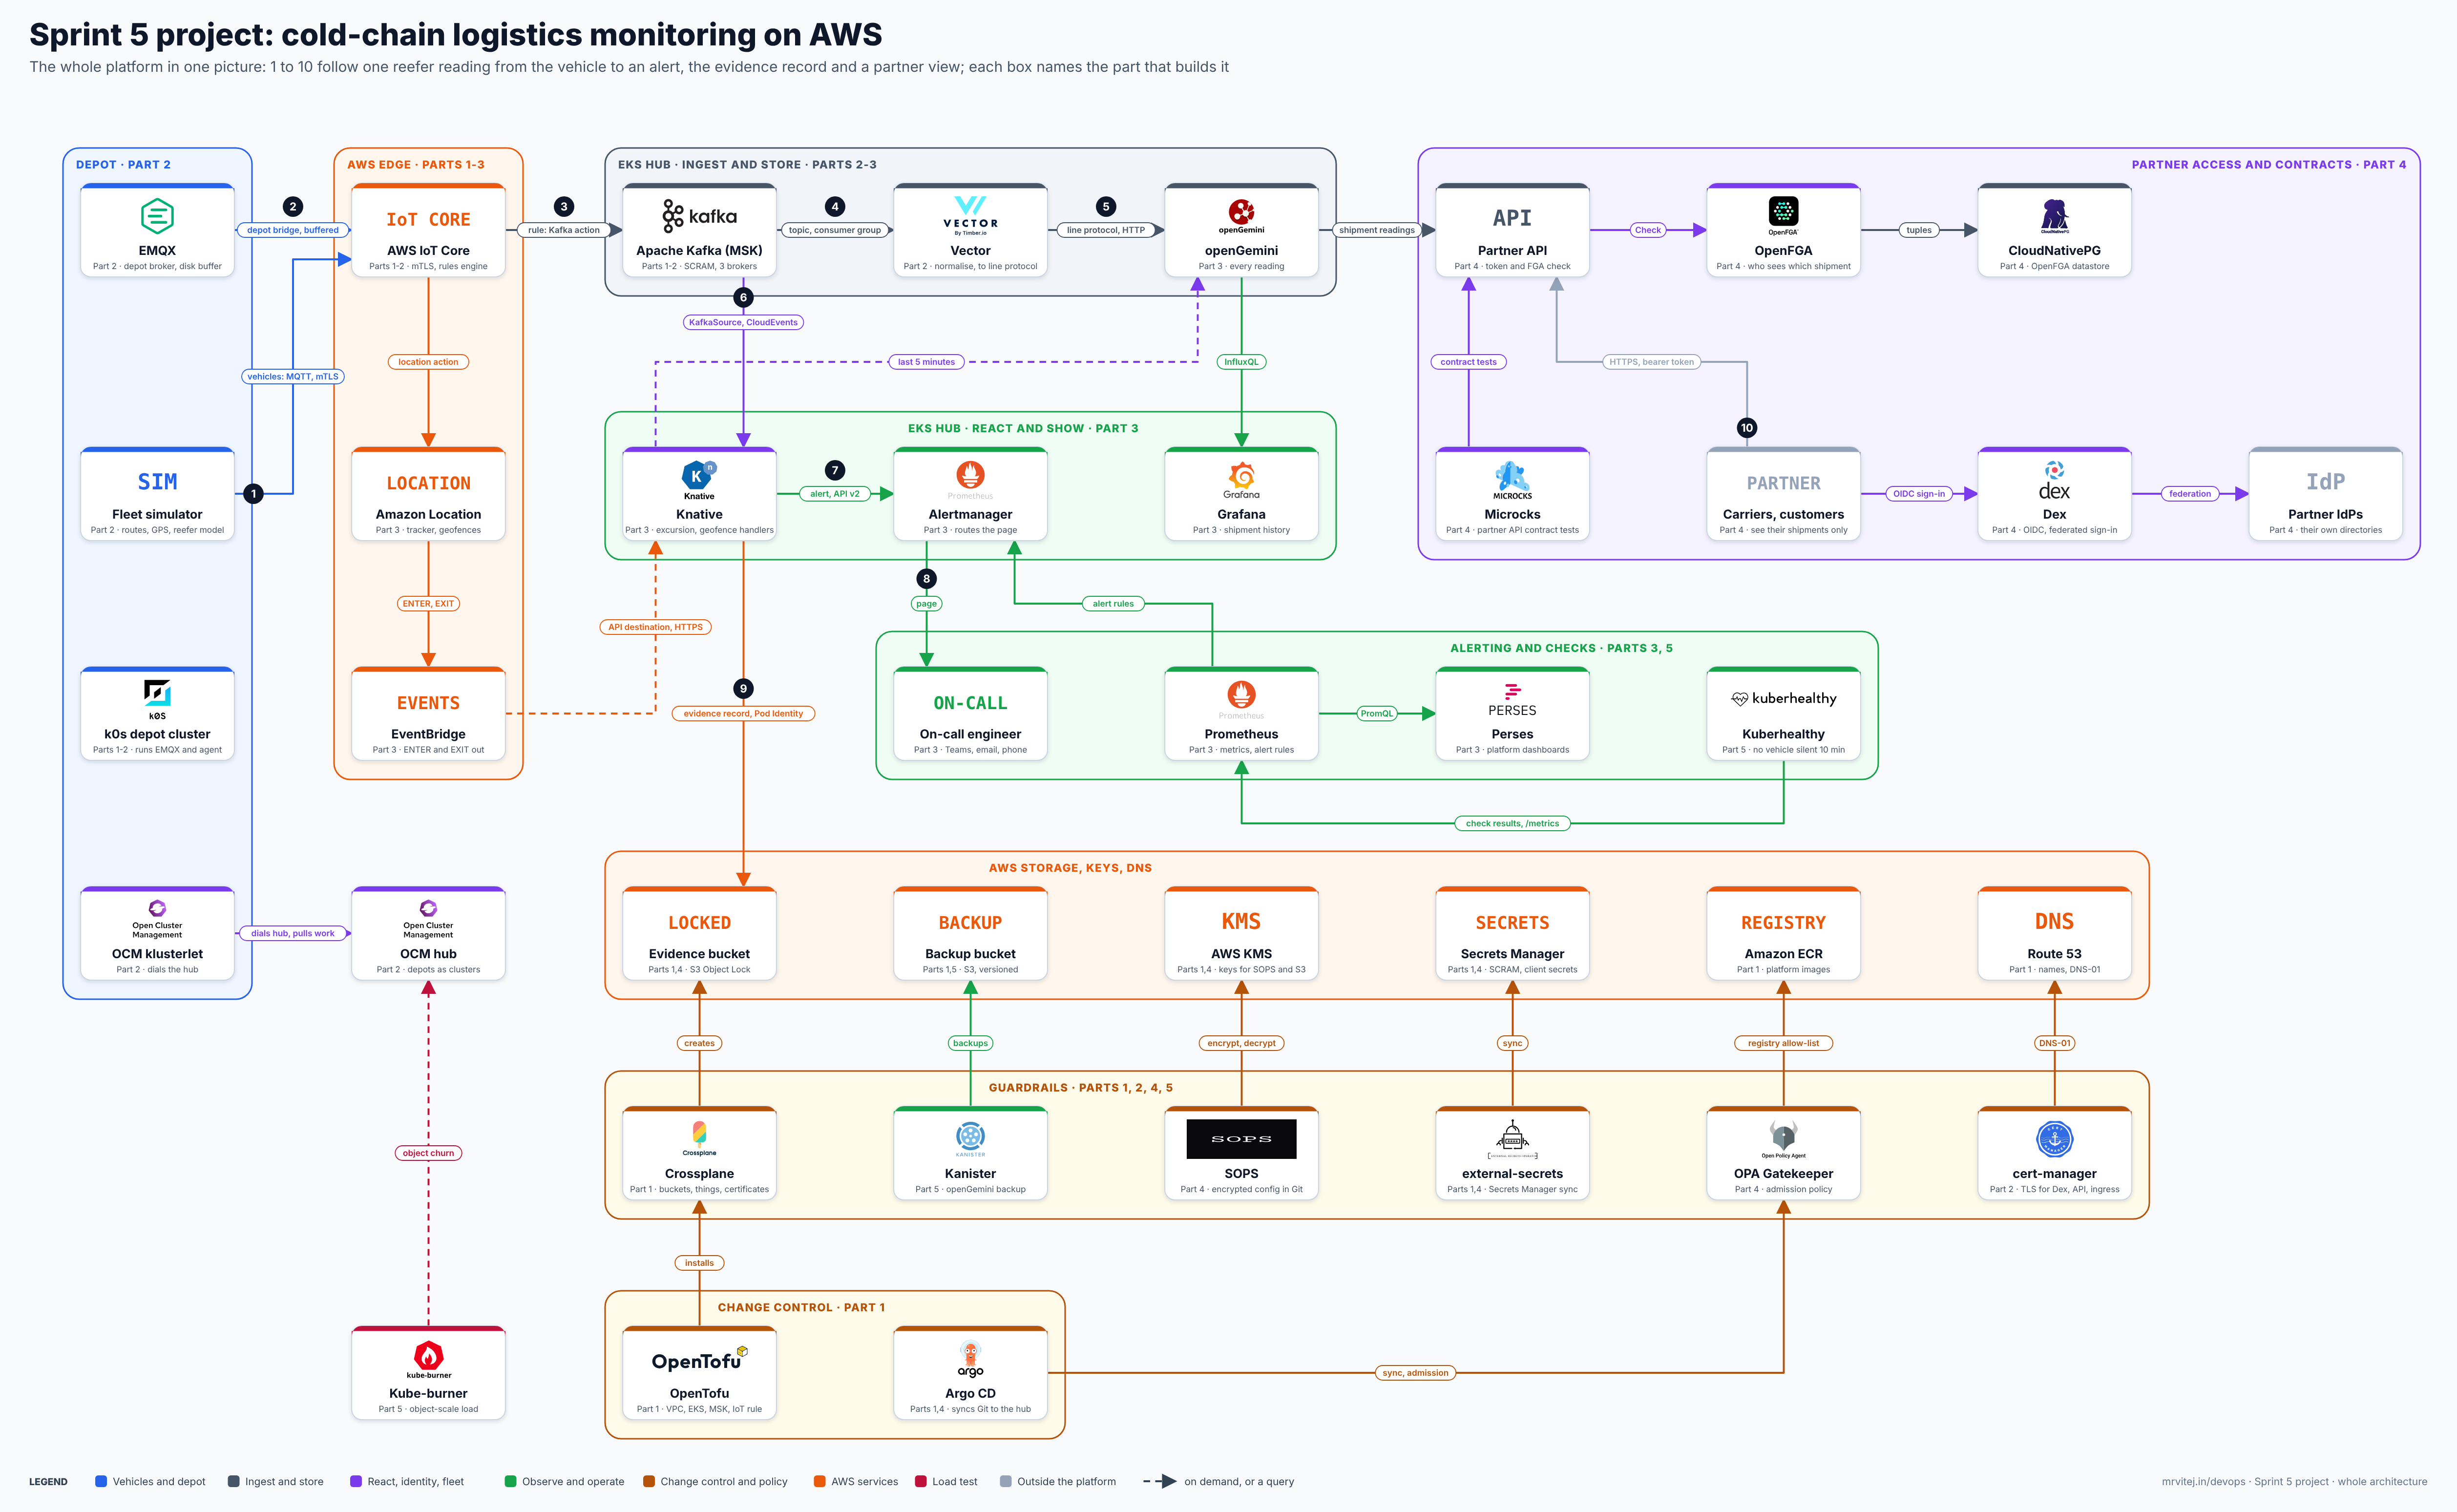
What this is and is not. This is engineering guidance, not legal or regulatory advice, and nothing here is validated or compliant on its own. It is a reference blueprint for a lab: the alert rule, the thresholds and the retention are examples, and whether any of it is enough for a regulated product is for the company’s quality unit to decide. A software alert never replaces the reefer unit’s own controller and alarm. If you find a mismatch with your versions, use the “Suggest a correction” link on this page.
What you build, and in what order
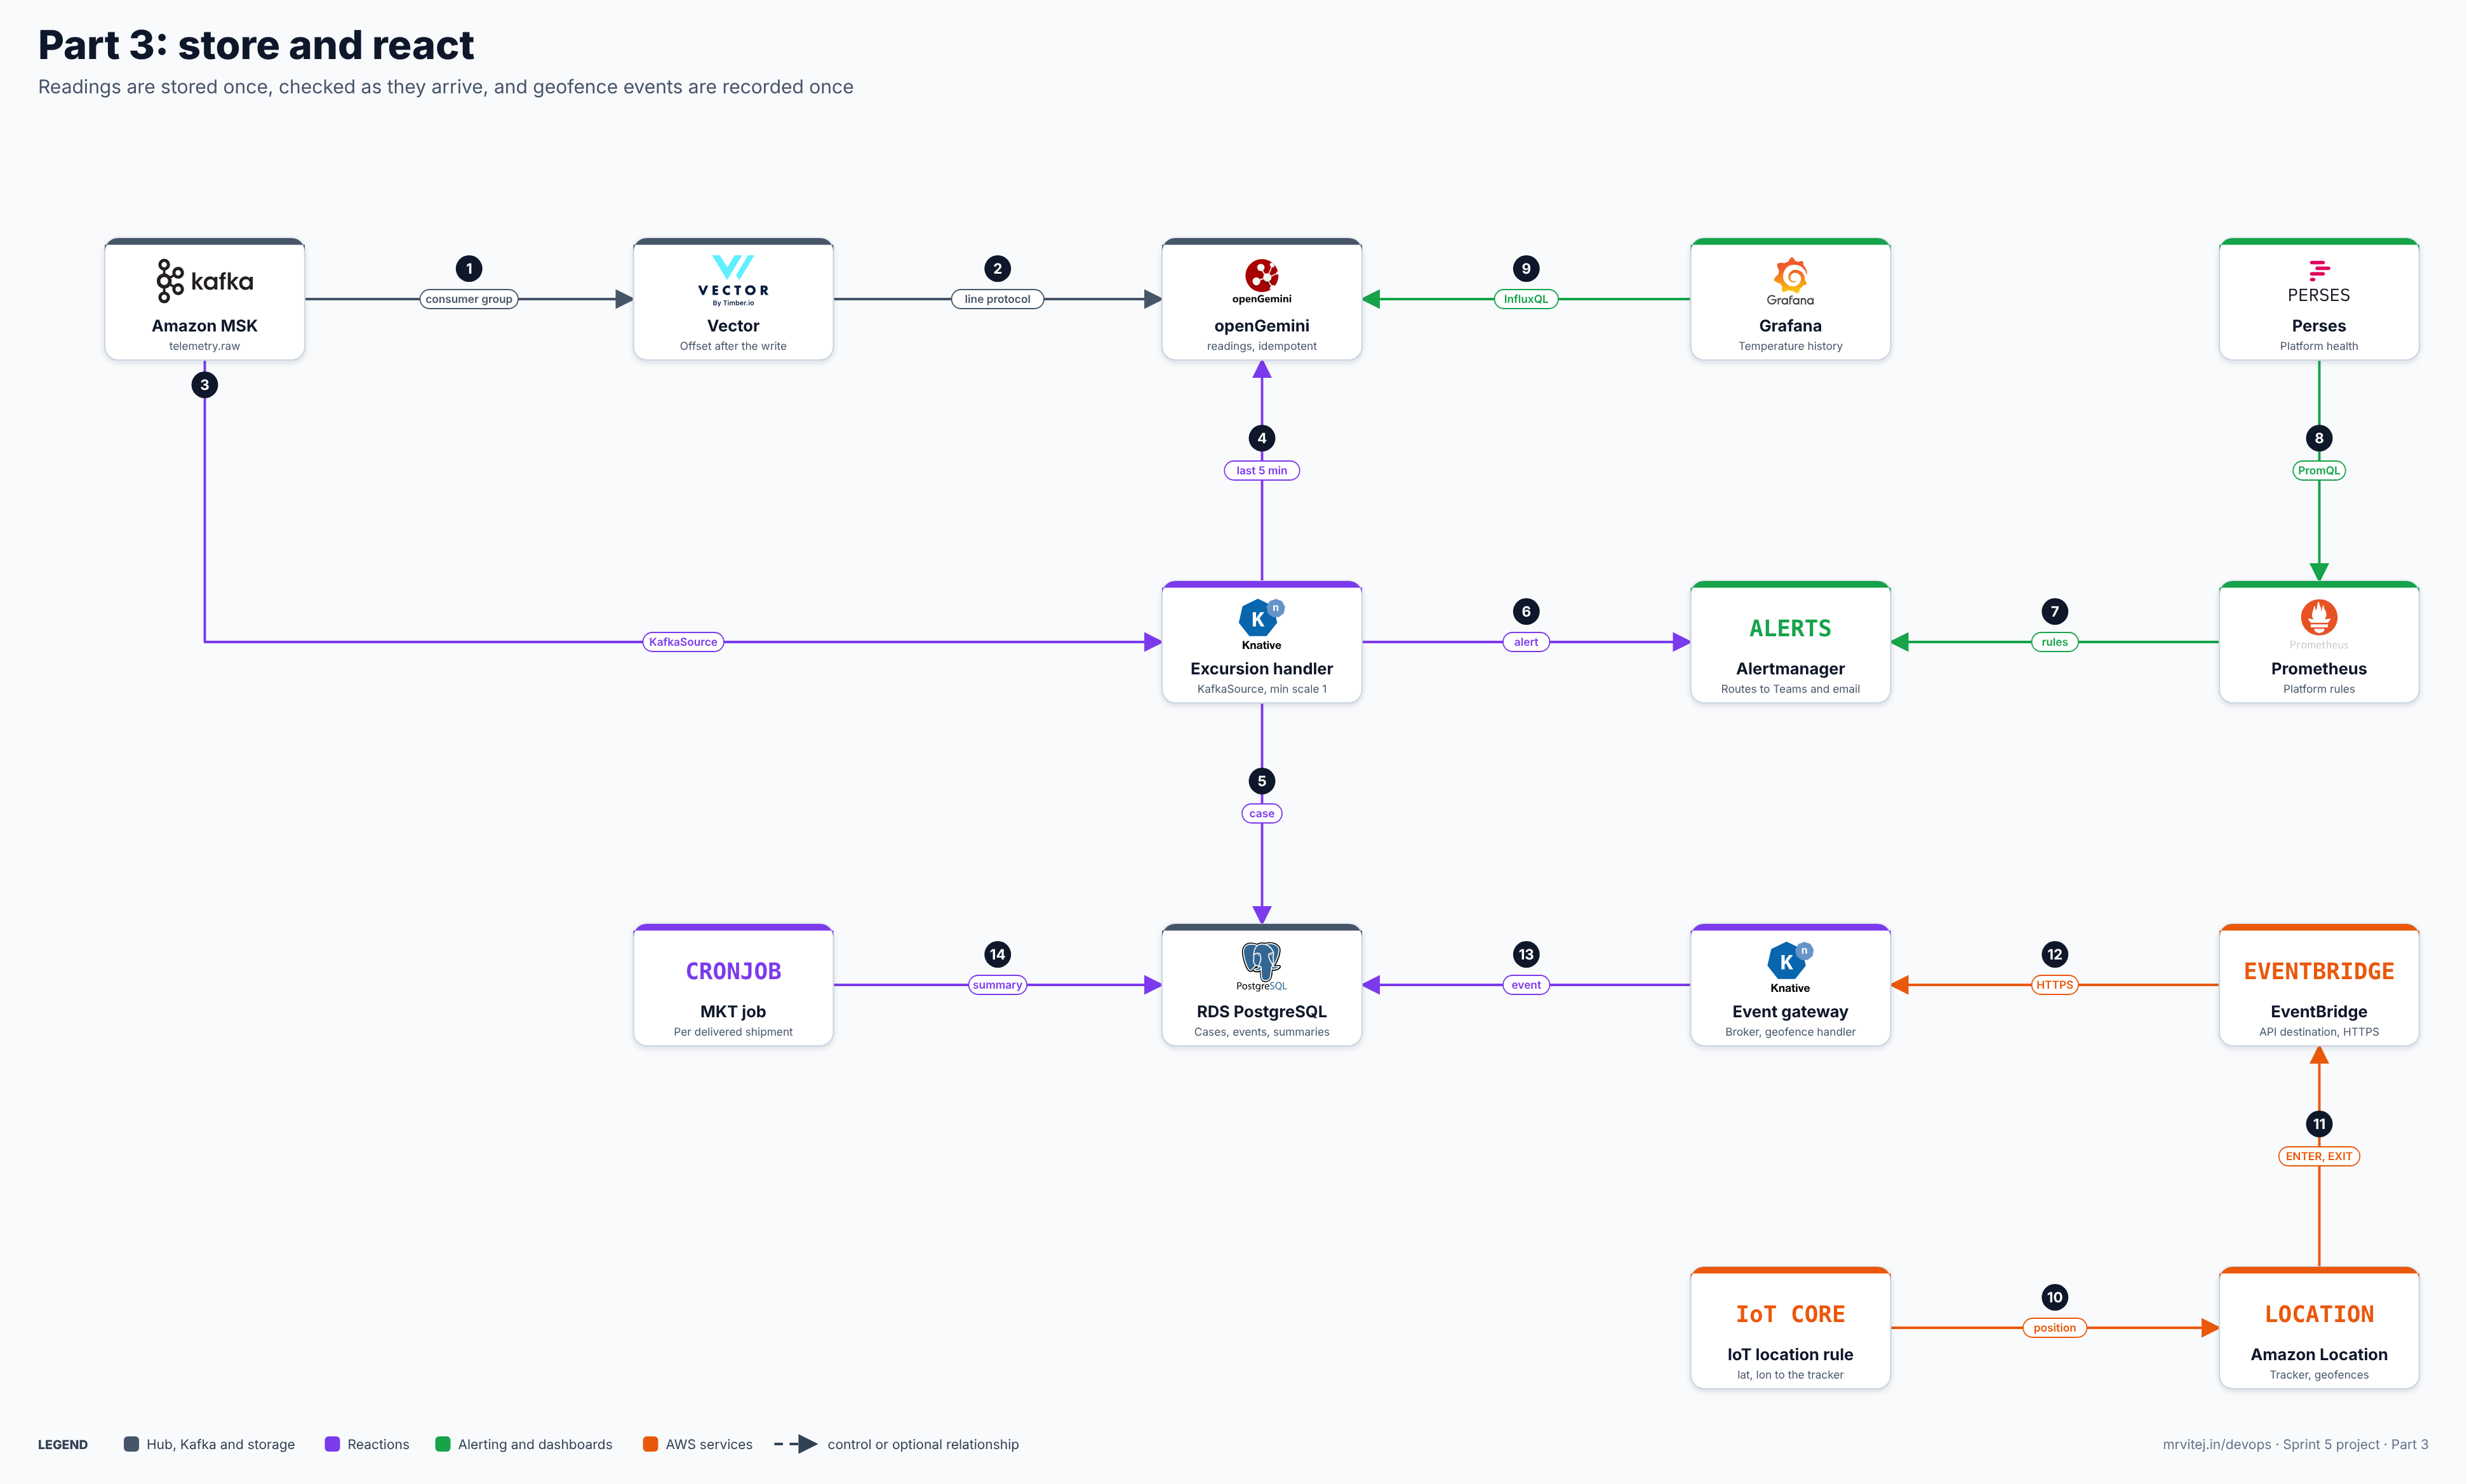
One image, the layers of this part. Open the zoomable diagram, or download it as SVG or PNG.
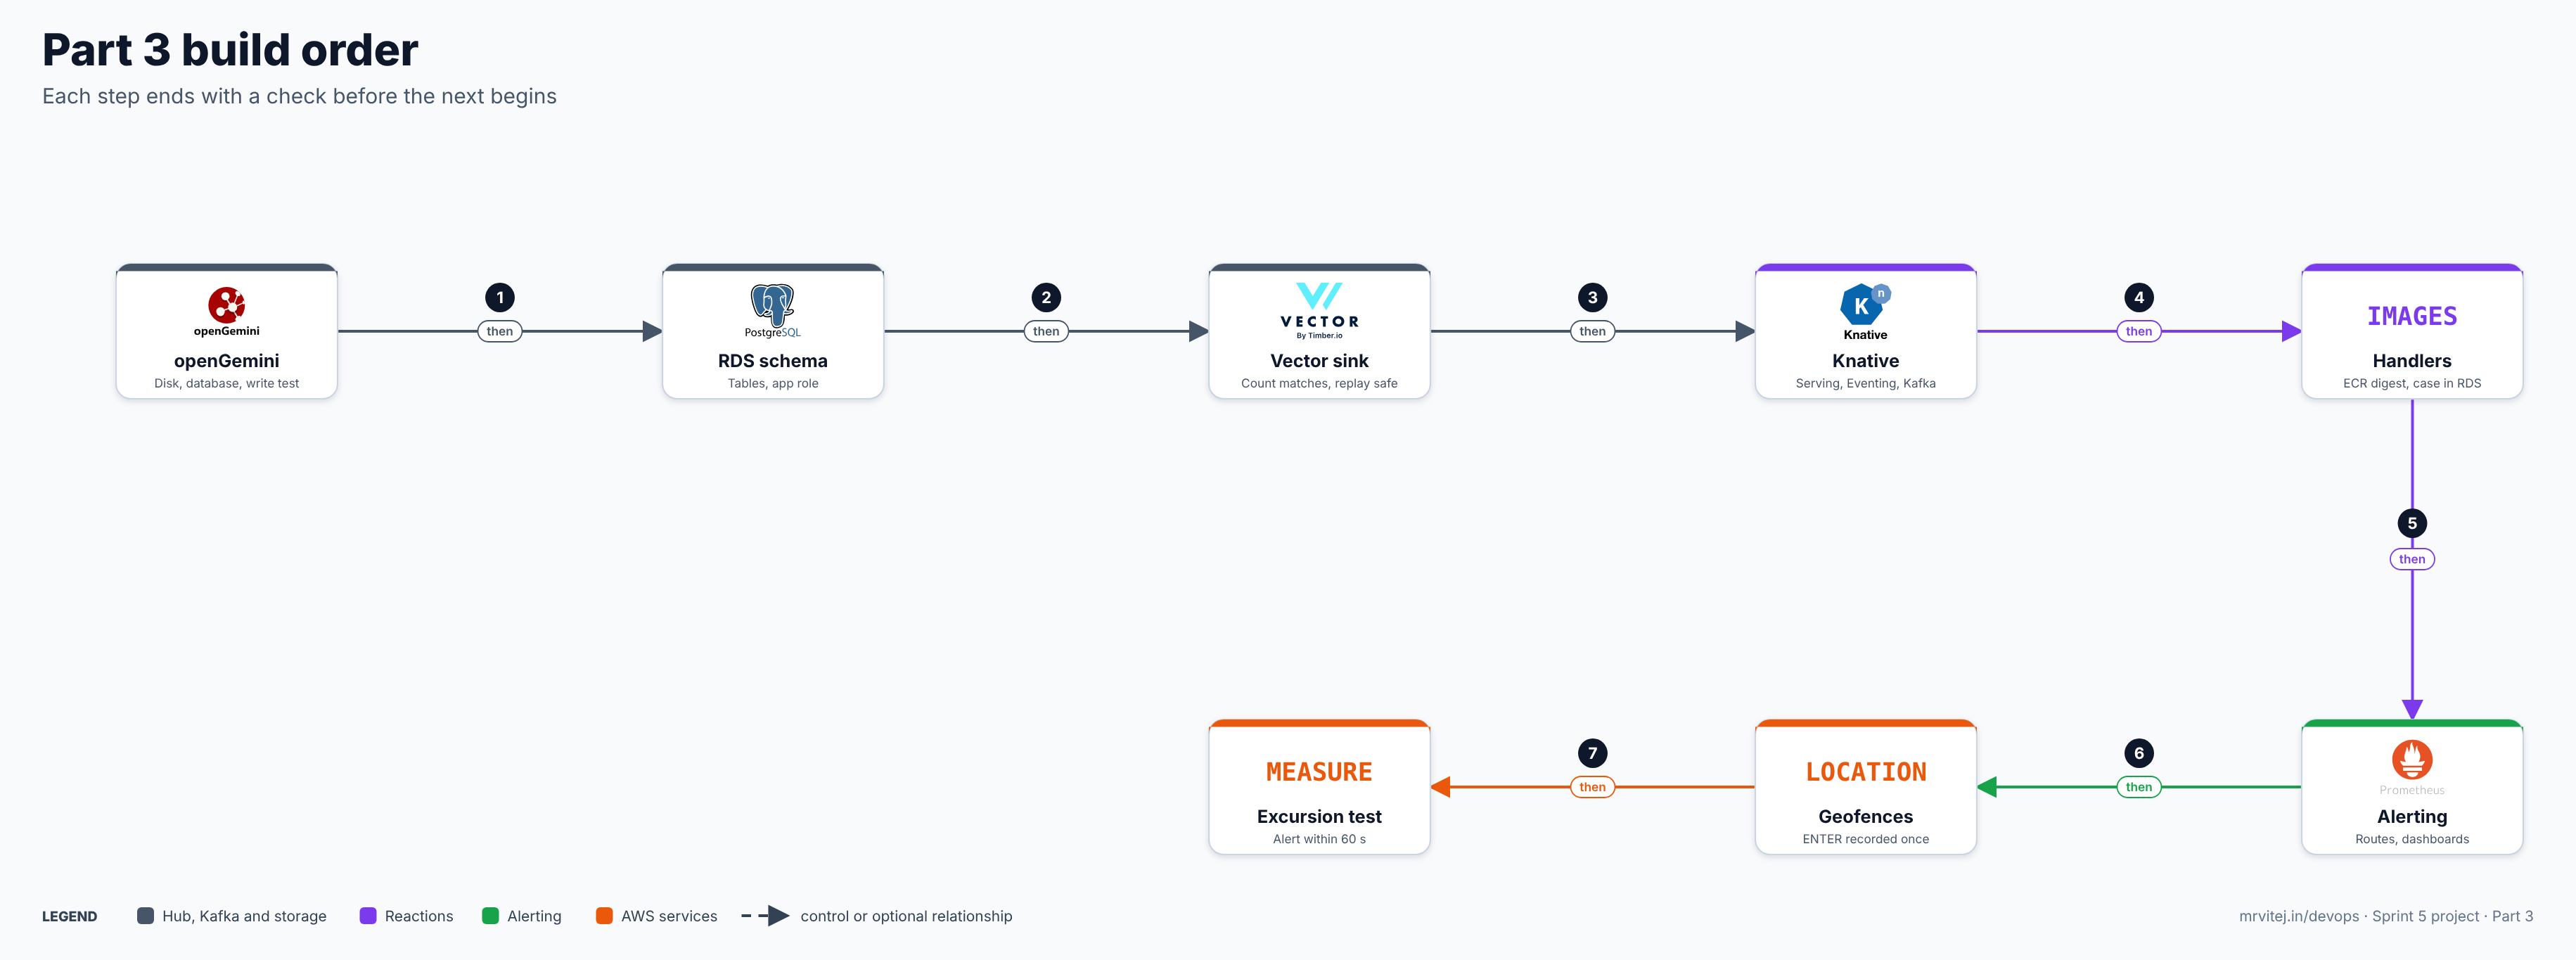
- Prerequisites and versions
- openGemini: disk, database and a write test
- RDS: the schema and an application role
- Vector into openGemini, written once
- Knative: install, images and the excursion handler
- Alerting: Alertmanager, rules, Grafana and Perses
- Geofences: Amazon Location, EventBridge and the gateway
- Mean kinetic temperature per shipment
- The excursion test: how to measure the delay
- Troubleshooting, cost, cleanup, design notes and checklist
The rule, in one place
A source is in excursion when every reading, walking back from the newest one, is above 8.0 °C with no gap longer than 60 seconds, and that run lasts at least 300 seconds. A source is one device, or one cold room of a depot. There is at most one open case per source. A reading at or below the limit closes the case. The limit and the hold time are environment variables, and they are examples: set them from the product’s labelled storage conditions and the quality policy.
Two decisions worth knowing before you start
Readings are stored by the device’s time, so a repeat overwrites. In line protocol a point is identified by its measurement, its tags and its timestamp. Vector writes the device’s own timestamp, with device_id, room and kind as tags. If the same reading arrives twice (MQTT QoS 1 and Kafka producers can both repeat), the second write lands on the same point and changes nothing. That is what “idempotent” means here, and section 4 has a replay check for it.
The handler asks openGemini, not its own memory. Each reading above the limit triggers one query for the preceding six minutes. A reading at or below the limit costs no query. The handler keeps no state that matters: a restart, a second replica or a replayed message gives the same answer, and the open case lives in PostgreSQL where Part 4’s partner API can read it.
1. Prerequisites and versions
| Item | Version or detail | Why |
|---|---|---|
| Parts 1 and 2 complete | Every checkpoint passes; telemetry.raw has data |
Everything here reads it |
| Knative | v1.24.0 (26 Oct 2026), which needs Kubernetes 1.35 or later |
Knative brief |
| Knative Kafka extension | The knative-v1.24.0 release of eventing-kafka-broker, if that tag exists; otherwise the newest release that matches |
KafkaSource and Kafka Broker |
| openGemini | v1.5.2 (v1.5.3 was a release candidate) |
openGemini brief |
| Vector | The chart version Part 2 pinned | Vector brief |
| kube-prometheus-stack | Pin the version helm search repo prometheus-community/kube-prometheus-stack shows |
Prometheus, Alertmanager, Grafana |
| Perses | Chart perses/perses; pin what helm search repo perses shows |
Perses brief |
Docker with buildx |
Any current version | Builds the handler images |
psql is not needed locally |
A Kubernetes Job runs it | The RDS instance is private |
Set the shell variables this part uses (values from Parts 1 and 2):
export AWS_REGION=ap-south-1
export DOMAIN=coldchain.example.com
cd cold-chain/infra/foundation
export PG_HOST=$(tofu output -raw pg_endpoint)
export PG_SECRET_ARN=$(tofu output -raw pg_secret_arn)
export BOOT=$(aws kafka get-bootstrap-brokers --cluster-arn $(tofu output -raw msk_cluster_arn) \
  --query BootstrapBrokerStringSaslScram --output text)
cd ../..
kubectl --context hub get nodes
kubectl --context hub -n ingest logs deploy/vector --tail=3
Expected: three Ready nodes and Vector log lines for real readings. If the simulators from Part 2 are not running, start them now (python simulator/fleet.py ...), because this part needs live data. Create the working folders:
mkdir -p handlers/excursion handlers/geofence db platform/knative platform/monitoring platform/dashboards/perses ops scriptsCheckpoint 1. The exports print, the cluster answers, and Vector is processing readings.
2. openGemini: disk, database and a write test
2.1 Storage on the hub
The hub has no volume driver yet, and openGemini needs a disk that outlives the pod. Add the Amazon EBS CSI driver as an EKS add-on, with Pod Identity as in Part 1.
# infra/foundation/ebs-csi.tf
resource "aws_iam_role" "ebs_csi" {
  name               = "${var.name}-ebs-csi"
  assume_role_policy = data.aws_iam_policy_document.pod_trust.json
}

resource "aws_iam_role_policy_attachment" "ebs_csi" {
  role       = aws_iam_role.ebs_csi.name
  policy_arn = "arn:aws:iam::aws:policy/service-role/AmazonEBSCSIDriverPolicy"
}

resource "aws_eks_pod_identity_association" "ebs_csi" {
  cluster_name    = module.eks.cluster_name
  namespace       = "kube-system"
  service_account = "ebs-csi-controller-sa"
  role_arn        = aws_iam_role.ebs_csi.arn
}

resource "aws_eks_addon" "ebs_csi" {
  cluster_name = module.eks.cluster_name
  addon_name   = "aws-ebs-csi-driver"
  depends_on   = [aws_eks_pod_identity_association.ebs_csi]
}(cd infra/foundation && tofu apply)
kubectl --context hub -n kube-system get pods -l app=ebs-csi-controllerExpected: the controller pods Running. Then a default storage class. Volumes are encrypted with the account’s default EBS key here; use a customer-managed key (kmsKeyId in the parameters, and a grant for the driver’s role) when the quality policy asks for key control.
# platform/storageclass.yaml
apiVersion: storage.k8s.io/v1
kind: StorageClass
metadata:
  name: gp3
  annotations: { storageclass.kubernetes.io/is-default-class: "true" }
provisioner: ebs.csi.aws.com
parameters: { type: gp3, encrypted: "true" }
volumeBindingMode: WaitForFirstConsumer
allowVolumeExpansion: true
reclaimPolicy: Delete
kubectl --context hub apply -f platform/storageclass.yaml2.2 The server
One ts-server (the single binary that bundles ts-sql, ts-meta and ts-store) is enough for a lab and for the example load, which is roughly 80 messages a second. The openGemini brief covers the cluster layout for more. Check the image tag before you apply the manifest:
docker manifest inspect opengeminidb/opengemini-server:v1.5.2 >/dev/null && echo "tag v1.5.2 exists" \
  || docker manifest inspect opengeminidb/opengemini-server:1.5.2 >/dev/null && echo "tag 1.5.2 exists"
Whichever form prints, put it in the manifest. The image keeps its data in /var/lib/openGemini, which is where the volume goes. A NetworkPolicy limits who may connect, because authentication is off in this build (see the design notes).
# platform/opengemini.yaml
apiVersion: v1
kind: Namespace
metadata: { name: data }
---
apiVersion: apps/v1
kind: StatefulSet
metadata: { name: opengemini, namespace: data }
spec:
  serviceName: opengemini
  replicas: 1
  selector: { matchLabels: { app: opengemini } }
  template:
    metadata: { labels: { app: opengemini } }
    spec:
      containers:
        - name: opengemini
          image: opengeminidb/opengemini-server:v1.5.2     # confirm the tag, see the check below
          ports: [{ name: http, containerPort: 8086 }]
          readinessProbe: { tcpSocket: { port: 8086 }, periodSeconds: 10 }
          resources:
            requests: { cpu: 500m, memory: 1Gi }
            limits: { memory: 2Gi }
          volumeMounts:
            - { name: data, mountPath: /var/lib/openGemini }
            - { name: logs, mountPath: /var/log/openGemini }
      volumes:
        - { name: logs, emptyDir: {} }
  volumeClaimTemplates:
    - metadata: { name: data }
      spec:
        accessModes: [ReadWriteOnce]
        storageClassName: gp3
        resources: { requests: { storage: 20Gi } }
---
apiVersion: v1
kind: Service
metadata: { name: opengemini, namespace: data }
spec:
  selector: { app: opengemini }
  ports: [{ name: http, port: 8086, targetPort: 8086 }]
---
# Authentication is off in this build (see the design notes), so only named namespaces may connect.
apiVersion: networking.k8s.io/v1
kind: NetworkPolicy
metadata: { name: opengemini-clients, namespace: data }
spec:
  podSelector: { matchLabels: { app: opengemini } }
  policyTypes: [Ingress]
  ingress:
    - from:
        - namespaceSelector:
            matchExpressions:
              - { key: kubernetes.io/metadata.name, operator: In, values: [ingest, react, monitoring, data] }
      ports: [{ port: 8086 }]
kubectl --context hub apply -f platform/opengemini.yaml
kubectl --context hub -n data rollout status statefulset/opengemini --timeout=300s
kubectl --context hub -n data get pvcExpected: the pod Ready and a Bound 20 GiB volume. The network policy only takes effect if the cluster’s network plugin enforces policies: on EKS the VPC CNI does so when its network policy feature is enabled (aws eks update-addon ... --configuration-values '{"enableNetworkPolicy":"true"}' on the vpc-cni add-on).
2.3 The database and its retention
Create the database through the HTTP API from a one-off pod. The retention policy rp400d keeps readings for 400 days with one-day shards, which is an example; take the period from the quality policy.
kubectl --context hub -n data run og-admin --rm -i --restart=Never --image=curlimages/curl --command -- sh -c '
curl -s -XPOST http://opengemini:8086/query --data-urlencode "q=CREATE DATABASE telemetry WITH DURATION 400d REPLICATION 1 SHARD DURATION 1d NAME rp400d"
echo
curl -s -G http://opengemini:8086/query --data-urlencode "q=SHOW RETENTION POLICIES ON telemetry"'
Expected: an empty result for the first call and a table showing rp400d with 400d and default true for the second. If the first call is refused from another pod while it works inside the pod, the server listens on loopback only, see the troubleshooting table.
2.4 A write and a read
Write one point the way Vector will (a measurement, tags, fields and a timestamp) and read it back:
kubectl --context hub -n data run og-test --rm -i --restart=Never --image=curlimages/curl --command -- sh -c '
curl -i -XPOST "http://opengemini:8086/write?db=telemetry&rp=rp400d&precision=s" --data-binary \
  "readings,device_id=reefer-000,room=-,kind=vehicle temp_c=5.2,seq=1i 1790000000"
curl -s -G http://opengemini:8086/query --data-urlencode "db=telemetry" \
  --data-urlencode "q=SELECT * FROM readings WHERE device_id='"'"'reefer-000'"'"'"
echo
curl -s -XPOST "http://opengemini:8086/write?db=telemetry&rp=rp400d&precision=s" --data-binary \
  "readings,device_id=reefer-000,room=-,kind=vehicle temp_c=5.2,seq=1i 1790000000"
curl -s -G http://opengemini:8086/query --data-urlencode "db=telemetry" \
  --data-urlencode "q=SELECT count(temp_c) FROM readings WHERE device_id='"'"'reefer-000'"'"'"'
Expected: HTTP/1.1 204 No Content for the write, one row from the first query, and a count of 1 after writing the identical point a second time. That count is the idempotency property in miniature. Delete the test point afterwards with DROP SERIES FROM readings WHERE device_id='reefer-000'.
Checkpoint 2. The volume is bound, the database has the retention policy, and the same point written twice counts once.
3. RDS: the schema and an application role
Business records live in RDS (the owner rule on essential services: a managed relational database is not skipped because it is not a CNCF project). The schema has five tables. shipments links a device to a delivery, excursion_cases has a partial unique index that allows one open case per source, geofence_events uses the CloudEvent ID as its key so a repeat is ignored, and shipment_summaries holds the derived values apart from the raw readings.
-- db/schema.sql
CREATE TABLE IF NOT EXISTS devices (
  device_id text PRIMARY KEY, kind text NOT NULL, label text);

CREATE TABLE IF NOT EXISTS shipments (
  shipment_id text PRIMARY KEY,
  device_id   text NOT NULL REFERENCES devices,
  carrier     text,
  product     text,
  origin      text,
  destination text,
  limit_c     numeric NOT NULL DEFAULT 8,
  start_time  timestamptz NOT NULL,
  end_time    timestamptz,
  status      text NOT NULL DEFAULT 'in_transit');

CREATE TABLE IF NOT EXISTS excursion_cases (
  case_id         bigserial PRIMARY KEY,
  device_id       text NOT NULL,
  room            text NOT NULL DEFAULT '-',
  shipment_id     text,
  started_at      timestamptz NOT NULL,
  detected_at     timestamptz NOT NULL DEFAULT now(),
  ended_at        timestamptz,
  max_temp_c      numeric,
  limit_c         numeric NOT NULL,
  hold_s          int NOT NULL,
  last_reading_at timestamptz);
CREATE UNIQUE INDEX IF NOT EXISTS one_open_case ON excursion_cases (device_id, room) WHERE ended_at IS NULL;

CREATE TABLE IF NOT EXISTS geofence_events (
  event_id    text PRIMARY KEY,
  event_type  text NOT NULL,
  geofence_id text NOT NULL,
  device_id   text NOT NULL,
  sample_time timestamptz NOT NULL,
  received_at timestamptz NOT NULL DEFAULT now(),
  position    jsonb);

CREATE TABLE IF NOT EXISTS shipment_summaries (
  shipment_id         text PRIMARY KEY REFERENCES shipments,
  computed_at         timestamptz NOT NULL DEFAULT now(),
  readings            int NOT NULL,
  mean_c              numeric, min_c numeric, max_c numeric, mkt_c numeric,
  minutes_above_limit numeric);

INSERT INTO devices VALUES
  ('reefer-001','truck','Truck 1'), ('reefer-002','truck','Truck 2'),
  ('reefer-003','container','Container 1'), ('reefer-004','truck','Test truck')
ON CONFLICT DO NOTHING;
INSERT INTO shipments (shipment_id, device_id, carrier, product, origin, destination, start_time) VALUES
  ('SHP-1001','reefer-001','carrier-a','vaccines','Mumbai','Pune', now()),
  ('SHP-1002','reefer-002','carrier-b','insulin','Mumbai','Pune', now()),
  ('SHP-1003','reefer-003','carrier-a','frozen biologics','Mumbai','Pune', now()),
  ('SHP-1004','reefer-004','carrier-a','test load','Mumbai','Pune', now())
ON CONFLICT DO NOTHING;

-- The handlers' role: no schema changes, no deletes.
\set ON_ERROR_STOP on
DO $$ BEGIN IF NOT EXISTS (SELECT FROM pg_roles WHERE rolname = 'coldchain_app') THEN CREATE ROLE coldchain_app LOGIN; END IF; END $$;
ALTER ROLE coldchain_app PASSWORD :'app_password';
GRANT SELECT ON devices TO coldchain_app;
GRANT SELECT, UPDATE ON shipments TO coldchain_app;
GRANT SELECT, INSERT, UPDATE ON excursion_cases TO coldchain_app;
GRANT USAGE ON SEQUENCE excursion_cases_case_id_seq TO coldchain_app;
GRANT SELECT, INSERT ON geofence_events, shipment_summaries TO coldchain_app;
The script ends by creating a login role for the handlers. That role can read and write only what it needs and cannot change the schema or delete. Put the connection details in Kubernetes Secrets (Part 4 moves this to external-secrets):
kubectl --context hub create namespace react
PGJSON=$(aws secretsmanager get-secret-value --secret-id "$PG_SECRET_ARN" --query SecretString --output text)
kubectl --context hub -n react create secret generic pg-admin \
  --from-literal=host="$PG_HOST" \
  --from-literal=username="$(jq -r .username <<<"$PGJSON")" \
  --from-literal=password="$(jq -r .password <<<"$PGJSON")"
APP_PW=$(openssl rand -base64 24 | tr -d '/+=')
kubectl --context hub -n react create secret generic pg-app \
  --from-literal=host="$PG_HOST" --from-literal=password="$APP_PW"
unset PGJSON APP_PW
The Job below carries the script in a ConfigMap and runs psql as the administrator, once:
# platform/db-init.yaml
apiVersion: v1
kind: ConfigMap
metadata: { name: db-schema, namespace: react }
data:
  schema.sql: |
    CREATE TABLE IF NOT EXISTS devices (
      device_id text PRIMARY KEY, kind text NOT NULL, label text);

    CREATE TABLE IF NOT EXISTS shipments (
      shipment_id text PRIMARY KEY,
      device_id   text NOT NULL REFERENCES devices,
      carrier     text,
      product     text,
      origin      text,
      destination text,
      limit_c     numeric NOT NULL DEFAULT 8,
      start_time  timestamptz NOT NULL,
      end_time    timestamptz,
      status      text NOT NULL DEFAULT 'in_transit');

    CREATE TABLE IF NOT EXISTS excursion_cases (
      case_id         bigserial PRIMARY KEY,
      device_id       text NOT NULL,
      room            text NOT NULL DEFAULT '-',
      shipment_id     text,
      started_at      timestamptz NOT NULL,
      detected_at     timestamptz NOT NULL DEFAULT now(),
      ended_at        timestamptz,
      max_temp_c      numeric,
      limit_c         numeric NOT NULL,
      hold_s          int NOT NULL,
      last_reading_at timestamptz);
    CREATE UNIQUE INDEX IF NOT EXISTS one_open_case ON excursion_cases (device_id, room) WHERE ended_at IS NULL;

    CREATE TABLE IF NOT EXISTS geofence_events (
      event_id    text PRIMARY KEY,
      event_type  text NOT NULL,
      geofence_id text NOT NULL,
      device_id   text NOT NULL,
      sample_time timestamptz NOT NULL,
      received_at timestamptz NOT NULL DEFAULT now(),
      position    jsonb);

    CREATE TABLE IF NOT EXISTS shipment_summaries (
      shipment_id         text PRIMARY KEY REFERENCES shipments,
      computed_at         timestamptz NOT NULL DEFAULT now(),
      readings            int NOT NULL,
      mean_c              numeric, min_c numeric, max_c numeric, mkt_c numeric,
      minutes_above_limit numeric);

    INSERT INTO devices VALUES
      ('reefer-001','truck','Truck 1'), ('reefer-002','truck','Truck 2'),
      ('reefer-003','container','Container 1'), ('reefer-004','truck','Test truck')
    ON CONFLICT DO NOTHING;
    INSERT INTO shipments (shipment_id, device_id, carrier, product, origin, destination, start_time) VALUES
      ('SHP-1001','reefer-001','carrier-a','vaccines','Mumbai','Pune', now()),
      ('SHP-1002','reefer-002','carrier-b','insulin','Mumbai','Pune', now()),
      ('SHP-1003','reefer-003','carrier-a','frozen biologics','Mumbai','Pune', now()),
      ('SHP-1004','reefer-004','carrier-a','test load','Mumbai','Pune', now())
    ON CONFLICT DO NOTHING;

    -- The handlers' role: no schema changes, no deletes.
    \set ON_ERROR_STOP on
    DO $$ BEGIN IF NOT EXISTS (SELECT FROM pg_roles WHERE rolname = 'coldchain_app') THEN CREATE ROLE coldchain_app LOGIN; END IF; END $$;
    ALTER ROLE coldchain_app PASSWORD :'app_password';
    GRANT SELECT ON devices TO coldchain_app;
    GRANT SELECT, UPDATE ON shipments TO coldchain_app;
    GRANT SELECT, INSERT, UPDATE ON excursion_cases TO coldchain_app;
    GRANT USAGE ON SEQUENCE excursion_cases_case_id_seq TO coldchain_app;
    GRANT SELECT, INSERT ON geofence_events, shipment_summaries TO coldchain_app;
---
apiVersion: batch/v1
kind: Job
metadata: { name: db-init, namespace: react }
spec:
  backoffLimit: 2
  template:
    spec:
      restartPolicy: Never
      containers:
        - name: psql
          image: postgres:17-alpine
          command: ["sh", "-c", "psql -v ON_ERROR_STOP=1 -v app_password=\"$APP_PASSWORD\" -f /sql/schema.sql"]
          env:
            - { name: PGHOST, valueFrom: { secretKeyRef: { name: pg-admin, key: host } } }
            - { name: PGDATABASE, value: coldchain }
            - { name: PGUSER, valueFrom: { secretKeyRef: { name: pg-admin, key: username } } }
            - { name: PGPASSWORD, valueFrom: { secretKeyRef: { name: pg-admin, key: password } } }
            - { name: PGSSLMODE, value: require }
            - { name: APP_PASSWORD, valueFrom: { secretKeyRef: { name: pg-app, key: password } } }
          volumeMounts: [{ name: sql, mountPath: /sql }]
      volumes: [{ name: sql, configMap: { name: db-schema } }]
kubectl --context hub apply -f platform/db-init.yaml
kubectl --context hub -n react wait --for=condition=complete job/db-init --timeout=180s
kubectl --context hub -n react logs job/db-init | tail -5Expected: the Job completes and the log ends with GRANT lines. Run it again and it still completes: every statement is repeatable. The administrator secret in react is only for this Job; delete it once the schema exists if you want it out of the cluster (kubectl -n react delete secret pg-admin).
Checkpoint 3. db-init is complete, and a second run finishes without errors.
4. Vector into openGemini, written once
Part 2’s Vector printed events to its log. Now it writes them. The new values file keeps the Kafka source, the normalise and filter steps and the dead-letter output, and adds a step that shapes each event for line protocol and a sink for openGemini. Three details carry the guarantees:
- The point’s time is the device’s time. The sink uses an event’s
timestampfield as the point time, so the step renameststotimestamp. A replayed reading then lands on the same point. - Tags are chosen on purpose.
device_id,roomandkindidentify the series. Depot rooms have a room name; vehicles get-, so the tag is never empty. - The offset moves after the write.
acknowledgements.enabledon the sink makes Vector commit a Kafka offset only once openGemini has accepted the batch. Without it the source acknowledges as soon as Vector has the event, and a crash in between loses it. Part 2 described this behaviour; this setting is what delivers it.
# platform/vector-values.yaml
role: Stateless-Aggregator
replicas: 2
env:
  - { name: KAFKA_BOOTSTRAP, valueFrom: { secretKeyRef: { name: msk-scram, key: bootstrap } } }
  - { name: KAFKA_USERNAME,  valueFrom: { secretKeyRef: { name: msk-scram, key: username } } }
  - { name: KAFKA_PASSWORD,  valueFrom: { secretKeyRef: { name: msk-scram, key: password } } }
customConfig:
  data_dir: /vector-data-dir
  api: { enabled: true, address: 127.0.0.1:8686 }
  sources:
    from_kafka:
      type: kafka
      bootstrap_servers: "${KAFKA_BOOTSTRAP}"
      group_id: vector-normaliser
      topics: [telemetry.raw]
      auto_offset_reset: earliest
      sasl: { enabled: true, mechanism: SCRAM-SHA-512, username: "${KAFKA_USERNAME}", password: "${KAFKA_PASSWORD}" }
      tls: { enabled: true }
  transforms:
    normalise:
      type: remap
      inputs: [from_kafka]
      drop_on_error: true
      reroute_dropped: true
      source: |
        . = parse_json!(.message)
        .device_id = to_string!(.device_id)
        .seq = to_int!(.seq)
        .temp_c = to_float!(.temp_c)
        .ts = parse_timestamp!(.ts, format: "%+")
        .kind = if starts_with(.device_id, "reefer") { "vehicle" } else if starts_with(.device_id, "depot") { "depot" } else { "other" }
    keep_valid:
      type: filter
      inputs: [normalise]
      condition: .temp_c > -60.0 && .temp_c < 60.0 && .seq > 0
    to_influx:
      type: remap
      inputs: [keep_valid]
      source: |
        .timestamp = .ts          # the device's time becomes the point's time, so a replay overwrites the same point
        del(.ts)
        .room = string(.room) ?? "-"
  sinks:
    opengemini:
      type: influxdb_logs
      inputs: [to_influx]
      version: "1"
      endpoint: http://opengemini.data.svc.cluster.local:8086
      database: telemetry
      retention_policy_name: rp400d
      measurement: readings
      tags: [device_id, room, kind]
      acknowledgements: { enabled: true }   # the Kafka offset moves only after openGemini accepted the write
      batch: { max_events: 500, timeout_secs: 1 }
    show_dropped:
      type: console
      inputs: [normalise.dropped]
      encoding: { codec: json }
helm upgrade vector vector/vector -n ingest -f platform/vector-values.yaml --kube-context hub
kubectl --context hub -n ingest rollout status deploy/vector
kubectl --context hub -n ingest logs deploy/vector --tail=10Expected: two Running pods and no error lines; the sink’s health check passes at start-up. Field types matter: openGemini, like InfluxDB, fixes a field’s type at first write, so a field that is a float one day and an integer the next is rejected. The normalise step casts temp_c to a float and seq to an integer; the other fields come from the simulators as the same JSON types every time.
4.1 The count check
The simulators number their readings 1, 2, 3 and so on. If every reading is stored once, then for each source the count equals the last number minus the first plus one. ops/check_store.py tests exactly that:
# ops/check_store.py
#!/usr/bin/env python3
"""Compare what openGemini holds with what the simulators sent. Run through: kubectl -n data port-forward svc/opengemini 8086:8086
usage: check_store.py <since-epoch-seconds>
Every simulator numbers its readings 1, 2, 3 ... so count == max - min + 1 means nothing is missing and nothing is stored twice."""
import json, sys, urllib.parse, urllib.request
from datetime import datetime, timezone

URL, DB = "http://localhost:8086", "telemetry"
since = datetime.fromtimestamp(float(sys.argv[1]), timezone.utc).isoformat().replace("+00:00", "Z")
q = (f"SELECT count(seq), min(seq), max(seq) FROM readings WHERE time >= '{since}' GROUP BY device_id, room")
with urllib.request.urlopen(f"{URL}/query?" + urllib.parse.urlencode({"db": DB, "q": q}), timeout=30) as r:
    res = json.load(r)["results"][0]
ok = True
for s in sorted(res.get("series", []), key=lambda s: (s["tags"]["device_id"], s["tags"]["room"])):
    _, n, lo, hi = s["values"][0]
    good = n == hi - lo + 1
    ok &= good
    print(f"{s['tags']['device_id']:16} {s['tags']['room']:8} stored={n:5} first={lo} last={hi} {'ok' if good else 'MISMATCH'}")
print("RESULT:", "PASS" if ok and res.get("series") else "FAIL")
Start the simulators fresh (delete their *.spool.db files first, as in Part 2), let them run 10 minutes, note the start time, and run the check through a port-forward:
START=$(date +%s)                       # before you start the simulators
kubectl --context hub -n data port-forward svc/opengemini 8086:8086 &
python3 ops/check_store.py $START
Expected, in this shape:
reefer-001       -        stored=   61 first=1 last=61 ok
reefer-002       -        stored=   61 first=1 last=61 ok
reefer-003       -        stored=   61 first=1 last=61 ok
RESULT: PASS
The numbers depend on how long you ran. PASS means no missing and no doubled readings between the simulators and the store. A MISMATCH with a count below the range means a loss; above it cannot happen, because the same time gives the same point.
4.2 The replay check
This proves the “written once” property under a real replay. Stop Vector, move its consumer group back to the start of the topic, start it again, and run the check again. The counts must not change.
kubectl --context hub -n ingest scale deploy/vector --replicas=0
kubectl --context hub -n ingest run reset --rm -i --restart=Never --image=apache/kafka:4.4.0 \
  --overrides='{"spec":{"containers":[{"name":"reset","image":"apache/kafka:4.4.0","stdin":true,
  "command":["/bin/sh","/cfg/run.sh","/opt/kafka/bin/kafka-consumer-groups.sh","--reset-offsets","--group","vector-normaliser","--topic","telemetry.raw","--to-earliest","--execute"],
  "env":[{"name":"KAFKA_USER","valueFrom":{"secretKeyRef":{"name":"msk-scram","key":"username"}}},
  {"name":"KAFKA_PASS","valueFrom":{"secretKeyRef":{"name":"msk-scram","key":"password"}}},
  {"name":"KAFKA_BOOT","valueFrom":{"secretKeyRef":{"name":"msk-scram","key":"bootstrap"}}}],
  "volumeMounts":[{"name":"cfg","mountPath":"/cfg"}]}],"volumes":[{"name":"cfg","configMap":{"name":"kafka-client"}}]}}'
kubectl --context hub -n ingest scale deploy/vector --replicas=2
sleep 120 && python3 ops/check_store.py $START
Expected: the same stored= numbers as before the reset (plus the new readings that arrived meanwhile), and RESULT: PASS. Topic retention is seven days, so a reset replays up to seven days: on a long-running lab, set --to-datetime to a recent time instead of --to-earliest.
Checkpoint 4. The count check passes, and it still passes after the replay.
5. Knative: install, images and the excursion handler
5.1 Install Serving, the Kourier gateway and Eventing with the Kafka extension
Knative has two halves. Serving runs the HTTP functions and scales them. Eventing moves events: a KafkaSource turns Kafka messages into CloudEvents and calls a function, and a Kafka-backed Broker with Triggers routes the geofence events. Kourier is the small ingress that Serving uses here. The install follows the Knative brief:
KN=knative-v1.24.0
kubectl --context hub apply -f https://github.com/knative/serving/releases/download/$KN/serving-crds.yaml
kubectl --context hub apply -f https://github.com/knative/serving/releases/download/$KN/serving-core.yaml
kubectl --context hub apply -f https://github.com/knative-extensions/net-kourier/releases/download/$KN/kourier.yaml
kubectl --context hub patch configmap/config-network -n knative-serving --type merge \
  -p '{"data":{"ingress-class":"kourier.ingress.networking.knative.dev"}}'
kubectl --context hub apply -f https://github.com/knative/eventing/releases/download/$KN/eventing-crds.yaml
kubectl --context hub apply -f https://github.com/knative/eventing/releases/download/$KN/eventing-core.yaml
kubectl --context hub apply -f https://github.com/knative-extensions/eventing-kafka-broker/releases/download/$KN/eventing-kafka-controller.yaml
kubectl --context hub apply -f https://github.com/knative-extensions/eventing-kafka-broker/releases/download/$KN/eventing-kafka-broker.yaml
kubectl --context hub apply -f https://github.com/knative-extensions/eventing-kafka-broker/releases/download/$KN/eventing-kafka-source.yaml
kubectl --context hub -n knative-serving get pods
kubectl --context hub -n knative-eventing get pods
Expected: every pod Running within a few minutes. Two things to confirm for your release: that the Kafka extension has a release with the same tag (if the download fails with 404, use the newest eventing-kafka-broker release listed for the Knative line you installed), and the key name in config-network (older guides use ingress.class; the current install page uses ingress-class).
Kourier creates a public load balancer called kourier by default. This design uses its own, with a certificate, in section 7, so make the default one internal-only now:
kubectl --context hub -n kourier-system patch svc kourier -p '{"spec":{"type":"ClusterIP"}}'5.2 Build the handler images and push them to ECR
The handlers are two small Python programs. The excursion handler holds the rule from the start of this part. The geofence program has three roles chosen by an environment variable: a gateway (the public front for EventBridge), a handler (records each event once) and a dead-letter logger. First the shared helpers:
# handlers/common.py
"""Shared helpers: openGemini queries, Alertmanager posts, PostgreSQL connections."""
import json, os, re, threading, urllib.parse, urllib.request
from datetime import datetime, timezone

OPENGEMINI = os.environ.get("OPENGEMINI_URL", "http://opengemini.data.svc.cluster.local:8086")
OG_DB = os.environ.get("OPENGEMINI_DB", "telemetry")
ALERTMANAGER = os.environ.get(
    "ALERTMANAGER_URL", "http://monitoring-kube-prometheus-alertmanager.monitoring.svc.cluster.local:9093")
SAFE = re.compile(r"^[A-Za-z0-9_.-]{1,64}$")          # device and room names go into InfluxQL, so they are checked


def iso(t):
    return datetime.fromtimestamp(t, timezone.utc).isoformat(timespec="milliseconds").replace("+00:00", "Z")


def epoch(s):
    """RFC 3339 text to epoch seconds. Fractions are cut to 6 digits, which fromisoformat accepts."""
    s = re.sub(r"(\.\d{6})\d+", r"\1", s.replace("Z", "+00:00"))
    return datetime.fromisoformat(s).timestamp()


def og_query(q, timeout=3.0):
    """Run one InfluxQL statement against openGemini and return the rows of the first series."""
    url = f"{OPENGEMINI}/query?" + urllib.parse.urlencode({"db": OG_DB, "q": q})
    with urllib.request.urlopen(url, timeout=timeout) as r:
        res = json.load(r)["results"][0]
    if "error" in res:
        raise RuntimeError(res["error"])
    series = res.get("series") or []
    return series[0]["values"] if series else []


def series_points(device, room, t0, t1):
    """(epoch, temp_c) pairs for one source between two epoch times, oldest first."""
    assert SAFE.match(device) and SAFE.match(room)
    q = (f"SELECT temp_c FROM readings WHERE device_id='{device}' AND room='{room}' "
         f"AND time >= '{iso(t0)}' AND time <= '{iso(t1)}' ORDER BY time ASC")
    return [(epoch(t), float(v)) for t, v in og_query(q) if v is not None]


def post_alert(labels, annotations, starts, ends=None):
    alert = {"labels": labels, "annotations": annotations, "startsAt": iso(starts)}
    if ends:
        alert["endsAt"] = iso(ends)
    req = urllib.request.Request(f"{ALERTMANAGER}/api/v2/alerts", data=json.dumps([alert]).encode(),
                                 headers={"content-type": "application/json"}, method="POST")
    urllib.request.urlopen(req, timeout=3).read()


_local = threading.local()


def db():
    """One PostgreSQL connection per thread. libpq reads PGHOST, PGDATABASE, PGUSER, PGPASSWORD, PGSSLMODE."""
    import psycopg
    c = getattr(_local, "conn", None)
    if c is None or c.closed:
        c = psycopg.connect(autocommit=True, connect_timeout=5)
        _local.conn = c
    return c
The excursion handler. Read evaluate first: it is the whole rule, as a pure function with no network in it, so it can be tested on a laptop.
# handlers/excursion/app.py
#!/usr/bin/env python3
"""Excursion handler. A KafkaSource delivers one CloudEvent per reading; the body is the reading as JSON.

Rule: a source is in excursion when every reading, walking back from this one, is above the limit
with no gap longer than MAX_GAP_S, and the run lasts at least HOLD_S. One open case per source."""
import json, os, sys, time
from http.server import BaseHTTPRequestHandler, ThreadingHTTPServer
sys.path.insert(0, os.path.dirname(os.path.dirname(os.path.abspath(__file__))))
from common import SAFE, db, epoch, iso, og_query, post_alert, series_points

LIMIT_C = float(os.environ.get("LIMIT_C", "8.0"))
HOLD_S = int(os.environ.get("HOLD_S", "300"))
MAX_GAP_S = int(os.environ.get("MAX_GAP_S", "60"))
REFRESH_S = int(os.environ.get("REFRESH_S", "60"))       # Alertmanager expires alerts that are not refreshed
LATE_S = int(os.environ.get("LATE_S", "120"))            # older than this on arrival: a backlog replay, not live
STATE = {}                                               # per-source cache, rebuilt from PostgreSQL when empty


def evaluate(points, limit, hold_s, max_gap_s):
    """points: (epoch, temp) oldest first, the current reading last. Returns (hit, run_start_epoch)."""
    if not points or points[-1][1] <= limit:
        return False, None
    start = points[-1][0]
    for (t, v), (t_next, _) in zip(reversed(points[:-1]), reversed(points[1:])):
        if v <= limit or t_next - t > max_gap_s:
            break
        start = t
    return points[-1][0] - start >= hold_s, start


def open_case(dev, room):
    with db().cursor() as cur:
        cur.execute("SELECT case_id, shipment_id, extract(epoch FROM started_at) FROM excursion_cases "
                    "WHERE device_id=%s AND room=%s AND ended_at IS NULL", (dev, room))
        return cur.fetchone()


def alert_labels(dev, room, shipment):
    return {"alertname": "ColdChainExcursion", "severity": "critical", "source": "coldchain",
            "device": dev, "room": room, "shipment": shipment or "none"}


def handle_reading(d, now=None):
    now = now or time.time()
    dev, room = str(d["device_id"]), str(d.get("room") or "-")
    temp, ts = float(d["temp_c"]), epoch(d["ts"])
    if not (SAFE.match(dev) and SAFE.match(room)) or not -60.0 < temp < 60.0:
        return "ignored: invalid reading"
    st = STATE.setdefault(f"{dev}|{room}", {"open": None, "last_post": 0.0})

    if temp <= LIMIT_C:                                   # back in range: close a case if one is open
        if st["open"] is None:
            st["open"] = open_case(dev, room) is not None
        if not st["open"]:
            return "ok"
        case = open_case(dev, room)
        if case:
            case_id, shipment, started = case
            top = og_query(f"SELECT max(temp_c) FROM readings WHERE device_id='{dev}' AND room='{room}' "
                           f"AND time >= '{iso(float(started))}' AND time <= '{iso(ts)}'")
            peak = top[0][1] if top else temp
            with db().cursor() as cur:
                cur.execute("UPDATE excursion_cases SET ended_at=to_timestamp(%s), max_temp_c=%s, "
                            "last_reading_at=to_timestamp(%s) WHERE case_id=%s AND ended_at IS NULL",
                            (ts, peak, ts, case_id))
            post_alert(alert_labels(dev, room, shipment),
                       {"summary": f"{dev} {room} back in range at {temp:.1f} C (peak {peak:.1f} C)"}, float(started), ends=ts)
        st["open"] = False
        return "closed"

    # Above the limit: ask openGemini for the run leading up to this reading.
    lookback = HOLD_S + MAX_GAP_S
    pts = [p for p in series_points(dev, room, ts - lookback, ts) if p[0] < ts] + [(ts, temp)]
    hit, started = evaluate(pts, LIMIT_C, HOLD_S, MAX_GAP_S)
    if not hit:
        return "above limit, not yet long enough"
    with db().cursor() as cur:                            # one open case per source, enforced by the partial index
        cur.execute(
            "INSERT INTO excursion_cases (device_id, room, shipment_id, started_at, limit_c, hold_s, last_reading_at) "
            "VALUES (%s, %s, (SELECT shipment_id FROM shipments WHERE device_id=%s AND status='in_transit' "
            "ORDER BY start_time DESC LIMIT 1), to_timestamp(%s), %s, %s, to_timestamp(%s)) "
            "ON CONFLICT (device_id, room) WHERE ended_at IS NULL DO NOTHING RETURNING case_id, shipment_id",
            (dev, room, dev, started, LIMIT_C, HOLD_S, ts))
        new = cur.fetchone()
    shipment = new[1] if new else (open_case(dev, room) or (None, None))[1]
    st["open"] = True
    if new or now - st["last_post"] >= REFRESH_S:        # new case, or keep the alert alive
        late = now - ts > LATE_S
        labels = alert_labels(dev, room, shipment)
        if late:
            labels["late"] = "true"
        post_alert(labels, {"summary": f"{dev} {room} above {LIMIT_C:.1f} C for {HOLD_S // 60} min (now {temp:.1f} C)",
                            "description": f"Run started {iso(started)}; reading at {iso(ts)}; shipment {shipment or 'none'}."},
                   started)
        st["last_post"] = now
    return "excursion new" if new else "excursion open"


class Handler(BaseHTTPRequestHandler):
    def _send(self, code, text):
        body = text.encode()
        self.send_response(code); self.send_header("content-length", str(len(body))); self.end_headers(); self.wfile.write(body)

    def do_GET(self):
        self._send(200, "ok")

    def do_POST(self):
        raw = self.rfile.read(int(self.headers.get("content-length", 0)))
        try:
            d = json.loads(raw)
            if isinstance(d, dict) and "specversion" in d and "data" in d:
                d = d["data"]                              # structured-mode CloudEvent
            msg = handle_reading(d)
        except (ValueError, KeyError, TypeError) as e:     # a bad message must not be retried for ever
            msg = f"ignored: {type(e).__name__}: {e}"
        except Exception as e:                             # a failed dependency should be retried by the source
            print(f"error: {type(e).__name__}: {e}", flush=True)
            return self._send(500, str(e))
        print(msg, flush=True)
        self._send(200, msg)

    def log_message(self, *a):
        pass


if __name__ == "__main__":
    ThreadingHTTPServer(("0.0.0.0", int(os.environ.get("PORT", "8080"))), Handler).serve_forever()
The geofence program:
# handlers/geofence/app.py
#!/usr/bin/env python3
"""ROLE=gateway: public HTTPS front for EventBridge. Checks the API key, forwards the CloudEvent to the Kafka Broker, answers fast.
ROLE=handler: Trigger target. Records the geofence event once (the CloudEvent id is the key).
ROLE=dlq: logs events the Trigger could not deliver."""
import hmac, json, os, sys, urllib.request
from http.server import BaseHTTPRequestHandler, ThreadingHTTPServer
sys.path.insert(0, os.path.dirname(os.path.dirname(os.path.abspath(__file__))))

ROLE = os.environ.get("ROLE", "handler")
API_KEY = os.environ.get("API_KEY", "")
BROKER_URL = os.environ.get("BROKER_URL", "http://kafka-broker-ingress.knative-eventing.svc.cluster.local/react/default")


def record(event):
    from common import db
    d = event["data"]
    with db().cursor() as cur:
        cur.execute("INSERT INTO geofence_events (event_id, event_type, geofence_id, device_id, sample_time, position) "
                    "VALUES (%s,%s,%s,%s,%s,%s) ON CONFLICT (event_id) DO NOTHING",
                    (event["id"], d["eventType"], d["geofenceId"], d["deviceId"], d["sampleTime"], json.dumps(d.get("position"))))
        inserted = cur.rowcount == 1
        if inserted and d["eventType"] == "ENTER" and d["geofenceId"].startswith("customer-"):
            cur.execute("UPDATE shipments SET status='delivered', end_time=%s "           # arrival ends the shipment
                        "WHERE device_id=%s AND status='in_transit' AND end_time IS NULL", (d["sampleTime"], d["deviceId"]))
    return "recorded" if inserted else "duplicate"


class Handler(BaseHTTPRequestHandler):
    def _send(self, code, text):
        body = text.encode()
        self.send_response(code); self.send_header("content-length", str(len(body))); self.end_headers(); self.wfile.write(body)

    def do_GET(self):
        self._send(200, "ok")

    def do_POST(self):
        raw = self.rfile.read(int(self.headers.get("content-length", 0)))
        if ROLE == "gateway":
            if not hmac.compare_digest(self.headers.get("x-api-key", ""), API_KEY) or not API_KEY:
                return self._send(401, "unauthorized")
            req = urllib.request.Request(BROKER_URL, data=raw, method="POST",
                                         headers={"content-type": "application/cloudevents+json"})
            try:
                urllib.request.urlopen(req, timeout=3).read()
            except Exception as e:
                print(f"broker error: {e}", flush=True)
                return self._send(502, "broker unavailable")        # EventBridge retries
            return self._send(202, "accepted")
        try:
            if self.headers.get("content-type", "").startswith("application/cloudevents+json"):
                event = json.loads(raw)
            else:                                                   # binary mode: attributes are in ce-* headers
                event = {"id": self.headers["ce-id"], "data": json.loads(raw)}
            if ROLE == "dlq":
                print("DEAD LETTER", json.dumps(event), flush=True)
                return self._send(200, "logged")
            msg = record(event)
        except (ValueError, KeyError, TypeError) as e:
            msg = f"ignored: {type(e).__name__}: {e}"
        except Exception as e:
            print(f"error: {type(e).__name__}: {e}", flush=True)
            return self._send(500, str(e))
        print(msg, flush=True)
        self._send(200, msg)

    def log_message(self, *a):
        pass


if __name__ == "__main__":
    ThreadingHTTPServer(("0.0.0.0", int(os.environ.get("PORT", "8080"))), Handler).serve_forever()
One Dockerfile builds either, chosen by APP:
# handlers/Dockerfile
FROM python:3.12-slim
ARG APP
RUN pip install --no-cache-dir "psycopg[binary]>=3.2,<4"
WORKDIR /app
COPY common.py /app/common.py
COPY ${APP}/ /app/${APP}/
ENV APP=${APP} PYTHONUNBUFFERED=1
USER 10001
CMD ["sh", "-c", "exec python /app/${APP}/app.py"]
Before building, run the offline tests. They check the rule at its edges (exactly 300 seconds fires, 290 does not, a dip below the limit restarts the run, a long gap breaks it) and the mean kinetic temperature function:
# handlers/test_logic.py
"""Offline checks for the detection rule and mean kinetic temperature. Run: python3 handlers/test_logic.py"""
import math, os, sys, types
sys.path.insert(0, os.path.dirname(os.path.abspath(__file__)))
sys.path.insert(0, os.path.join(os.path.dirname(os.path.abspath(__file__)), "excursion"))
sys.modules.setdefault("psycopg", types.ModuleType("psycopg"))
from app import evaluate
from mkt import mkt_c, minutes_above

def run(temps, step=10):
    pts = [(1000 + i * step, t) for i, t in enumerate(temps)]
    return evaluate(pts, 8.0, 300, 60)

# 31 readings above the limit at 10 s: the run is exactly 300 s
assert run([9.0] * 31)[0] is True
assert run([9.0] * 30)[0] is False                       # 290 s
assert run([9.0] * 15 + [7.9] + [9.0] * 20)[0] is False  # a dip below the limit restarts the run
assert run([5.0] * 10 + [9.0] * 31) == (True, 1100)      # run starts at the first reading above the limit
assert evaluate([(0, 9.0), (200, 9.0), (301, 9.0)], 8.0, 300, 60)[0] is False   # a 200 s gap breaks the run
assert run([8.0] * 40)[0] is False                       # equal to the limit is not above it
assert run([9.0] * 30 + [7.0])[0] is False               # the current reading is back in range
print("evaluate: 7 checks passed")

assert abs(mkt_c([5.0] * 10) - 5.0) < 1e-9
m = mkt_c([4.0, 6.0]); assert 5.0 < m < 5.1, m
print("mkt_c([5]*10) =", round(mkt_c([5.0]*10), 4), " mkt_c([4,6]) =", round(m, 4), " mean = 5.0")
print("mkt_c([2,8]) =", round(mkt_c([2.0, 8.0]), 4), " mkt_c([2]*9+[30]) =", round(mkt_c([2.0]*9+[30.0]), 3), " mean =", round((18+30)/10, 2))
print("minutes_above:", minutes_above([(0, 9.0), (60, 9.0), (120, 5.0), (180, 5.0)], 8.0), "(expected 2.0)")
python3 handlers/test_logic.pyExpected:
evaluate: 7 checks passed
mkt_c([5]*10) = 5.0  mkt_c([4,6]) = 5.0609  mean = 5.0
mkt_c([2,8]) = 5.5364  mkt_c([2]*9+[30]) = 12.427  mean = 4.8
minutes_above: 2.0 (expected 2.0)
Then build and push both images and note the digests:
# scripts/build-handlers.sh
#!/usr/bin/env bash
# usage: scripts/build-handlers.sh <tag>   builds both images, pushes them to ECR, prints the digests
set -euo pipefail
TAG=${1:?tag}; REGION=${AWS_REGION:-ap-south-1}
ACCOUNT=$(aws sts get-caller-identity --query Account --output text)
ECR=$ACCOUNT.dkr.ecr.$REGION.amazonaws.com
aws ecr get-login-password --region "$REGION" | docker login --username AWS --password-stdin "$ECR"
for pair in excursion:excursion-handler geofence:geofence-handler; do
  APP=${pair%%:*}; REPO=coldchain/${pair##*:}
  docker build --platform linux/amd64 --build-arg APP="$APP" -t "$ECR/$REPO:$TAG" handlers/
  docker push "$ECR/$REPO:$TAG"
  DIGEST=$(aws ecr describe-images --repository-name "$REPO" --image-ids imageTag="$TAG" \
           --query 'imageDetails[0].imageDigest' --output text)
  echo "$ECR/$REPO@$DIGEST"
done
chmod +x scripts/build-handlers.sh
scripts/build-handlers.sh 1 | tee /tmp/digests.txt
export ECR_EXCURSION=$(grep excursion-handler /tmp/digests.txt)
export ECR_GEOFENCE=$(grep geofence-handler /tmp/digests.txt)
echo "$ECR_EXCURSION"; echo "$ECR_GEOFENCE"Expected: two lines like 123456789012.dkr.ecr.ap-south-1.amazonaws.com/coldchain/excursion-handler@sha256:.... The manifests below refer to the image by digest. Knative normally resolves a tag to a digest by asking the registry, and a private ECR needs credentials for that; a digest needs no lookup. The nodes pull from ECR with their instance role, which the EKS module gives read access to ECR; confirm with aws iam list-attached-role-policies on the node role if a pull fails.
5.3 Credentials for the Kafka source and the Broker
The KafkaSource reads telemetry.raw with its own consumer group, and the Broker creates its own topic. Both authenticate with the SCRAM user from Part 1. The two components read their credentials in different formats, so there are two Secrets:
KUSER=$(kubectl --context hub -n ingest get secret msk-scram -o jsonpath='{.data.username}' | base64 -d)
KPASS=$(kubectl --context hub -n ingest get secret msk-scram -o jsonpath='{.data.password}' | base64 -d)
kubectl --context hub -n react create secret generic msk-kn \
  --from-literal=user="$KUSER" --from-literal=password="$KPASS" --from-literal=saslType=SCRAM-SHA-512
kubectl --context hub -n knative-eventing create secret generic msk-broker-auth \
  --from-literal=protocol=SASL_SSL --from-literal=sasl.mechanism=SCRAM-SHA-512 \
  --from-literal=user="$KUSER" --from-literal=password="$KPASS"
kubectl --context hub -n knative-eventing create configmap kafka-broker-config \
  --from-literal=bootstrap.servers="$BOOT" \
  --from-literal=default.topic.partitions=6 --from-literal=default.topic.replication.factor=3 \
  --from-literal=auth.secret.ref.name=msk-broker-auth
unset KUSER KPASS
The MSK cluster from Part 1 uses the default ACL behaviour (everyone may act when no ACL exists), so the user can create the Broker’s topic. If you add ACLs later, this user needs rights on telemetry.raw, the Broker topic and the consumer groups.
5.4 Deploy the excursion handler and the Kafka source
The handler runs as a Knative Service with a minimum scale of one. Scale to zero would be valid for a bursty function, but a cold start (schedule a pod, start it, open a database connection) could use the whole 60-second budget, so this one stays warm and scales up to six pods under load.
# platform/knative/handlers.yaml
apiVersion: serving.knative.dev/v1
kind: Service
metadata: { name: excursion-handler, namespace: react }
spec:
  template:
    metadata:
      annotations:
        autoscaling.knative.dev/min-scale: "1"       # a cold start would cost more than the alert budget
        autoscaling.knative.dev/max-scale: "6"
    spec:
      containerConcurrency: 16
      containers:
        - image: ECR_EXCURSION                       # repository@sha256:digest from the build script
          env:
            - { name: LIMIT_C, value: "8.0" }
            - { name: HOLD_S, value: "300" }
            - { name: PGHOST, valueFrom: { secretKeyRef: { name: pg-app, key: host } } }
            - { name: PGDATABASE, value: coldchain }
            - { name: PGUSER, value: coldchain_app }
            - { name: PGPASSWORD, valueFrom: { secretKeyRef: { name: pg-app, key: password } } }
            - { name: PGSSLMODE, value: require }
          resources: { requests: { cpu: 100m, memory: 128Mi }, limits: { memory: 256Mi } }
---
apiVersion: serving.knative.dev/v1
kind: Service
metadata: { name: event-gateway, namespace: react }
spec:
  template:
    metadata:
      annotations: { autoscaling.knative.dev/min-scale: "1" }    # EventBridge waits 5 s, so no cold start here
    spec:
      containers:
        - image: ECR_GEOFENCE
          env:
            - { name: ROLE, value: gateway }
            - { name: API_KEY, valueFrom: { secretKeyRef: { name: events-api-key, key: key } } }
          resources: { requests: { cpu: 50m, memory: 64Mi }, limits: { memory: 128Mi } }
---
apiVersion: serving.knative.dev/v1
kind: Service
metadata: { name: geofence-handler, namespace: react }
spec:
  template:
    spec:
      containers:
        - image: ECR_GEOFENCE
          env:
            - { name: ROLE, value: handler }
            - { name: PGHOST, valueFrom: { secretKeyRef: { name: pg-app, key: host } } }
            - { name: PGDATABASE, value: coldchain }
            - { name: PGUSER, value: coldchain_app }
            - { name: PGPASSWORD, valueFrom: { secretKeyRef: { name: pg-app, key: password } } }
            - { name: PGSSLMODE, value: require }
          resources: { requests: { cpu: 50m, memory: 64Mi }, limits: { memory: 128Mi } }
---
apiVersion: serving.knative.dev/v1
kind: Service
metadata: { name: dead-letter, namespace: react }
spec:
  template:
    spec:
      containers:
        - image: ECR_GEOFENCE
          env: [{ name: ROLE, value: dlq }]
Apply the Service (and the other three in the file, which section 7 uses) with the image digests filled in:
sed -e "0,/ECR_EXCURSION/s##$ECR_EXCURSION#" -e "s#ECR_GEOFENCE#$ECR_GEOFENCE#g" -e "s#ECR_EXCURSION#$ECR_EXCURSION#g" \
  platform/knative/handlers.yaml | kubectl --context hub apply -f -
kubectl --context hub -n react get ksvc
Expected: the four services listed and READY True for excursion-handler first (the others may wait on the Broker). The sed replaces the placeholders: the first expression is harmless and the others substitute the two digests.
The KafkaSource turns each Kafka message into a CloudEvent and posts it to the handler, one at a time per partition, so order is kept. The handler returns a 2xx for anything it decides to ignore (a malformed message must not be retried for ever) and a 5xx only when a dependency failed, which makes the source retry with backoff.
# platform/knative/kafka-source.yaml
apiVersion: v1
kind: Namespace
metadata: { name: react }
---
apiVersion: sources.knative.dev/v1
kind: KafkaSource
metadata: { name: telemetry-to-excursion, namespace: react }
spec:
  consumerGroup: knative-excursion
  bootstrapServers: ["placeholder:9096"]    # replaced by the patch command in section 5.3
  topics: [telemetry.raw]
  initialOffset: latest
  consumers: 3
  net:
    sasl:
      enable: true
      user: { secretKeyRef: { name: msk-kn, key: user } }
      password: { secretKeyRef: { name: msk-kn, key: password } }
      type: { secretKeyRef: { name: msk-kn, key: saslType } }
    tls:
      enable: true
  sink:
    ref: { apiVersion: serving.knative.dev/v1, kind: Service, name: excursion-handler }
  delivery:
    retry: 5
    backoffPolicy: exponential
    backoffDelay: PT1S
kubectl --context hub apply -f platform/knative/kafka-source.yaml
kubectl --context hub -n react patch kafkasource telemetry-to-excursion --type merge \
-p "{\"spec\":{\"bootstrapServers\":$(echo "$BOOT" | jq -R 'split(",")')}}"
kubectl --context hub -n react get kafkasource
kubectl --context hub -n react logs -l serving.knative.dev/service=excursion-handler -c user-container --tail=5Expected: the source READY True and handler log lines such as ok (readings at or below the limit). The initialOffset: latest applies only when the consumer group has no committed offsets; afterwards the group resumes where it stopped, which is what makes the backlog after an outage arrive in order. The group name knative-excursion is separate from Vector’s vector-normaliser, so each reads the whole topic.
5.5 The first case
Force an excursion on a throwaway source with a scripted publish through IoT Core (this uses your AWS identity, not a device certificate). Thirty-one readings, 10 seconds apart, all at 9.0 °C, make a 300-second run. Write them straight into openGemini too, so the handler’s query has something to read even if Vector is slow, then publish the last reading through the real path:
for i in $(seq 0 30); do
  T=$(date -u -d "-$((300 - i*10)) seconds" +%Y-%m-%dT%H:%M:%S.000Z)
  aws iot-data publish --topic fleet/reefer-004/telemetry --cli-binary-format raw-in-base64-out \
    --payload "{\"device_id\":\"reefer-004\",\"seq\":$((i+1)),\"ts\":\"$T\",\"temp_c\":9.0}"
done
sleep 5
kubectl --context hub -n react logs -l serving.knative.dev/service=excursion-handler -c user-container --tail=5
The readings carry past timestamps (the last is “now”), so the run in openGemini is 300 seconds long when the last one lands. Expected: a log line excursion new once the 31st reading arrives, marked late if your clock-to-publish gap exceeds two minutes. Read the case back with a one-off psql:
kubectl --context hub -n react run psql --rm -i --restart=Never --image=postgres:17-alpine \
  --env=PGHOST="$PG_HOST" --env=PGDATABASE=coldchain --env=PGUSER=coldchain_app --env=PGSSLMODE=require \
  --env=PGPASSWORD="$(kubectl --context hub -n react get secret pg-app -o jsonpath='{.data.password}' | base64 -d)" \
  --command -- psql -c "SELECT case_id, device_id, shipment_id, started_at, ended_at, limit_c FROM excursion_cases"
Expected: one open case for reefer-004 linked to SHP-1004. Send a reading at 5.0 °C afterwards and the case closes with ended_at and max_temp_c filled in. Publishing the same last reading twice leaves one case: the partial unique index and ON CONFLICT DO NOTHING see to that.
Checkpoint 5. Knative pods are Running, the KafkaSource is ready, the handler logs readings, and the scripted run opens exactly one case in RDS.
6. Alerting: Alertmanager, rules, Grafana and Perses
One chart installs Prometheus, Alertmanager and Grafana (the stack from Sprint 2, reused). The values do four things. They route alerts labelled source="coldchain" straight away (group_wait: 0s, because the default 30 seconds would use half of the 60-second budget), they also send each of them to a test receiver so the delay can be measured, they route platform alerts to the same on-call receiver, and they add openGemini to Grafana as an InfluxDB data source (openGemini answers InfluxQL).
# platform/monitoring/values.yaml
alertmanager:
  alertmanagerSpec:
    secrets: [alertmanager-secrets]
  config:
    global:
      resolve_timeout: 5m
      smtp_smarthost: smtp.example.com:587
      smtp_from: coldchain-alerts@example.com
      smtp_auth_username: coldchain-alerts@example.com
      smtp_auth_password_file: /etc/alertmanager/secrets/alertmanager-secrets/smtp-password
    route:
      receiver: "null"
      group_by: [alertname, device, room]
      group_wait: 30s
      group_interval: 5m
      repeat_interval: 4h
      routes:
        # Every cold-chain alert also goes to the test sink, then continues to the real receiver.
        - matchers: ['source="coldchain"']
          receiver: alert-sink
          continue: true
          group_wait: 0s
          group_interval: 1m
        - matchers: ['source="coldchain"', 'severity="critical"']
          receiver: oncall
          group_wait: 0s              # the 60 s budget has no room for the default 30 s
          group_interval: 1m
          repeat_interval: 1h
        - matchers: ['source="platform"']
          receiver: oncall
    receivers:
      - name: "null"
      - name: alert-sink
        webhook_configs:
          - url: http://alert-sink.monitoring.svc:8080/alert
            send_resolved: true
      - name: oncall
        msteamsv2_configs:
          - webhook_url_file: /etc/alertmanager/secrets/alertmanager-secrets/teams-webhook
            send_resolved: true
            title: '{{ .Status | toUpper }}: {{ .CommonLabels.alertname }} {{ .CommonLabels.device }}'
            text: '{{ range .Alerts }}{{ .Annotations.summary }}{{ "\n" }}{{ end }}'
        email_configs:
          - to: quality@example.com
            send_resolved: true
            headers:
              Subject: '[{{ .Status | toUpper }}] {{ .CommonLabels.alertname }} {{ .CommonLabels.device }}'
grafana:
  admin: { existingSecret: grafana-admin, userKey: admin-user, passwordKey: admin-password }
  additionalDataSources:
    - name: openGemini
      type: influxdb
      access: proxy
      url: http://opengemini.data.svc.cluster.local:8086
      jsonData: { dbName: telemetry, httpMode: GET }
  sidecar: { dashboards: { enabled: true, label: grafana_dashboard } }
prometheus:
  prometheusSpec:
    serviceMonitorSelectorNilUsesHelmValues: false
    ruleSelectorNilUsesHelmValues: false
Secrets stay out of the values file: the Teams webhook and the SMTP password are mounted as files. Create them (use real values), then install:
kubectl --context hub create namespace monitoring
kubectl --context hub -n monitoring create secret generic grafana-admin \
  --from-literal=admin-user=admin --from-literal=admin-password="$(openssl rand -base64 18)"
kubectl --context hub -n monitoring create secret generic alertmanager-secrets \
  --from-literal=teams-webhook='https://prod-00.example.logic.azure.com/workflows/REPLACE_ME' \
  --from-literal=smtp-password='REPLACE_ME'
helm repo add prometheus-community https://prometheus-community.github.io/helm-charts && helm repo update
helm upgrade --install monitoring prometheus-community/kube-prometheus-stack \
  -n monitoring -f platform/monitoring/values.yaml --kube-context hub
kubectl --context hub -n monitoring rollout status statefulset/alertmanager-monitoring-kube-prometheus-alertmanager
kubectl --context hub -n monitoring exec alertmanager-monitoring-kube-prometheus-alertmanager-0 -c alertmanager -- \
  amtool check-config /etc/alertmanager/config_out/alertmanager.env.yaml
Expected: SUCCESS from amtool, with the receivers listed. Teams: msteamsv2_configs posts to a Workflows webhook; the older connector style is retired. A phone page is a receiver in the same list (an on-call service’s webhook, or SMS through your provider); this build stops at Teams and email.
The handler posts to Alertmanager’s API with a startsAt time, and Alertmanager treats an alert that is not refreshed as resolved after resolve_timeout (5 minutes here). That is why the handler posts again about once a minute while a case is open, and posts a resolve with endsAt when it closes the case. Deploy the test receiver and the platform rules:
# platform/monitoring/alert-sink.yaml
apiVersion: v1
kind: ConfigMap
metadata: { name: alert-sink, namespace: monitoring }
data:
  alert_sink.py: |
    #!/usr/bin/env python3
    """Test receiver for Alertmanager's webhook. Records when each alert arrived, by this pod's clock."""
    import json, threading, time
    from http.server import BaseHTTPRequestHandler, ThreadingHTTPServer

    SEEN, LOCK = [], threading.Lock()

    class H(BaseHTTPRequestHandler):
        def _json(self, obj):
            b = json.dumps(obj).encode()
            self.send_response(200); self.send_header("content-type", "application/json")
            self.send_header("content-length", str(len(b))); self.end_headers(); self.wfile.write(b)
        def do_POST(self):
            body = json.loads(self.rfile.read(int(self.headers.get("content-length", 0))) or b"{}")
            with LOCK:
                for a in body.get("alerts", []):
                    SEEN.append({"recv": time.time(), "status": a.get("status"), "labels": a.get("labels", {}),
                                 "startsAt": a.get("startsAt")})
            self._json({"ok": True})
        def do_GET(self):
            if self.path.startswith("/time"):
                return self._json({"now": time.time()})
            with LOCK:
                self._json(SEEN)
        def log_message(self, *a): pass

    ThreadingHTTPServer(("0.0.0.0", 8080), H).serve_forever()
---
apiVersion: apps/v1
kind: Deployment
metadata: { name: alert-sink, namespace: monitoring }
spec:
  replicas: 1
  selector: { matchLabels: { app: alert-sink } }
  template:
    metadata: { labels: { app: alert-sink } }
    spec:
      containers:
        - name: sink
          image: python:3.12-slim
          command: ["python", "/app/alert_sink.py"]
          ports: [{ containerPort: 8080 }]
          volumeMounts: [{ name: app, mountPath: /app }]
      volumes: [{ name: app, configMap: { name: alert-sink } }]
---
apiVersion: v1
kind: Service
metadata: { name: alert-sink, namespace: monitoring }
spec:
  selector: { app: alert-sink }
  ports: [{ port: 8080, targetPort: 8080 }]
# platform/monitoring/rules.yaml
apiVersion: monitoring.coreos.com/v1
kind: PrometheusRule
metadata: { name: coldchain-platform, namespace: monitoring }
spec:
groups:
- name: coldchain-platform
rules:
- alert: ExcursionHandlerDown
expr: sum(kube_deployment_status_replicas_available{namespace="react", deployment=~"excursion-handler.*"}) < 1
for: 2m
labels: { severity: critical, source: platform }
annotations: { summary: "No excursion handler pod is available; temperature alerts are not being raised." }
- alert: VectorDown
expr: kube_deployment_status_replicas_available{namespace="ingest", deployment="vector"} < 1
for: 2m
labels: { severity: critical, source: platform }
annotations: { summary: "Vector has no available pod; readings are not reaching openGemini (Kafka keeps them)." }
- alert: OpenGeminiNotReady
expr: kube_statefulset_status_replicas_ready{namespace="data", statefulset="opengemini"} < 1
for: 2m
labels: { severity: critical, source: platform }
annotations: { summary: "openGemini is not ready; writes wait in Kafka and excursion checks fail." }kubectl --context hub apply -f platform/monitoring/alert-sink.yaml -f platform/monitoring/rules.yaml
kubectl --context hub -n monitoring get pods -l app=alert-sinkThe three rules watch the pipeline itself: no excursion handler, no Vector, no openGemini. A silent failure of the pipeline is as bad as a missed alert, so these go to the same on-call receiver with source: platform.
6.1 Perses
Perses shows the platform’s own health from Prometheus. It was introduced in Sprint 4 and is reused as it is.
# platform/dashboards/perses/coldchain.yaml
kind: Project
metadata: { name: coldchain }
spec: {}
---
kind: GlobalDatasource
metadata: { name: coldchain-prometheus }
spec:
  default: true
  plugin:
    kind: PrometheusDatasource
    spec:
      directUrl: http://monitoring-kube-prometheus-prometheus.monitoring.svc:9090
---
kind: Dashboard
metadata: { name: platform-health, project: coldchain }
spec:
  display: { name: Platform health }
  duration: 6h
  refreshInterval: 30s
  panels:
    handler:
      kind: Panel
      spec:
        display: { name: Excursion handler pods available }
        plugin: { kind: TimeSeriesChart, spec: {} }
        queries:
          - kind: TimeSeriesQuery
            spec:
              plugin:
                kind: PrometheusTimeSeriesQuery
                spec: { query: 'sum(kube_deployment_status_replicas_available{namespace="react", deployment=~"excursion-handler.*"})' }
    vector:
      kind: Panel
      spec:
        display: { name: Vector pods available }
        plugin: { kind: TimeSeriesChart, spec: {} }
        queries:
          - kind: TimeSeriesQuery
            spec:
              plugin:
                kind: PrometheusTimeSeriesQuery
                spec: { query: 'kube_deployment_status_replicas_available{namespace="ingest", deployment="vector"}' }
    store:
      kind: Panel
      spec:
        display: { name: openGemini ready replicas }
        plugin: { kind: TimeSeriesChart, spec: {} }
        queries:
          - kind: TimeSeriesQuery
            spec:
              plugin:
                kind: PrometheusTimeSeriesQuery
                spec: { query: 'kube_statefulset_status_replicas_ready{namespace="data", statefulset="opengemini"}' }
    firing:
      kind: Panel
      spec:
        display: { name: Cold-chain alerts firing }
        plugin: { kind: TimeSeriesChart, spec: {} }
        queries:
          - kind: TimeSeriesQuery
            spec:
              plugin:
                kind: PrometheusTimeSeriesQuery
                spec: { query: 'sum by (alertname) (ALERTS{alertstate="firing", source=~"coldchain|platform"})', seriesNameFormat: '{{alertname}}' }
  layouts:
    - kind: Grid
      spec:
        display: { title: Pipeline }
        items:
          - { x: 0,  y: 0, width: 8, height: 7, content: { $ref: '#/spec/panels/handler' } }
          - { x: 8,  y: 0, width: 8, height: 7, content: { $ref: '#/spec/panels/vector' } }
          - { x: 16, y: 0, width: 8, height: 7, content: { $ref: '#/spec/panels/store' } }
          - { x: 0,  y: 7, width: 24, height: 7, content: { $ref: '#/spec/panels/firing' } }
helm repo add perses https://perses.github.io/helm-charts && helm repo update
helm upgrade --install perses perses/perses -n dashboards --create-namespace --kube-context hub
kubectl --context hub -n dashboards port-forward svc/perses 8080:8080 &
percli login http://localhost:8080
percli lint -f platform/dashboards/perses/coldchain.yaml
percli apply -f platform/dashboards/perses/coldchain.yamlExpected: percli lint passes and the project coldchain has a dashboard called Platform health, with four panels that draw lines. Check helm show values perses/perses for the persistence settings before you rely on it; the dashboards are in Git, so a lost volume is re-applied, not rebuilt.
6.2 Grafana
Grafana draws the temperatures themselves, from openGemini, because that is where the readings are. The dashboard has a temperature panel per source with a red line at 8 °C, and a count of stored readings per minute, which is a quick way to see a silent source.
# platform/dashboards/grafana.yaml
apiVersion: v1
kind: ConfigMap
metadata:
  name: coldchain-temperatures
  namespace: monitoring
  labels: { grafana_dashboard: "1" }
data:
  coldchain-temperatures.json: |
    {
      "title": "Cold chain temperatures",
      "uid": "coldchain-temps",
      "schemaVersion": 39,
      "time": { "from": "now-3h", "to": "now" },
      "refresh": "30s",
      "panels": [
        { "type": "timeseries", "title": "Temperature by source (limit 8 C)", "gridPos": { "x": 0, "y": 0, "w": 24, "h": 10 },
          "datasource": "openGemini",
          "fieldConfig": { "defaults": { "unit": "celsius", "thresholds": { "mode": "absolute", "steps": [
            { "color": "green", "value": null }, { "color": "red", "value": 8 } ] },
            "custom": { "thresholdsStyle": { "mode": "line" } } }, "overrides": [] },
          "targets": [ { "refId": "A", "rawQuery": true, "resultFormat": "time_series", "alias": "$tag_device_id $tag_room",
            "query": "SELECT mean(\"temp_c\") FROM \"readings\" WHERE $timeFilter GROUP BY time($__interval), \"device_id\", \"room\" fill(null)" } ] },
        { "type": "timeseries", "title": "Readings stored per minute", "gridPos": { "x": 0, "y": 10, "w": 24, "h": 7 },
          "datasource": "openGemini",
          "targets": [ { "refId": "A", "rawQuery": true, "resultFormat": "time_series", "alias": "$tag_device_id",
            "query": "SELECT count(\"temp_c\") FROM \"readings\" WHERE $timeFilter GROUP BY time(1m), \"device_id\" fill(0)" } ] }
      ]
    }
kubectl --context hub apply -f platform/dashboards/grafana.yaml
kubectl --context hub -n monitoring port-forward svc/monitoring-grafana 3000:80 &Open http://localhost:3000, sign in as admin (the password is in the grafana-admin Secret), and open Cold chain temperatures. Part 4 puts Grafana behind Dex; until then it is reachable only through the port-forward. Confirm the data source with Connections, Data sources, openGemini, Save and test.
Checkpoint 6. amtool reports a valid configuration, the Perses dashboard draws, and Grafana shows temperatures for the running simulators.
7. Geofences: Amazon Location, EventBridge and the gateway
The path has seven hops, and each one has a reason:
- An IoT rule sends the latitude and longitude of each vehicle message to an Amazon Location tracker with the
locationaction. - The tracker, linked to a geofence collection, checks each position and emits an ENTER or EXIT event to EventBridge. (A tracker with the default time-based filtering evaluates updates but stores at most one every 30 seconds per device, which is fine for vehicles.)
- An EventBridge rule matches
Location Geofence Eventand sends it to an API destination over HTTPS. The destination has a client timeout of 5 seconds, retries on timeout, and cannot do mutual TLS, so the receiving end uses an API key. - An input transformer reshapes the event into a CloudEvent, because EventBridge’s own envelope is not one.
- A Knative gateway checks the API key, hands the event to the Kafka Broker and answers at once, so the 5-second window is never at risk.
- A Trigger delivers events of type
coldchain.geofenceto the geofence handler, with retries and a dead-letter service behind it. - The handler writes the event to RDS under its CloudEvent ID. Amazon Location can deliver the same event more than once; the primary key turns a repeat into a no-op.
7.1 AWS side, with OpenTofu
# infra/foundation/location-events.tf
variable "domain" {}                       # already set in Part 1
variable "events_lb_hostname" { default = "" }   # set after the load balancer exists (section 7.2)

# --- Amazon Location: tracker, geofence collection, link --------------------------------
resource "aws_location_tracker" "fleet" {
  tracker_name = "${var.name}-fleet"
}

resource "aws_location_geofence_collection" "sites" {
  collection_name = "${var.name}-sites"
}

resource "aws_location_tracker_association" "fleet_sites" {
  tracker_name = aws_location_tracker.fleet.tracker_name
  consumer_arn = aws_location_geofence_collection.sites.collection_arn
}

# Role the IoT location action assumes.
resource "aws_iam_role" "iot_location" {
  name               = "${var.name}-iot-location"
  assume_role_policy = data.aws_iam_policy_document.iot_trust.json     # from iot-kafka.tf in Part 2
}

resource "aws_iam_role_policy" "iot_location" {
  role = aws_iam_role.iot_location.id
  policy = jsonencode({
    Version   = "2012-10-17"
    Statement = [{ Effect = "Allow", Action = "geo:BatchUpdateDevicePosition", Resource = aws_location_tracker.fleet.tracker_arn }]
  })
}

output "location_rule_role_arn" { value = aws_iam_role.iot_location.arn }
output "tracker_name"           { value = aws_location_tracker.fleet.tracker_name }
output "collection_name"        { value = aws_location_geofence_collection.sites.collection_name }

# --- Public name and certificate for the event gateway ---------------------------------
resource "aws_acm_certificate" "events" {
  domain_name       = "events.${var.domain}"
  validation_method = "DNS"
}

resource "aws_route53_record" "events_validation" {
  for_each = { for o in aws_acm_certificate.events.domain_validation_options : o.domain_name => o }
  zone_id  = aws_route53_zone.main.zone_id
  name     = each.value.resource_record_name
  type     = each.value.resource_record_type
  records  = [each.value.resource_record_value]
  ttl      = 60
}

resource "aws_acm_certificate_validation" "events" {
  certificate_arn         = aws_acm_certificate.events.arn
  validation_record_fqdns = [for r in aws_route53_record.events_validation : r.fqdn]
}

resource "aws_route53_record" "events" {
  count   = var.events_lb_hostname == "" ? 0 : 1
  zone_id = aws_route53_zone.main.zone_id
  name    = "events.${var.domain}"
  type    = "CNAME"
  ttl     = 60
  records = [var.events_lb_hostname]
}

output "events_cert_arn" { value = aws_acm_certificate_validation.events.certificate_arn }

# --- EventBridge: geofence events to the gateway through an API destination -----------
resource "random_password" "events_api_key" {
  length  = 40
  special = false
}

output "events_api_key" {
  value     = random_password.events_api_key.result
  sensitive = true
}

resource "aws_cloudwatch_event_connection" "gateway" {
  name               = "${var.name}-event-gateway"
  authorization_type = "API_KEY"
  auth_parameters {
    api_key {
      key   = "X-Api-Key"
      value = random_password.events_api_key.result
    }
  }
}

resource "aws_cloudwatch_event_api_destination" "gateway" {
  name                             = "${var.name}-event-gateway"
  connection_arn                   = aws_cloudwatch_event_connection.gateway.arn
  invocation_endpoint              = "https://events.${var.domain}/events"
  http_method                      = "POST"
  invocation_rate_limit_per_second = 20
}

data "aws_iam_policy_document" "events_trust" {
  statement {
    actions = ["sts:AssumeRole"]
    principals {
      type        = "Service"
      identifiers = ["events.amazonaws.com"]
    }
  }
}

resource "aws_iam_role" "events_invoke" {
  name               = "${var.name}-events-invoke"
  assume_role_policy = data.aws_iam_policy_document.events_trust.json
}

resource "aws_iam_role_policy" "events_invoke" {
  role = aws_iam_role.events_invoke.id
  policy = jsonencode({
    Version   = "2012-10-17"
    Statement = [{ Effect = "Allow", Action = "events:InvokeApiDestination", Resource = aws_cloudwatch_event_api_destination.gateway.arn }]
  })
}

resource "aws_sqs_queue" "events_dlq" {
  name                      = "${var.name}-events-dlq"
  sqs_managed_sse_enabled   = true
  message_retention_seconds = 1209600
}

data "aws_iam_policy_document" "events_dlq" {
  statement {
    actions   = ["sqs:SendMessage"]
    resources = [aws_sqs_queue.events_dlq.arn]
    principals {
      type        = "Service"
      identifiers = ["events.amazonaws.com"]
    }
    condition {
      test     = "ArnEquals"
      variable = "aws:SourceArn"
      values   = [aws_cloudwatch_event_rule.geofence.arn]
    }
  }
}

resource "aws_sqs_queue_policy" "events_dlq" {
  queue_url = aws_sqs_queue.events_dlq.id
  policy    = data.aws_iam_policy_document.events_dlq.json
}

resource "aws_cloudwatch_event_rule" "geofence" {
  name = "${var.name}-geofence-events"
  event_pattern = jsonencode({
    source        = ["aws.geo"]
    "detail-type" = ["Location Geofence Event"]
  })
}

resource "aws_cloudwatch_event_target" "geofence" {
  rule     = aws_cloudwatch_event_rule.geofence.name
  arn      = aws_cloudwatch_event_api_destination.gateway.arn
  role_arn = aws_iam_role.events_invoke.arn

  input_transformer {
    input_paths = {
      id   = "$.id"
      time = "$.time"
      et   = "$.detail.EventType"
      gid  = "$.detail.GeofenceId"
      dev  = "$.detail.DeviceId"
      st   = "$.detail.SampleTime"
      pos  = "$.detail.Position"
    }
    # A CloudEvent in structured mode. Strings are quoted here; the position array is inserted as it is.
    input_template = <<-EOT
      {"specversion":"1.0","id":"<id>","source":"aws.geo","type":"coldchain.geofence","time":"<time>","datacontenttype":"application/json","data":{"eventType":"<et>","geofenceId":"<gid>","deviceId":"<dev>","sampleTime":"<st>","position":<pos>}}
    EOT
  }

  retry_policy {
    maximum_retry_attempts       = 5
    maximum_event_age_in_seconds = 3600
  }
  dead_letter_config { arn = aws_sqs_queue.events_dlq.arn }
}(cd infra/foundation && tofu apply)
export ACM_ARN=$(cd infra/foundation && tofu output -raw events_cert_arn)
export TRACKER=$(cd infra/foundation && tofu output -raw tracker_name)
export COLLECTION=$(cd infra/foundation && tofu output -raw collection_name)
export LOC_ROLE=$(cd infra/foundation && tofu output -raw location_rule_role_arn)The certificate waits for its DNS validation record, which OpenTofu creates in the Part 1 zone, so the apply can take a few minutes. Expected: the outputs print, and aws location describe-tracker --tracker-name $TRACKER shows the tracker.
7.2 Geofences and the IoT location rule
Geofences are polygons, one for a depot and one for a customer, each about 280 metres square. Coordinates are longitude then latitude, the ring is closed, and the exterior ring runs counter-clockwise. The depot name starts with depot- and the customer’s with customer-: the handler marks a shipment delivered when its vehicle enters a customer- geofence.
aws location put-geofence --collection-name $COLLECTION --geofence-id depot-navi-mumbai \
  --geometry 'Polygon=[[[73.0270,19.0305],[73.0325,19.0305],[73.0325,19.0355],[73.0270,19.0355],[73.0270,19.0305]]]'
aws location put-geofence --collection-name $COLLECTION --geofence-id customer-pune \
  --geometry 'Polygon=[[[73.8530,18.5180],[73.8585,18.5180],[73.8585,18.5230],[73.8530,18.5230],[73.8530,18.5180]]]'
aws location list-geofences --collection-name $COLLECTION --query 'Entries[].GeofenceId'
Expected: the two names. The location rule is created from a JSON file, because the substitution templates in the tracker name and device fields are supported through the API and CLI. The SQL passes on only messages that carry a position, so depot sensors (which have none) do not produce errors:
{
  "sql": "SELECT topic(2) AS device_id, lat, lon FROM 'fleet/+/telemetry' WHERE isUndefined(lat) = false",
  "awsIotSqlVersion": "2016-03-23",
  "ruleDisabled": false,
  "actions": [
    { "location": {
        "roleArn": "ROLE_ARN",
        "trackerName": "TRACKER",
        "deviceId": "${device_id}",
        "latitude": "${lat}",
        "longitude": "${lon}",
        "timestamp": { "value": "${timestamp()}", "unit": "MILLISECONDS" } } }
  ]
}
sed -e "s#ROLE_ARN#$LOC_ROLE#" -e "s#TRACKER#$TRACKER#" ops/location-rule.json > /tmp/location-rule.json
aws iot create-topic-rule --rule-name coldchain_position_to_location --topic-rule-payload file:///tmp/location-rule.json
aws iot get-topic-rule --rule-name coldchain_position_to_location --query 'rule.actions'The action stamps each position with the time IoT Core received it. That is right while a vehicle is online; after an outage, the backlog arrives in a burst and the positions carry the arrival time, not the drive time. Order is kept (the spool drains oldest first), so ENTER and EXIT still come in the right sequence, but their times are late. To use the device’s own time, compute it in the rule’s SQL from the ts field (the time_to_epoch function) and confirm the pattern on your side.
7.3 The public name and the gateway
The gateway must be reachable by EventBridge, which has no fixed addresses, so it sits behind a Network Load Balancer that terminates TLS with the ACM certificate. The default Kourier load balancer is already internal-only; this extra Service creates a public one that forwards port 443, as plain TCP, to Kourier’s port 8080, and a DomainMapping ties the name events.<domain> to the gateway Service.
# platform/knative/public.yaml
apiVersion: v1
kind: Service
metadata:
  name: kourier-public
  namespace: kourier-system
  annotations:
    service.beta.kubernetes.io/aws-load-balancer-type: nlb
    service.beta.kubernetes.io/aws-load-balancer-ssl-cert: ACM_CERT_ARN
    service.beta.kubernetes.io/aws-load-balancer-ssl-ports: "443"
    service.beta.kubernetes.io/aws-load-balancer-backend-protocol: tcp
spec:
  type: LoadBalancer
  selector: { app: 3scale-kourier-gateway }          # confirm with: kubectl -n kourier-system get pods --show-labels
  ports: [{ name: https, port: 443, targetPort: 8080 }]
---
apiVersion: networking.internal.knative.dev/v1alpha1
kind: ClusterDomainClaim
metadata: { name: events.DOMAIN }
spec: { namespace: react }
---
apiVersion: serving.knative.dev/v1beta1
kind: DomainMapping
metadata: { name: events.DOMAIN, namespace: react }
spec:
  ref: { apiVersion: serving.knative.dev/v1, kind: Service, name: event-gateway }
kubectl --context hub -n kourier-system get pods --show-labels | head -3 # confirm app=3scale-kourier-gateway
sed -e "s#ACM_CERT_ARN#$ACM_ARN#" -e "s#DOMAIN#$DOMAIN#g" platform/knative/public.yaml | kubectl --context hub apply -f -
kubectl --context hub -n kourier-system get svc kourier-public -wWait for the EXTERNAL-IP (a host name). Then the API key (from OpenTofu) goes into a Secret, the DNS record is created by a second apply, and the Broker, Trigger and handlers come up:
export LB=$(kubectl --context hub -n kourier-system get svc kourier-public -o jsonpath='{.status.loadBalancer.ingress[0].hostname}')
kubectl --context hub -n react create secret generic events-api-key \
  --from-literal=key="$(cd infra/foundation && tofu output -raw events_api_key)"
(cd infra/foundation && tofu apply -var "events_lb_hostname=$LB")
kubectl --context hub apply -f platform/knative/broker.yaml
kubectl --context hub -n react get broker,trigger,ksvc,domainmapping
Expected: the Broker READY True, the Trigger ready, and the DomainMapping ready. Check the front door from your workstation. A request without the key must be refused; one with it must be accepted:
curl -s -o /dev/null -w "%{http_code}\n" -X POST https://events.$DOMAIN/events -d '{}'
curl -s -o /dev/null -w "%{http_code}\n" -X POST https://events.$DOMAIN/events \
  -H "X-Api-Key: $(cd infra/foundation && tofu output -raw events_api_key)" -H 'content-type: application/json' \
  -d '{"specversion":"1.0","id":"test-1","source":"manual","type":"coldchain.geofence","datacontenttype":"application/json","data":{"eventType":"EXIT","geofenceId":"depot-navi-mumbai","deviceId":"reefer-004","sampleTime":"2026-11-20T00:00:00Z","position":[73.0297,19.033]}}'
Expected: 401, then 202. Send the second request twice and the geofence table still has one row for test-1.
7.4 An ENTER event, end to end
Publish a reading for the test truck with a position inside the depot geofence. The IoT rule from Part 2 stores it, the location rule updates the tracker, and the tracker’s check sends the event:
aws iot-data publish --topic fleet/reefer-004/telemetry --cli-binary-format raw-in-base64-out \
  --payload "{\"device_id\":\"reefer-004\",\"seq\":1000,\"ts\":\"$(date -u +%Y-%m-%dT%H:%M:%S.000Z)\",\"temp_c\":5.1,\"lat\":19.0330,\"lon\":73.0297}"
sleep 20
aws location get-device-position --tracker-name $TRACKER --device-id reefer-004
kubectl --context hub -n react logs -l serving.knative.dev/service=geofence-handler -c user-container --tail=5
Expected: the tracker returns the position and the handler logs recorded. A read of the table shows the row:
kubectl --context hub -n react run psql2 --rm -i --restart=Never --image=postgres:17-alpine \
  --env=PGHOST="$PG_HOST" --env=PGDATABASE=coldchain --env=PGUSER=coldchain_app --env=PGSSLMODE=require \
  --env=PGPASSWORD="$(kubectl --context hub -n react get secret pg-app -o jsonpath='{.data.password}' | base64 -d)" \
  --command -- psql -c "SELECT event_id, event_type, geofence_id, device_id, sample_time FROM geofence_events ORDER BY received_at DESC LIMIT 5"
Expected: an ENTER for depot-navi-mumbai. The geofence-handler Service scales to zero when idle, so the first event after a quiet period waits for a pod to start; the gateway has already answered EventBridge by then, and the Trigger retries if the pod is not ready. A position outside every geofence produces no event.
Checkpoint 7. The gateway answers 401 without the key and 202 with it, a position inside the depot produces one ENTER row, and a repeated event produces no second row.
8. Mean kinetic temperature per shipment
Mean kinetic temperature (MKT) is one number for a temperature history that weighs warm periods more than cool ones, because degradation speeds up as it gets warmer. It is MKT = (ΔH/R) / -ln( mean( e^(-ΔH/(R·T)) ) ), with T in kelvin and ΔH/R taken as 10,000 K, the value in common use when nothing product-specific is known. A shipment that sat at 2 °C for nine readings and 30 °C for one has a plain mean of 4.8 °C and an MKT of 12.4 °C, and the second number is the one that says something about the damage.
The job runs every 15 minutes. It finds shipments that are delivered (the geofence handler set delivered_at) and have no summary yet, reads the readings of each from openGemini in 6-hour chunks (so no query returns too much), computes MKT, the maximum and the minutes above the limit, and inserts one row into shipment_summaries. ON CONFLICT DO NOTHING makes a second run harmless.
# handlers/excursion/mkt.py
#!/usr/bin/env python3
"""Mean kinetic temperature per delivered shipment, written to shipment_summaries. Run by a CronJob."""
import math, os, sys
sys.path.insert(0, os.path.dirname(os.path.dirname(os.path.abspath(__file__))))
from common import db, series_points

DH_OVER_R = 10000.0                                       # K; about 83.144 kJ/mol divided by the gas constant
MAX_GAP_S = 60
CHUNK_S = 6 * 3600


def mkt_c(temps_c):
    """MKT = (dH/R) / -ln( (sum exp(-dH/R / T)) / n ), T in kelvin, result in Celsius."""
    ks = [-DH_OVER_R / (t + 273.15) for t in temps_c]
    m = max(ks)                                           # log-sum-exp, so the sum cannot underflow
    log_mean = m + math.log(sum(math.exp(k - m) for k in ks)) - math.log(len(ks))
    return DH_OVER_R / -log_mean - 273.15


def minutes_above(points, limit):
    """Time spent above the limit; each reading counts until the next one, capped by MAX_GAP_S."""
    total = 0.0
    for (t, v), (t2, _) in zip(points, points[1:]):
        if v > limit:
            total += min(t2 - t, MAX_GAP_S)
    return total / 60.0


def main():
    with db().cursor() as cur:
        cur.execute("SELECT shipment_id, device_id, extract(epoch FROM start_time), extract(epoch FROM end_time), limit_c "
                    "FROM shipments s WHERE end_time IS NOT NULL AND NOT EXISTS "
                    "(SELECT 1 FROM shipment_summaries m WHERE m.shipment_id = s.shipment_id)")
        todo = cur.fetchall()
    for shipment, device, t0, t1, limit in todo:
        pts, t = [], float(t0)
        while t < float(t1):
            pts += series_points(device, "-", t, min(t + CHUNK_S, float(t1)))
            t += CHUNK_S
        pts = sorted(set(pts))
        if not pts:
            print(f"{shipment}: no readings, skipped", flush=True)
            continue
        temps = [v for _, v in pts]
        with db().cursor() as cur:
            cur.execute("INSERT INTO shipment_summaries (shipment_id, readings, mean_c, min_c, max_c, mkt_c, minutes_above_limit) "
                        "VALUES (%s,%s,%s,%s,%s,%s,%s) ON CONFLICT (shipment_id) DO NOTHING",
                        (shipment, len(temps), sum(temps) / len(temps), min(temps), max(temps), mkt_c(temps),
                         minutes_above(pts, float(limit))))
        print(f"{shipment}: n={len(temps)} mkt={mkt_c(temps):.2f} C", flush=True)


if __name__ == "__main__":
    main()
# platform/mkt-cronjob.yaml
apiVersion: batch/v1
kind: CronJob
metadata: { name: mkt, namespace: react }
spec:
schedule: "*/15 * * * *"
concurrencyPolicy: Forbid
successfulJobsHistoryLimit: 3
failedJobsHistoryLimit: 3
jobTemplate:
spec:
backoffLimit: 1
template:
spec:
restartPolicy: Never
containers:
- name: mkt
image: ECR_EXCURSION
command: ["python", "/app/excursion/mkt.py"]
env:
- { name: PGHOST, valueFrom: { secretKeyRef: { name: pg-app, key: host } } }
- { name: PGDATABASE, value: coldchain }
- { name: PGUSER, value: coldchain_app }
- { name: PGPASSWORD, valueFrom: { secretKeyRef: { name: pg-app, key: password } } }
- { name: PGSSLMODE, value: require }sed -e "s#ECR_EXCURSION#$ECR_EXCURSION#" platform/mkt-cronjob.yaml | kubectl --context hub apply -f -
kubectl --context hub -n react create job --from=cronjob/mkt mkt-manual-1
kubectl --context hub -n react wait --for=condition=complete job/mkt-manual-1 --timeout=120s
kubectl --context hub -n react logs job/mkt-manual-1Expected: a log line per shipment that was summarised (none if no shipment is delivered yet). After the ENTER event in section 7.4, if you mark the shipment delivered the same way (the customer-pune geofence for reefer-004), the next run writes a row. Read it with the same psql pattern as before: SELECT shipment_id, mkt_c, max_temp_c, minutes_above_limit FROM shipment_summaries.
Checkpoint 8. The manual job completes, and a delivered shipment has one summary row; running the job again adds none.
9. The excursion test: how to measure the delay
The target is a page within 60 seconds of the moment the condition becomes true. That moment is the 31st reading above the limit (the first reading above it, plus 300 seconds). This section is a method. It has not been run for this post, so no result is shown, only the shape of one.
What the test does:
- It publishes a scripted profile as
reefer-004through the real path (IoT Core, MSK, Knative): 2 minutes at 5 °C, 6 minutes at 9 °C, 1 minute at 5 °C, one reading every 10 seconds. - It records the local time at which the condition became true.
- The alert-sink pod (section 6) records, by its own clock, when Alertmanager delivered the firing alert.
- It subtracts, after correcting for the difference between the two clocks, measured with the midpoint method over seven exchanges. If the clocks differ by more than a second the test refuses to run, because the result would be meaningless.
# ops/excursion_test.py
#!/usr/bin/env python3
"""Measured excursion test. Publishes a scripted profile as reefer-004 through AWS IoT Core and times the alert.

  python ops/excursion_test.py --endpoint $IOT_ENDPOINT --certdir certs --sink http://localhost:8088

Needs: certs/reefer-004/{cert,key}.pem, certs/AmazonRootCA1.pem, and
kubectl -n monitoring port-forward svc/alert-sink 8088:8080 running in another terminal."""
import argparse, json, ssl, sys, time, urllib.request
import paho.mqtt.client as mqtt

BASE_S, HOT_S, COOL_S, STEP = 120, 360, 60, 10          # 2 min in range, 6 min at 9.0 C, 1 min back in range
LIMIT_S = 300                                            # the rule: above the limit for 5 minutes
BUDGET_S = 60                                            # the target: a page within 60 s of the condition


def clock_offset(sink):
    """Sink clock minus local clock, from the exchange with the smallest round trip (midpoint method)."""
    best = None
    for _ in range(7):
        a = time.time(); s = json.load(urllib.request.urlopen(sink + "/time", timeout=5))["now"]; b = time.time()
        if best is None or b - a < best[0]:
            best = (b - a, s - (a + b) / 2)
    return best[1], best[0]


def latency(t_cond_local, recv_sink, offset):
    """Seconds from the moment the condition became true (local clock) to the alert's arrival (sink clock)."""
    return (recv_sink - offset) - t_cond_local


def main():
    ap = argparse.ArgumentParser()
    ap.add_argument("--endpoint", required=True); ap.add_argument("--certdir", default="certs")
    ap.add_argument("--sink", default="http://localhost:8088"); ap.add_argument("--device", default="reefer-004")
    a = ap.parse_args()

    offset, rtt = clock_offset(a.sink)
    print(f"clock offset sink-local: {offset*1000:+.0f} ms (round trip {rtt*1000:.0f} ms)")
    if abs(offset) > 1.0:
        sys.exit("clocks differ by more than 1 s: fix time sync before measuring")
    before = len(json.load(urllib.request.urlopen(a.sink + "/alerts", timeout=5)))

    c = mqtt.Client(mqtt.CallbackAPIVersion.VERSION2, client_id=a.device, protocol=mqtt.MQTTv311)
    c.tls_set(ca_certs=f"{a.certdir}/AmazonRootCA1.pem", certfile=f"{a.certdir}/{a.device}/cert.pem",
              keyfile=f"{a.certdir}/{a.device}/key.pem", tls_version=ssl.PROTOCOL_TLS_CLIENT)
    c.connect(a.endpoint, 8883, keepalive=30); c.loop_start()

    n_base, n_hot, n_cool = BASE_S // STEP, HOT_S // STEP, COOL_S // STEP
    t_cond = None
    for i in range(n_base + n_hot + n_cool):
        hot = n_base <= i < n_base + n_hot
        now = time.time()
        body = {"device_id": a.device, "seq": i + 1, "ts": time.strftime("%Y-%m-%dT%H:%M:%S", time.gmtime(now)) + f".{int(now*1000)%1000:03d}Z",
                "temp_c": 9.0 if hot else 5.0, "humidity": 60.0, "door_open": False, "compressor_on": True}
        info = c.publish(f"fleet/{a.device}/telemetry", json.dumps(body, separators=(",", ":")), qos=1)
        info.wait_for_publish(timeout=5)
        if i == n_base + LIMIT_S // STEP:                 # the 31st reading above the limit: the run is exactly 300 s
            t_cond = now
            print(f"condition true at reading {i+1}, {time.strftime('%H:%M:%S', time.localtime(now))}")
        time.sleep(STEP)
    c.loop_stop(); c.disconnect()

    time.sleep(5)
    seen = json.load(urllib.request.urlopen(a.sink + "/alerts", timeout=5))[before:]
    firing = [x for x in seen if x["labels"].get("device") == a.device and x["status"] == "firing"]
    if not firing or t_cond is None:
        sys.exit("FAIL: no firing alert reached the sink")
    lat = latency(t_cond, firing[0]["recv"], offset)
    print(f"alert reached the sink {lat:.1f} s after the condition (budget {BUDGET_S} s, clock uncertainty about {rtt/2*1000:.0f} ms)")
    print("RESULT:", "PASS" if lat <= BUDGET_S else "FAIL")


if __name__ == "__main__":
    main()
python3 -m venv .venv && . .venv/bin/activate && pip install paho-mqtt
kubectl --context hub -n monitoring port-forward svc/alert-sink 8088:8080 &
export IOT_ENDPOINT=$(aws iot describe-endpoint --endpoint-type iot:Data-ATS --query endpointAddress --output text)
python ops/excursion_test.py --endpoint $IOT_ENDPOINT --certdir certs --sink http://localhost:8088Expected output, in this shape (the numbers are placeholders for what you will measure):
clock offset sink-local: +<ms> ms (round trip <ms> ms)
condition true at reading 31, HH:MM:SS
alert reached the sink <s> s after the condition (budget 60 s, clock uncertainty about <ms> ms)
RESULT: PASS
Run it at least ten times, at different times of day, and keep every result, not the best one. Where the time goes, for reading the numbers: the IoT rule and MSK add a second or two; the KafkaSource polls and delivers within about a second; the handler’s query and insert take milliseconds; Alertmanager’s group_wait: 0s removes the grouping delay; the webhook is the last hop. A result over 60 seconds usually means a cold handler, a source that is not at minimum scale, or Alertmanager’s group_wait left at its default. Record the worst of the runs in the quality file, with the versions and the date.
A second test, for no alert while in range: publish the same profile at 7.9 °C and confirm no firing alert and no row in excursion_cases. A third, for reseeding after an outage: stop the simulator’s network for ten minutes at 9 °C so it spools, restore it, and confirm that exactly one case opens, marked late, with the start time of the first hot reading.
Checkpoint 9. Ten runs are recorded, the worst is under 60 seconds or the cause is written down, and the in-range test shows no alert.
10. Troubleshooting, cost, cleanup, design notes and checklist
Troubleshooting
| Symptom | Likely cause | What to check |
|---|---|---|
| openGemini refuses connections from other pods | It listens on loopback only | The bind-address entries in its config; set them to 0.0.0.0 in a mounted config file and restart |
check_store.py shows stored below the range |
A write failed, or Vector restarted before an acknowledgement | kubectl -n ingest logs deploy/vector for sink errors; field-type conflicts show as 400 responses |
| Write rejected: field type conflict | The field was first written as another type | SHOW FIELD KEYS FROM readings; drop the measurement on a lab database and rewrite |
| KafkaSource is not ready | Wrong bootstrap list, TLS or SCRAM settings | kubectl -n react describe kafkasource; check the msk-kn Secret keys against the source’s net.sasl section |
| Handler logs nothing | The source’s consumer group is behind, or the topic has no messages | kafka-consumer-groups.sh --describe --group knative-excursion through the client pod |
| A case opens twice | The partial unique index is missing | \d excursion_cases should show one_open_case; rerun db-init |
| No alert, but a case exists | Alertmanager is unreachable from the handler | The ALERTMANAGER_URL value and the pod’s logs; the handler returns 5xx so the source retries |
| Alert arrives late | group_wait default, cold handler, or a refresh gap |
Section 9 notes; minScale on the Service |
| EventBridge shows failed invocations | Certificate not trusted or key wrong | The API destination’s DLQ in SQS; curl the endpoint as in 7.3 |
401 with the right key |
The Secret has a trailing newline | Recreate it with --from-literal and no echo |
| No ENTER event | Position outside the polygon, wrong winding, or tracker not linked to the collection | aws location list-tracker-consumers; swap the ring direction |
| Grafana panel empty | Data source URL or database | Data source test; the query SELECT * FROM readings LIMIT 1 through the port-forward |
Pods stuck in ImagePullBackOff |
ECR permission or a tag used instead of a digest | The node role’s ECR policy; use the digest |
Cost note
No prices were read for this post, so none are quoted. The recurring items are: an EBS volume for openGemini, the NLB and its traffic, the Knative handlers (one warm pod each at minimum scale), the Prometheus and Grafana volumes, Amazon Location tracker updates and geofence evaluations (billed per request), EventBridge invocations, SQS for the dead letters, and the RDS instance from Part 1. The load here is small. Price it in the AWS Pricing Calculator for ap-south-1, and set a budget alarm before you leave the lab running.
Cleanup
kubectl --context hub delete -f platform/knative/broker.yaml --ignore-not-found
kubectl --context hub -n react delete ksvc --all; kubectl --context hub -n react delete kafkasource --all
kubectl --context hub -n kourier-system delete svc kourier-public
helm --kube-context hub -n monitoring uninstall monitoring; helm --kube-context hub -n dashboards uninstall perses
kubectl --context hub delete -f platform/opengemini.yaml
aws location delete-geofence-collection --collection-name $COLLECTION 2>/dev/null   # OpenTofu removes it too
(cd infra/foundation && tofu destroy -target=aws_cloudwatch_event_rule.geofence)    # then the rest of the file
aws iot delete-topic-rule --rule-name coldchain_position_to_location
Volumes marked Retain stay; delete them by hand if you want the data gone. The RDS data remains until Part 5’s teardown.
Design notes and version checks
Things this blueprint chose, and things to confirm on your versions before relying on them.
- Store. One openGemini server with a 20 GiB volume, database
telemetry, retentionrp400d. Confirm the image tag, that the server’s HTTP bind address is reachable from other pods, and where its config file lives if you turn on authentication. Authentication is off in this build, so the network policy is the only guard: enable it before any shared use. - Vector. The
influxdb_logssink withversion: "1"andacknowledgements.enabled. Confirm the chart’s key names and thattemp_cstays a float. - Knative.
v1.24.0; confirm the Kafka extension has the same tag, that KafkaSource accepts the TLS and SASL settings used for MSK’s public certificate, the Broker’s auth-secret key names and thekafka-broker-configConfigMap keys, and the DomainMapping and ClusterDomainClaim API versions. - Ingress. The Kourier pod label and the NLB annotations for ACM termination are the in-tree ones; if you run the AWS Load Balancer Controller, use its annotations instead.
- EventBridge. The input transformer’s quoting is easy to get wrong: if the gateway receives a body that is not a CloudEvent, look at the DLQ message first. API destinations time out at 5 seconds, which is why the gateway answers before it forwards.
- Amazon Location. Resource names for the tracker and collection in OpenTofu, and the location action for IoT rules (done by CLI here), depend on your provider version. Events can repeat; the table’s primary key absorbs that.
- Alerting. Alertmanager treats an alert that is not refreshed as resolved after
resolve_timeout; the handler refreshes about once a minute. Mean kinetic temperature usesΔH/R = 10000 K; use the product’s own value if it has one. - Dashboards. Grafana reads openGemini through its InfluxDB data source with InfluxQL; check the Perses chart’s values for persistence.
- Checked offline. The detection rule at its edges, the MKT arithmetic and the case open, refresh and close flow were run against fakes on a laptop. They show the logic is as described, not that the cluster behaves.
- Not measured. The alert delay (section 9 is a method), live throughput, and cost.
Setup checklist
- 1. Prerequisites: done when the exports print, the cluster answers and Vector logs real readings
- 2. openGemini: done when the volume is bound, the retention policy exists and the same point written twice counts once
- 3. RDS schema: done when
db-initcompletes, and completes again on a rerun - 4. Vector sink: done when
check_store.pypasses, before and after a replay - 5. Knative and handlers: done when the KafkaSource is ready and the scripted run opens exactly one case
- 6. Alerting and dashboards: done when
amtoolaccepts the config, Perses draws and Grafana shows temperatures - 7. Geofences: done when the gateway answers 401 and 202, and an ENTER produces one row
- 8. Mean kinetic temperature: done when a delivered shipment has one summary row and a second run adds none
- 9. Excursion test: done when ten runs are recorded and the worst is under 60 seconds or the cause is written down
- 10. Cleanup path: done when you know which of these resources you will delete and in what order
Tools used
openGemini, Knative, Vector, Apache Kafka, Prometheus, Perses and OpenTofu, plus Amazon RDS for PostgreSQL, Amazon Location Service, Amazon EventBridge, AWS IoT Core, Amazon ECR, Alertmanager and Grafana.
What comes next
Part 4 adds the partner API that reads shipments and cases from RDS, Dex sign-in for Grafana, and the signed-image and policy layers. Part 5 tests an RDS snapshot restore and closes the project.