This is Part 5 of the five-part build in the Sprint 5 project overview. Part 4 closed the doors: partners see only their shipments, secrets have one home each and the custody record is hard to change quietly. What is left is the part that decides whether anyone would run this for real. Can you get the data back after a loss? Does the platform carry the whole fleet and not just three trucks? Does somebody hear when a vehicle goes quiet? And can the whole thing be removed on a Saturday afternoon so that the bill stops?
This part answers each with a test and not with a claim: backups with a restore (Kanister for openGemini, CloudNativePG for the OpenFGA database, an RDS snapshot for the business data), a load test with hypotheses written down before it runs (Kube-burner plus the simulator), a synthetic check for silent vehicles (Kuberhealthy), a cost review and a teardown script.
Where this part fits. This part builds recovery, scale, health checks and teardown (marked Part 5 on the overall diagram). Open the zoomable Sprint 5 architecture or read the Overview.
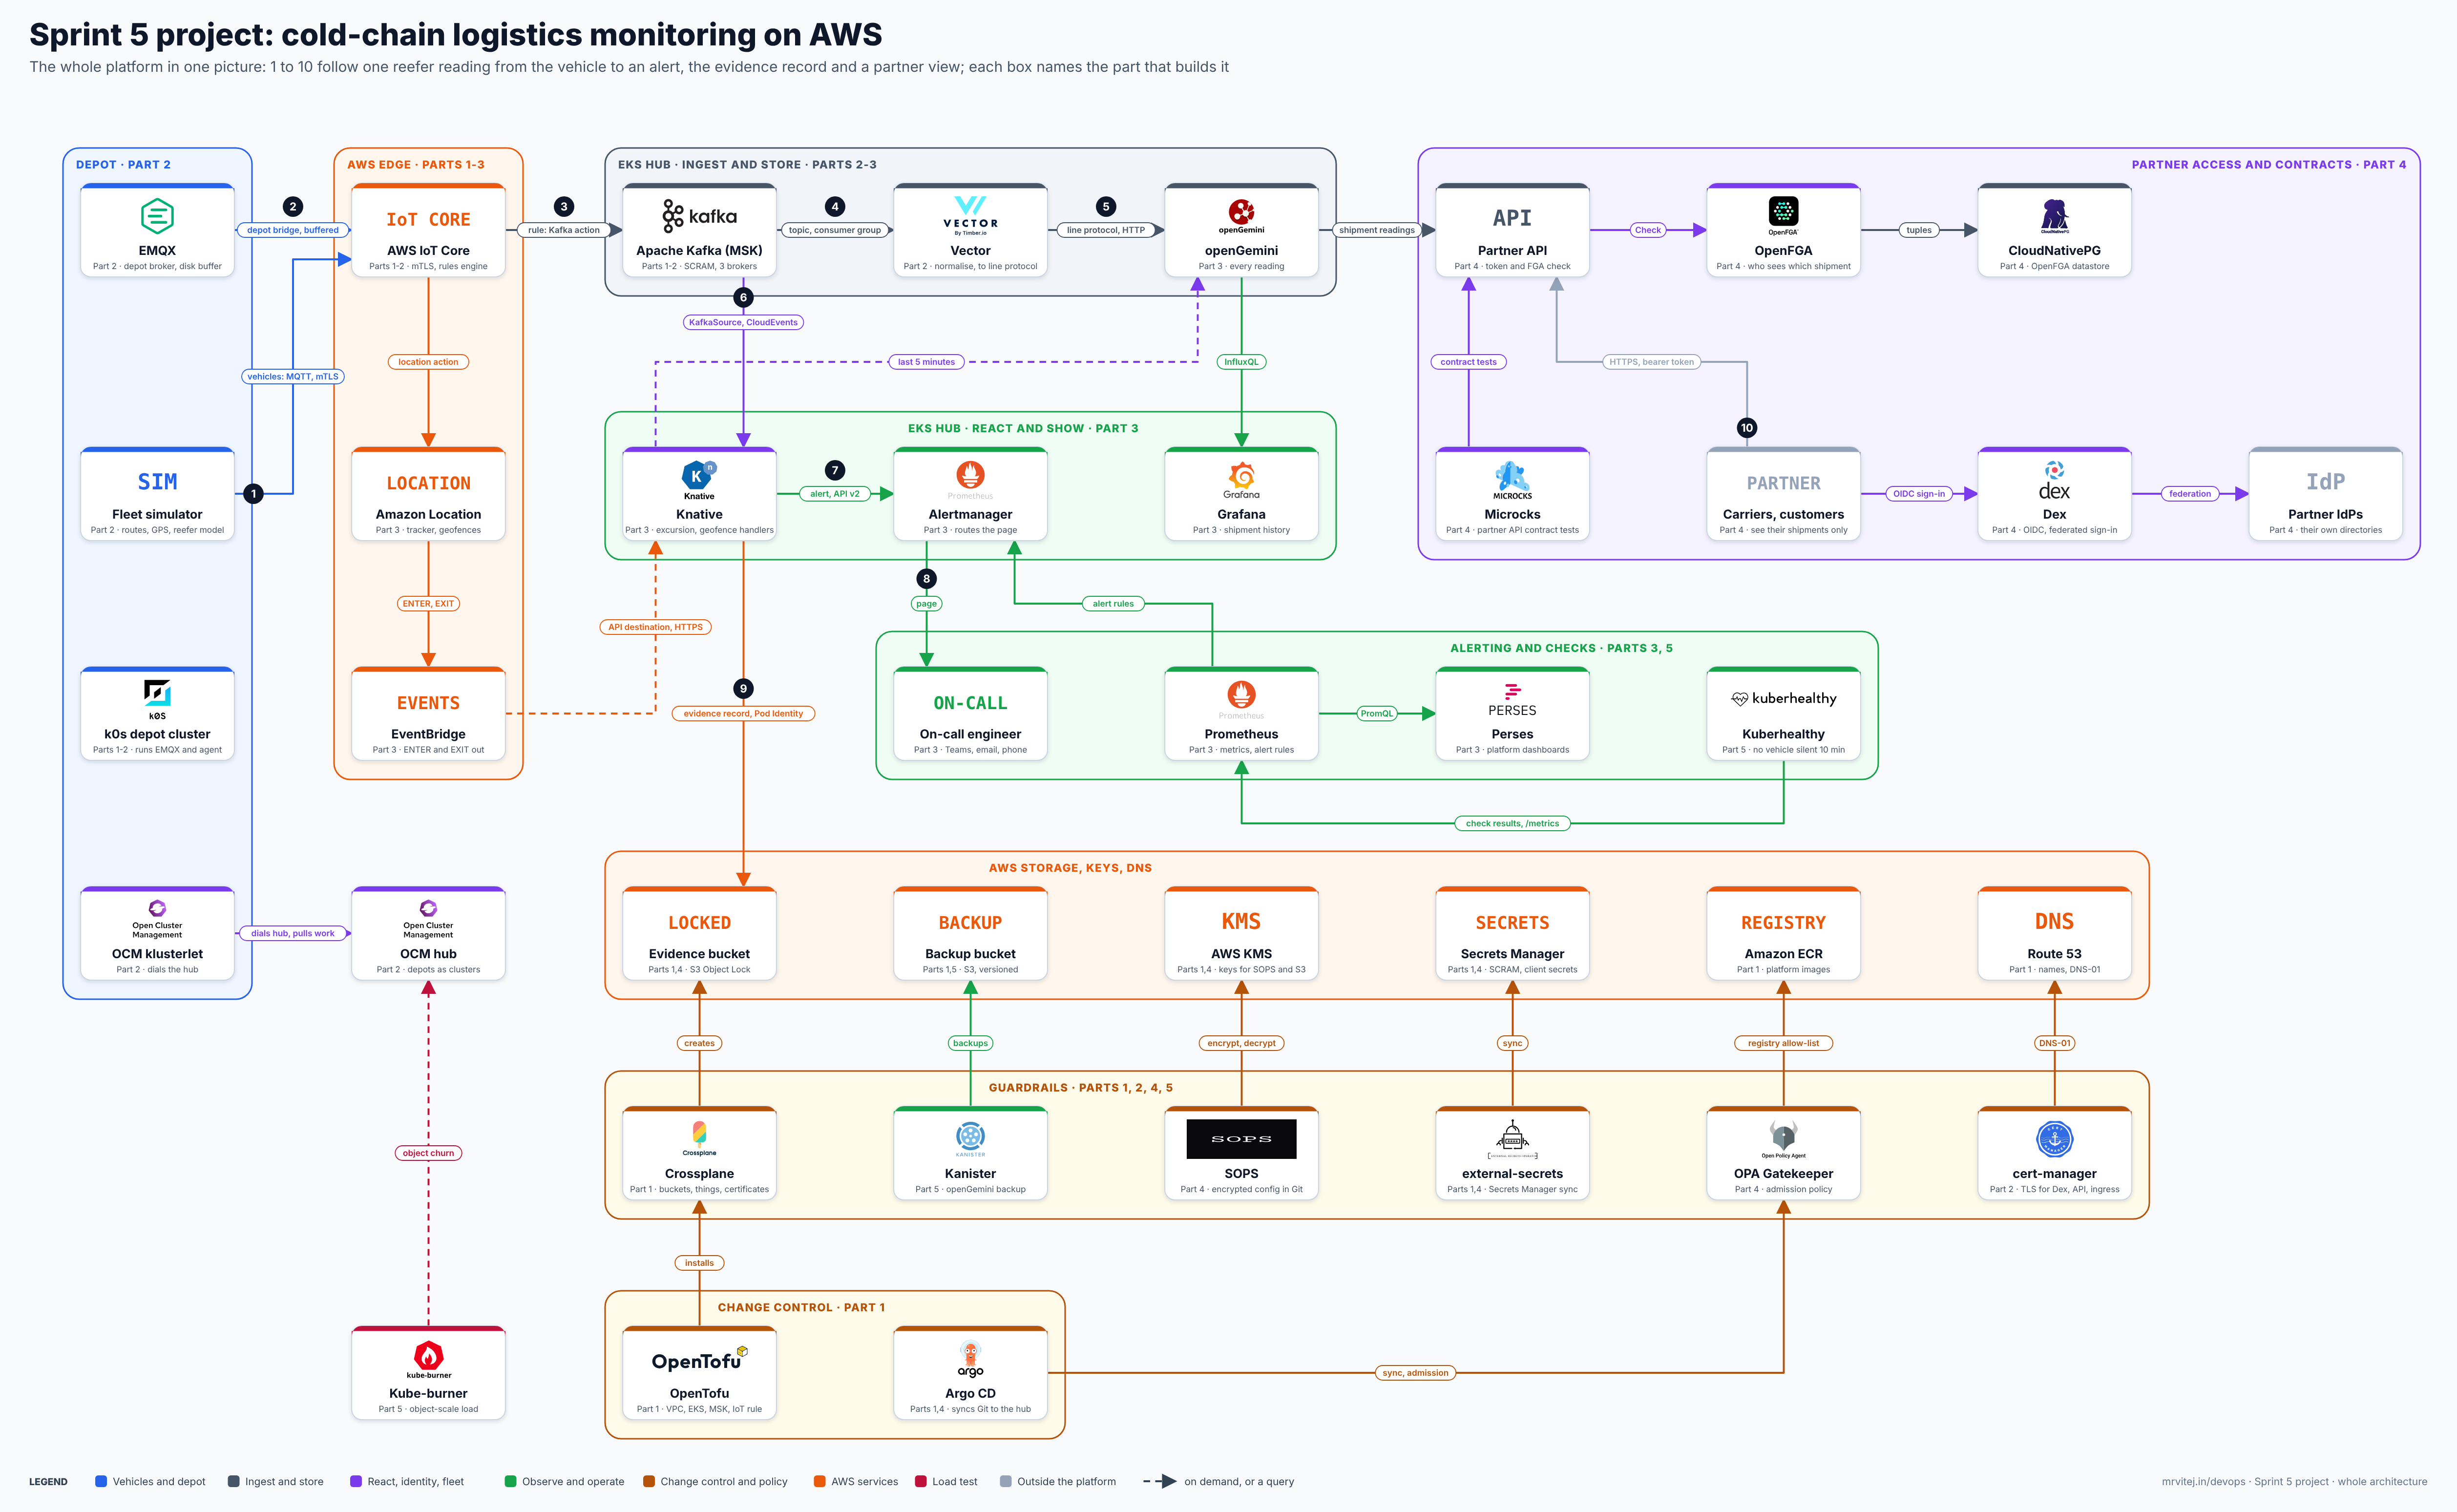
What this is and is not. This is engineering guidance, not legal or regulatory advice. A backup you have restored once in a lab is evidence that the method works; it is not a validated disaster-recovery procedure, and the recovery targets a regulated product needs are the company’s to set. Where this post says a step could not be tested, it means it: the list is in section 10 and in the design notes. If you find a mismatch with your versions, use the “Suggest a correction” link on this page.
What you build, and in what order
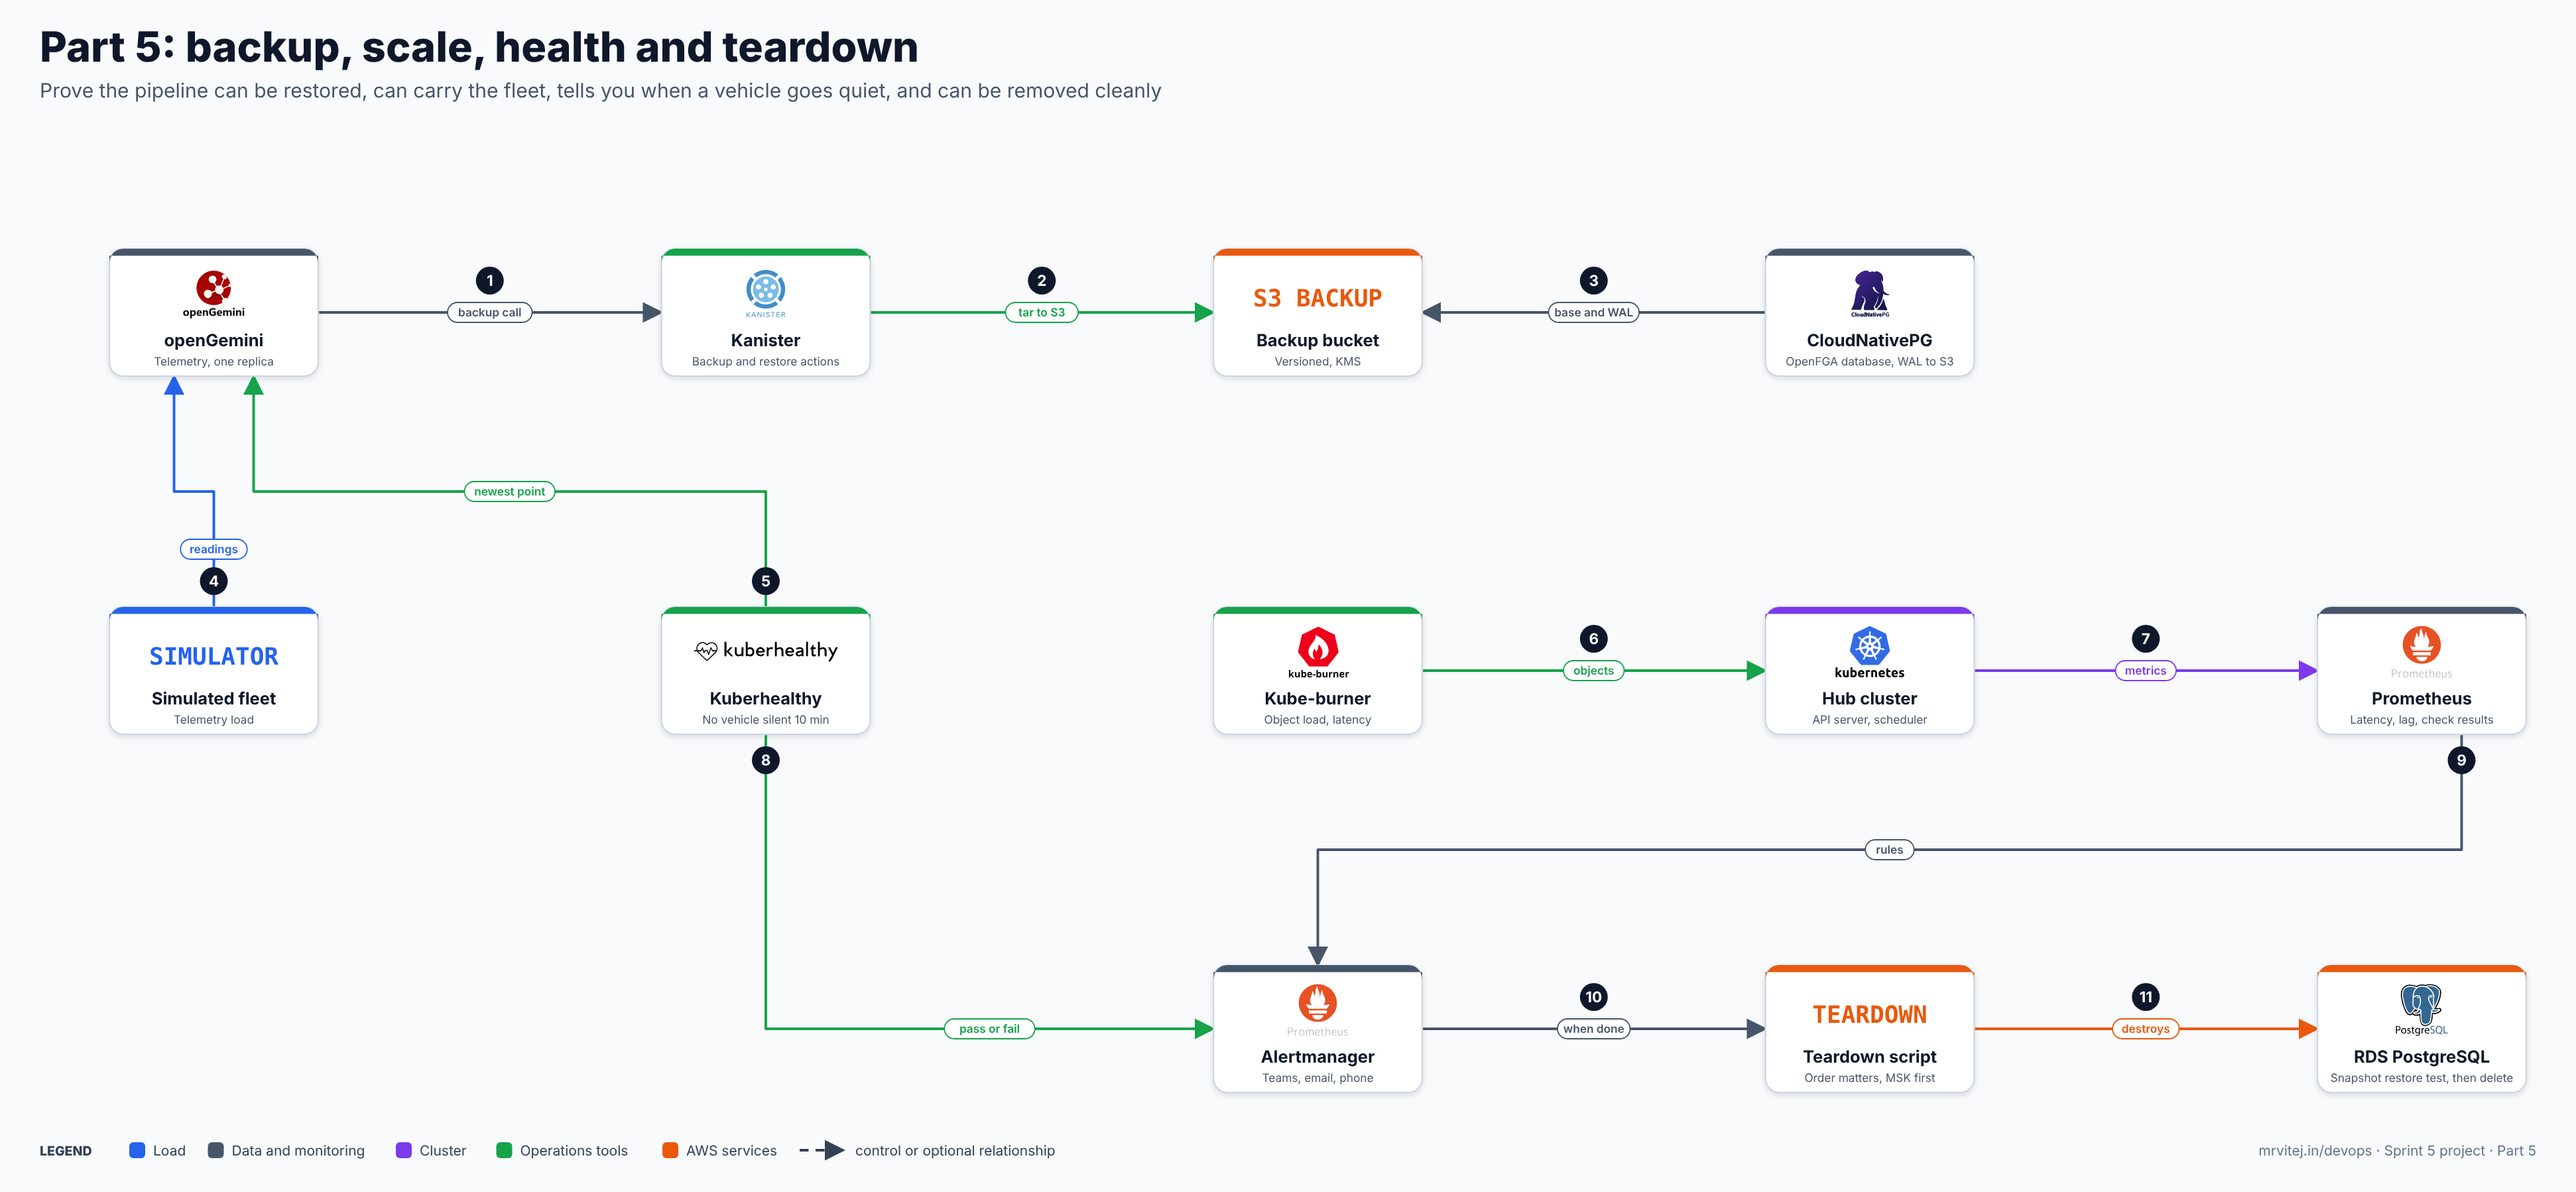
One image, the layers of this part. Open the zoomable diagram, or download it as SVG or PNG.
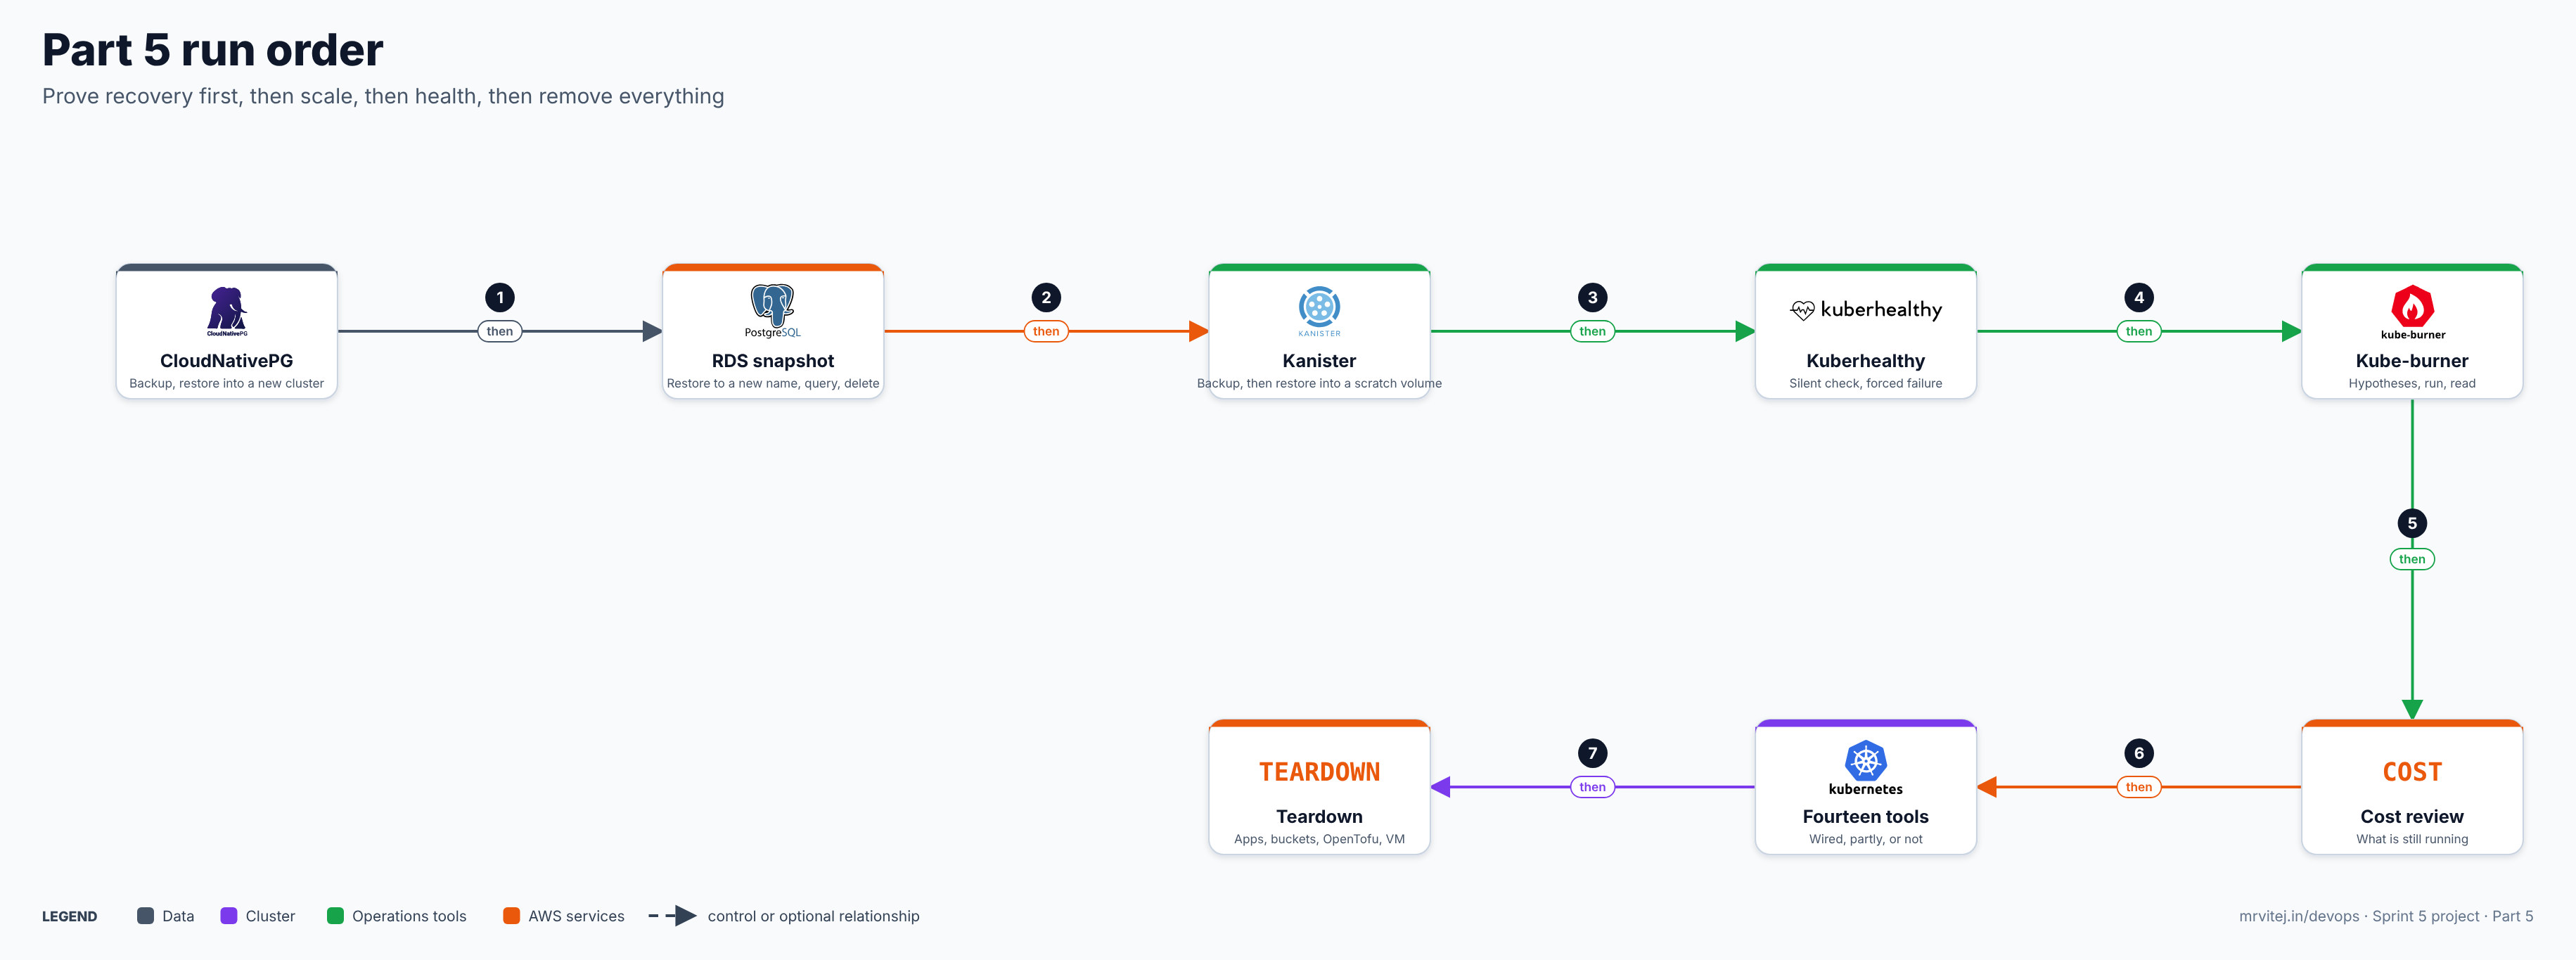
- Prerequisites and versions
- CloudNativePG: backups of the OpenFGA database, and a restore into a new cluster
- RDS: a snapshot restore test (the business data)
- Kanister: back up openGemini through S3, restore into a scratch volume
- Kuberhealthy: a check that fails when a vehicle goes silent
- Scale: Kube-burner and the simulator, with hypotheses first
- Cost review
- All fourteen tools: wired, partly, or not
- Teardown
- Troubleshooting, cost, cleanup, design notes and checklist
The decisions behind it
Each store is backed up by the tool that understands it. RDS has snapshots, so it gets a snapshot restore test. CloudNativePG has its own backup path and continuous WAL archiving, so it uses that and not a volume copy. openGemini has a documented backup call that writes to a local path, so Kanister runs that call and moves the result to S3. A volume snapshot copied while a database is writing can capture a state the database cannot recover from, which is the reason Kanister exists.
A restore is the only proof. Every backup in this part has a restore step, run into a new place (a new cluster, a new instance, a scratch volume) so the live data is never at risk, followed by a comparison with something you recorded before.
Hypotheses before load. Section 6 writes down what you expect before the test runs, and says what each outcome would mean. Numbers in this post are targets, not results; nothing here was run on a live cluster.
The check has to be able to fail. Kuberhealthy’s silent-vehicle check is tested offline against fake responses, then on the cluster by stopping a simulated vehicle on purpose and watching the alert fire. A check that has never been seen to fail is not yet a check.
1. Prerequisites and versions
| Item | Version or detail | Why |
|---|---|---|
| Parts 1 to 4 complete | Every checkpoint passes | The hub, RDS, MSK, openGemini, the partner API and the buckets exist |
| CloudNativePG | Operator 1.26 or newer | The Barman Cloud plugin requires it |
| Barman Cloud plugin | A release from cloudnative-pg/plugin-barman-cloud; set BARMAN_PLUGIN_VERSION |
Backups and WAL archiving to S3; needs cert-manager (Part 2) |
| Kanister | Chart kanister/kanister-operator from https://charts.kanister.io/; set KANISTER_VERSION |
Kanister brief |
| Kube-burner | A release from kube-burner/kube-burner; set KB_VERSION |
Kube-burner brief |
| Kuberhealthy | The release you install from the project’s Helm chart; set KH_VERSION |
Kuberhealthy brief |
| openGemini | The tag from Part 3 | Backup and ts-recover come from the same release |
| Tools on your workstation | kubectl, helm, jq, aws CLI v2, Docker with buildx, Python 3.12, kanctl and kando from the Kanister release |
Set the variables you will reuse. The first group is from Part 1; the second is new here.
export AWS_REGION=ap-south-1 AWS_DEFAULT_REGION=ap-south-1
export SUFFIX=abc123                              # the same suffix as Part 1
export ACCOUNT=$(aws sts get-caller-identity --query Account --output text)
export ECR=$ACCOUNT.dkr.ecr.$AWS_REGION.amazonaws.com
export BACKUP_BUCKET=coldchain-backup-$SUFFIX
export STATE_BUCKET=coldchain-tfstate-$SUFFIX
# New in Part 5. Fill these from the release pages; the post does not guess them.
export BARMAN_PLUGIN_VERSION=            # for example the version your CloudNativePG documentation names
export KANISTER_VERSION=
export KB_VERSION=
export KH_VERSION=
Checkpoint: kubectl --context hub get nodes shows the nodes Ready, aws s3api head-bucket --bucket $BACKUP_BUCKET succeeds, and kubectl --context hub -n access get cluster.postgresql.cnpg.io fga-pg shows the cluster healthy.
2. CloudNativePG: backups of the OpenFGA database, and a restore into a new cluster
OpenFGA’s tuples are the only record of who may see which shipment, so losing that database means partners see nothing until someone rebuilds the access list. The Barman Cloud plugin is the current route for object-store backups: it archives WAL continuously and takes base backups, and it replaces the older barmanObjectStore section in the Cluster resource.
2.1 Install the plugin and give the cluster access to the bucket
The plugin installs from a manifest published with each release, into the namespace where the operator runs. Install it and wait for it:
kubectl --context hub apply -f \
  https://github.com/cloudnative-pg/plugin-barman-cloud/releases/download/v${BARMAN_PLUGIN_VERSION}/manifest.yaml
kubectl --context hub -n cnpg-system rollout status deployment/barman-cloud --timeout=180s
kubectl --context hub get crd objectstores.barmancloud.cnpg.io
Access to S3 uses EKS Pod Identity, as everywhere else in this build, so no key is created. Add a role for the service account the cluster runs under (CloudNativePG names it after the cluster, fga-pg) in the Part 1 OpenTofu stack. The policy lets it write and read only under its own prefix:
# infra/foundation/backup.tf
variable "suffix" { type = string }      # the same short suffix as the bucket names

data "aws_iam_policy_document" "fga_backup" {
  statement {
    actions   = ["s3:PutObject", "s3:GetObject", "s3:DeleteObject", "s3:AbortMultipartUpload"]
    resources = ["arn:aws:s3:::coldchain-backup-${var.suffix}/fga-pg/*"]
  }
  statement {
    actions   = ["s3:ListBucket", "s3:GetBucketLocation"]
    resources = ["arn:aws:s3:::coldchain-backup-${var.suffix}"]
  }
  statement {
    actions   = ["kms:GenerateDataKey", "kms:Decrypt"]
    resources = [aws_kms_key.platform.arn]
  }
}

resource "aws_iam_role" "fga_backup" {
  name               = "coldchain-fga-backup"
  assume_role_policy = data.aws_iam_policy_document.pod_trust.json
}

resource "aws_iam_role_policy" "fga_backup" {
  role   = aws_iam_role.fga_backup.id
  policy = data.aws_iam_policy_document.fga_backup.json
}

resource "aws_eks_pod_identity_association" "fga_backup" {
  cluster_name    = module.eks.cluster_name
  namespace       = "access"
  service_account = "fga-pg"
  role_arn        = aws_iam_role.fga_backup.arn
}
export TF_VAR_suffix=$SUFFIX
cd infra/foundation && tofu apply # with the same variables you used in Parts 1 to 4The Part 4 caution still applies: apply with the same variables you used before (including events_lb_hostname), or the events DNS record from Part 3 disappears.
2.2 The object store, the cluster change and the schedule
The ObjectStore names the bucket path and uses the pod’s role. The Cluster then asks the plugin to archive WAL. Add the plugins block to the Part 4 fga-pg manifest and apply both files:
# platform/cnpg-backup.yaml
apiVersion: barmancloud.cnpg.io/v1
kind: ObjectStore
metadata: { name: fga-store, namespace: access }
spec:
  retentionPolicy: "14d"
  configuration:
    destinationPath: s3://coldchain-backup-abc123/fga-pg/
    s3Credentials: { inheritFromIAMRole: true }       # Pod Identity, no keys in the cluster
    wal: { compression: gzip }
    data: { compression: gzip }
---
apiVersion: postgresql.cnpg.io/v1
kind: ScheduledBackup
metadata: { name: fga-daily, namespace: access }
spec:
  schedule: "0 0 21 * * *"                            # six fields, seconds first: 21:00 UTC is 02:30 IST
  backupOwnerReference: self
  cluster: { name: fga-pg }
  method: plugin
  pluginConfiguration: { name: barman-cloud.cloudnative-pg.io }
# platform/cnpg.yaml: add this under spec of the fga-pg Cluster from Part 4
plugins:
- name: barman-cloud.cloudnative-pg.io
isWALArchiver: true
parameters:
barmanObjectName: fga-storekubectl --context hub apply -f platform/cnpg-backup.yaml -f platform/cnpg.yaml
kubectl --context hub -n access get objectstore,scheduledbackupTake one backup now, so the restore test does not have to wait for the schedule:
kubectl --context hub apply -f - <<'YAML'
apiVersion: postgresql.cnpg.io/v1
kind: Backup
metadata: { name: fga-first, namespace: access }
spec:
  cluster: { name: fga-pg }
  method: plugin
  pluginConfiguration: { name: barman-cloud.cloudnative-pg.io }
YAML
kubectl --context hub -n access wait --for=jsonpath='{.status.phase}'=completed backup/fga-first --timeout=600s
aws s3 ls s3://$BACKUP_BUCKET/fga-pg/ --recursive | head
Expected: the Backup reaches completed, and objects appear under fga-pg/ (a base/ and a wals/ prefix). If the upload fails with an x-amz-content-sha256 error, that is a documented incompatibility between recent boto3 releases and some S3 endpoints; the plugin’s object-store page gives environment variables for the ObjectStore that work around it.
Checkpoint: the Backup is completed, objects exist in the bucket, and the cluster’s ContinuousArchiving condition is True.
2.3 Restore into a new cluster and compare
Record something you can compare, restore into a differently named cluster in the same namespace, then compare. The tuple count is a good probe because it is what you would miss.
# 1. what the live database holds
kubectl --context hub -n access exec fga-pg-1 -c postgres -- \
  psql -U postgres -d app -Atc "select count(*) from tuple" | tee /tmp/fga-live-count
# platform/fga-restore-test.yaml
apiVersion: postgresql.cnpg.io/v1
kind: Cluster
metadata: { name: fga-pg-restore, namespace: access }
spec:
instances: 1
storage: { size: 5Gi, storageClass: gp3 }
bootstrap:
recovery: { source: fga-source }
externalClusters:
- name: fga-source
plugin:
name: barman-cloud.cloudnative-pg.io
parameters: { barmanObjectName: fga-store, serverName: fga-pg }kubectl --context hub apply -f platform/fga-restore-test.yaml
kubectl --context hub -n access wait --for=condition=Ready cluster/fga-pg-restore --timeout=900s
kubectl --context hub -n access exec fga-pg-restore-1 -c postgres -- \
psql -U postgres -d app -Atc "select count(*) from tuple" | tee /tmp/fga-restored-count
diff /tmp/fga-live-count /tmp/fga-restored-count && echo "RESTORE MATCHES"Expected: RESTORE MATCHES. Two things can legitimately differ: tuples written after the backup (a recovery without a target time replays all archived WAL, so they should be present, but WAL is only archived when a segment fills or a switch is forced) and the table name (tuple is OpenFGA’s table in its Postgres schema; confirm with \dt if the query fails). When the test passes, delete the copy so it does not keep costing:
kubectl --context hub -n access delete cluster.postgresql.cnpg.io fga-pg-restoreCheckpoint: the counts match and the restore cluster is gone.
3. RDS: a snapshot restore test (the business data)
Shipments, devices, excursion cases and the evidence log live in RDS. RDS is not a CNCF project; it is here because those records must outlive the cluster. Its backup is a snapshot, and the test is the same shape as the others: restore to a new name, query, compare, delete. The restored instance is a real, billed database for as long as it exists, so do this in one sitting.
export DB=coldchain-pg
export SNAP=coldchain-pg-test-$(date -u +%Y%m%d%H%M)
export RESTORED=coldchain-pg-restore-test

# 1. what the live database holds (from a pod that can reach it; RDS is private)
kubectl --context hub -n react run psql-live --rm -it --restart=Never --image=postgres:17-alpine \
  --env PGPASSWORD="$(kubectl --context hub -n react get secret pg-admin -o jsonpath='{.data.password}' | base64 -d)" -- \
  psql -h $(aws rds describe-db-instances --db-instance-identifier $DB --query 'DBInstances[0].Endpoint.Address' --output text) \
  -U "$(kubectl --context hub -n react get secret pg-admin -o jsonpath='{.data.username}' | base64 -d)" -d coldchain \
  -Atc "select (select count(*) from shipments), (select count(*) from excursion_cases), (select count(*) from evidence_log)" | tee /tmp/rds-live-counts

# 2. take the snapshot and wait for it
aws rds create-db-snapshot --db-instance-identifier $DB --db-snapshot-identifier $SNAP
aws rds wait db-snapshot-available --db-snapshot-identifier $SNAP

# 3. restore to a NEW identifier, small and private, in the same subnet group and security group
SUBNET_GROUP=$(aws rds describe-db-instances --db-instance-identifier $DB --query 'DBInstances[0].DBSubnetGroup.DBSubnetGroupName' --output text)
SG=$(aws rds describe-db-instances --db-instance-identifier $DB --query 'DBInstances[0].VpcSecurityGroups[0].VpcSecurityGroupId' --output text)
aws rds restore-db-instance-from-db-snapshot \
  --db-instance-identifier $RESTORED --db-snapshot-identifier $SNAP \
  --db-subnet-group-name "$SUBNET_GROUP" --vpc-security-group-ids "$SG" \
  --db-instance-class db.t4g.micro --no-publicly-accessible --no-multi-az \
  --tags Key=project,Value=cold-chain Key=purpose,Value=restore-test
aws rds wait db-instance-available --db-instance-identifier $RESTORED
The restore keeps the master username and password of the snapshot, so the same pg-admin credentials open it. Query it from the same kind of pod and compare:
kubectl --context hub -n react run psql-restored --rm -it --restart=Never --image=postgres:17-alpine \
  --env PGPASSWORD="$(kubectl --context hub -n react get secret pg-admin -o jsonpath='{.data.password}' | base64 -d)" -- \
  psql -h $(aws rds describe-db-instances --db-instance-identifier $RESTORED --query 'DBInstances[0].Endpoint.Address' --output text) \
  -U "$(kubectl --context hub -n react get secret pg-admin -o jsonpath='{.data.username}' | base64 -d)" -d coldchain \
  -Atc "select (select count(*) from shipments), (select count(*) from excursion_cases), (select count(*) from evidence_log)" | tee /tmp/rds-restored-counts
diff /tmp/rds-live-counts /tmp/rds-restored-counts && echo "SNAPSHOT RESTORE MATCHES"
Expected: SNAPSHOT RESTORE MATCHES (counts can differ only if rows were written between the live query and the snapshot, so run the two close together and with the Part 3 and 4 writers quiet). Then remove the test instance and the snapshot:
aws rds delete-db-instance --db-instance-identifier $RESTORED --skip-final-snapshot --delete-automated-backups
aws rds wait db-instance-deleted --db-instance-identifier $RESTORED
aws rds delete-db-snapshot --db-snapshot-identifier $SNAP
A restore to a new identifier gets a new endpoint, which is the part people forget: a real recovery means pointing the applications at the new address (here, the pg-app Secret value that external-secrets syncs from Secrets Manager) and then renaming or replacing the old instance. The test above stops at proving the data is there.
Checkpoint: counts match, the test instance and the snapshot are deleted, and aws rds describe-db-instances --query 'DBInstances[].DBInstanceIdentifier' lists only coldchain-pg.
4. Kanister: back up openGemini through S3, restore into a scratch volume
openGemini’s backup is an HTTP call that writes a full backup to a path on the server’s own disk; backing up straight to a remote location is not supported. Restoring means stopping the database and running its ts-recover tool. That is exactly the shape Kanister handles: a Blueprint says what to run, in which pod, and where the result goes.
Three honest limits first. The backup call and ts-recover are in the openGemini documentation; the official server image may not contain ts-recover, so this part builds a small tools image that does. Kanister’s S3 Profile in this build uses an access key pair that you create for the purpose, because I could not confirm a keyless (Pod Identity) route for Profiles in the pages I read. And the restore is tested into a scratch volume, not over the live one, so the live database is never touched by the test.
4.1 A tools image and a sidecar
The Blueprint runs commands in a container that has curl, tar, kando (Kanister’s data mover) and ts-recover. Build one image with all four, from the Kanister tools image and the openGemini release, and push it to ECR:
# kanister/Dockerfile
# coldchain/backup-tools: curl, tar, kando (from the Kanister tools image) and ts-recover (from the openGemini release).
ARG KANISTER_TOOLS=ghcr.io/kanisterio/kanister-tools:0.0.0-REPLACE
FROM ${KANISTER_TOOLS} AS kt
FROM python:3.13-slim
ARG OG_TARBALL_URL
RUN apt-get update && apt-get install -y --no-install-recommends curl ca-certificates tar && rm -rf /var/lib/apt/lists/*
COPY --from=kt /usr/local/bin/kando /usr/local/bin/kando
RUN mkdir /opt/og && curl -fsSL "$OG_TARBALL_URL" | tar -xz -C /opt/og --strip-components=1 \
 && install -m 0755 "$(find /opt/og -name ts-recover -type f | head -1)" /usr/local/bin/ts-recover
USER 0
aws ecr create-repository --repository-name coldchain/backup-tools --image-tag-mutability IMMUTABLE >/dev/null
aws ecr get-login-password | docker login --username AWS --password-stdin $ECR
# Set OG_TARBALL_URL to the Linux amd64 release tarball of the same openGemini version as Part 3 (see its releases page).
docker buildx build --platform linux/amd64 \
--build-arg KANISTER_TOOLS=ghcr.io/kanisterio/kanister-tools:$KANISTER_VERSION \
--build-arg OG_TARBALL_URL="$OG_TARBALL_URL" \
-t $ECR/coldchain/backup-tools:1 --push kanister/
docker run --rm --entrypoint sh $ECR/coldchain/backup-tools:1 -c 'command -v kando ts-recover curl'The last command is the check: all three paths must print. If kando is not at /usr/local/bin/kando in the Kanister tools image of your version, find it with docker run --rm --entrypoint sh ghcr.io/kanisterio/kanister-tools:$KANISTER_VERSION -c 'command -v kando' and change the COPY line. Replace ACCOUNT in the Blueprint with your account ID, or sed it from $ACCOUNT.
The backup commands run in a second container of the openGemini pod, so they share its network (127.0.0.1:8086) and its data volume. Patch the Part 3 StatefulSet:
kubectl --context hub -n data patch statefulset opengemini --type=json -p "[
 {\"op\":\"add\",\"path\":\"/spec/template/spec/containers/-\",\"value\":{
   \"name\":\"backup-tools\",\"image\":\"$ECR/coldchain/backup-tools:1\",
   \"command\":[\"sleep\",\"infinity\"],
   \"volumeMounts\":[{\"name\":\"data\",\"mountPath\":\"/var/lib/openGemini\"}],
   \"resources\":{\"requests\":{\"cpu\":\"10m\",\"memory\":\"32Mi\"},\"limits\":{\"memory\":\"256Mi\"}}}}]"
kubectl --context hub -n data rollout status statefulset/opengemini --timeout=300s
The Part 4 Gatekeeper constraint covers only the react namespace, so data is not restricted. If you widened it, the image is from our ECR and passes anyway.
4.2 Install Kanister and create the Profile
helm repo add kanister https://charts.kanister.io/ && helm repo update
helm upgrade --install kanister kanister/kanister-operator -n kanister --create-namespace \
  --version $KANISTER_VERSION --kube-context hub --wait
kubectl --context hub -n kanister get pods
Create a narrow IAM user for the Profile (bucket coldchain-backup-*, prefix opengemini/), put its key in Secrets Manager, and create the Profile from values read at the shell so nothing is written to a file:
aws iam create-user --user-name coldchain-kanister
aws iam put-user-policy --user-name coldchain-kanister --policy-name backup-prefix --policy-document "{
 \"Version\":\"2012-10-17\",\"Statement\":[
  {\"Effect\":\"Allow\",\"Action\":[\"s3:PutObject\",\"s3:GetObject\",\"s3:DeleteObject\"],\"Resource\":\"arn:aws:s3:::$BACKUP_BUCKET/opengemini/*\"},
  {\"Effect\":\"Allow\",\"Action\":[\"s3:ListBucket\",\"s3:GetBucketLocation\"],\"Resource\":\"arn:aws:s3:::$BACKUP_BUCKET\"},
  {\"Effect\":\"Allow\",\"Action\":[\"kms:GenerateDataKey\",\"kms:Decrypt\"],\"Resource\":\"$(aws kms describe-key --key-id alias/coldchain-platform --query KeyMetadata.Arn --output text)\"}]}"
KEY=$(aws iam create-access-key --user-name coldchain-kanister --query AccessKey --output json)
kanctl --context hub create profile s3compliant --namespace kanister \
  --bucket $BACKUP_BUCKET --region $AWS_REGION \
  --access-key "$(jq -r .AccessKeyId <<<"$KEY")" --secret-key "$(jq -r .SecretAccessKey <<<"$KEY")"
unset KEY
kubectl --context hub -n kanister get profile
The key pair now lives in a Kubernetes Secret created by kanctl, which is the one place in this build where a long-lived AWS key exists. It is the weakest link in this part: rotate it, or replace the Profile with a keyless one once you confirm your Kanister version supports it. The KMS alias coldchain-platform is the one Part 1 creates (alias/${var.name}-platform). The bucket from Part 1 is versioned, so a deleted backup object can be recovered for as long as versions are kept.
4.3 The Blueprint
# kanister/blueprint.yaml
apiVersion: cr.kanister.io/v1alpha1
kind: Blueprint
metadata: { name: opengemini-bp, namespace: kanister }
actions:
  backup:
    type: StatefulSet
    outputArtifacts:
      og:
        keyValue:
          s3path: "{{ .Phases.pushToS3.Output.s3path }}"
          points: "{{ .Phases.pushToS3.Output.points }}"
    phases:
      - func: KubeExec
        name: pushToS3
        args:
          namespace: "{{ .StatefulSet.Namespace }}"
          pod: "{{ index .StatefulSet.Pods 0 }}"
          container: backup-tools
          command:
            - bash
            - -o
            - errexit
            - -o
            - pipefail
            - -c
            - |
              TS=$(date -u +%Y%m%dT%H%M%SZ)
              DIR=/var/lib/openGemini/backup/$TS
              mkdir -p "$DIR"
              # 1. openGemini writes a full backup to a local path (remote backup is not supported)
              curl -fsS -XPOST "http://127.0.0.1:8086/debug/ctrl?mod=backup&backupPath=$DIR&isInc=false"
              # 2. count the points now, so a restore can be compared with it
              POINTS=$(curl -fsS -G "http://127.0.0.1:8086/query" --data-urlencode "db=telemetry" \
                --data-urlencode 'q=SELECT count(temp_c) FROM "rp400d"."readings"' | python3 -c 'import sys,json; print(json.load(sys.stdin)["results"][0]["series"][0]["values"][0][1])')
              # 3. copy the backup to the Profile's bucket, then remove the local copy
              S3PATH="opengemini/$TS.tar.gz"
              tar -C "$DIR" -czf - . | kando location push --profile '{{ toJson .Profile }}' --path "$S3PATH" -
              rm -rf "$DIR"
              kando output s3path "$S3PATH"
              kando output points "$POINTS"
  restore:
    type: StatefulSet
    inputArtifactNames: [og]
    phases:
      - func: PrepareData
        name: recoverIntoPvc
        args:
          namespace: "{{ .StatefulSet.Namespace }}"
          image: ACCOUNT.dkr.ecr.ap-south-1.amazonaws.com/coldchain/backup-tools:1
          volumes:
            "{{ .Options.pvc }}": /restore
          command:
            - bash
            - -o
            - errexit
            - -o
            - pipefail
            - -c
            - |
              mkdir -p /tmp/bk && cd /tmp/bk
              kando location pull --profile '{{ toJson .Profile }}' --path '{{ .ArtifactsIn.og.KeyValue.s3path }}' - | tar -xz
              # ts-recover needs the config of the node it restores to; the post builds it from the live ConfigMap
              ts-recover -config=/etc/openGemini/openGemini.conf -recoverMode=2 -fullBackupDataPath=/tmp/bk
  delete:
    type: StatefulSet
    inputArtifactNames: [og]
    phases:
      - func: KubeTask
        name: deleteFromS3
        args:
          namespace: "{{ .StatefulSet.Namespace }}"
          image: ACCOUNT.dkr.ecr.ap-south-1.amazonaws.com/coldchain/backup-tools:1
          command:
            - bash
            - -c
            - kando location delete --profile '{{ toJson .Profile }}' --path '{{ .ArtifactsIn.og.KeyValue.s3path }}'
Read it as three actions. backup (a KubeExec into the backup-tools container) asks openGemini for a full backup into a timestamped folder, counts the points as of now, tars the folder straight into the bucket with kando location push, deletes the local copy and records the S3 path and the count as outputs. restore (a PrepareData pod that mounts a named volume claim) pulls the tarball and runs ts-recover against it. delete removes the object. ts-recover reads the node’s configuration file; the Blueprint expects it at /etc/openGemini/openGemini.conf, so before the first restore, copy the live node’s file to a ConfigMap and mount it in the restore pod (the check in section 4.5 shows the exact error if it is missing). The restore pod, the volume mount and the config file are the parts I could not test, and the post says so in section 10.
kubectl --context hub apply -f kanister/blueprint.yaml
kubectl --context hub -n kanister get blueprint opengemini-bp
4.4 Run a backup
kanctl --context hub create actionset --namespace kanister --action backup \
  --blueprint opengemini-bp --statefulset data/opengemini --profile kanister/$(kubectl --context hub -n kanister get profile -o jsonpath='{.items[0].metadata.name}')
kubectl --context hub -n kanister get actionset
kubectl --context hub -n kanister describe actionset $(kubectl --context hub -n kanister get actionset -o jsonpath='{.items[-1].metadata.name}') | sed -n '/Status/,$p'
Expected: the ActionSet reaches complete, the output artifact shows an s3path like opengemini/20261121T...Z.tar.gz and a points count, and the object is in the bucket:
aws s3 ls s3://$BACKUP_BUCKET/opengemini/4.5 Restore into a scratch volume and compare
Create an empty claim, run the restore action against it, then start a throwaway openGemini pod on that claim and ask it the same question the backup asked:
kubectl --context hub -n data apply -f - <<'YAML'
apiVersion: v1
kind: PersistentVolumeClaim
metadata: { name: og-restore-test }
spec:
  accessModes: [ReadWriteOnce]
  storageClassName: gp3
  resources: { requests: { storage: 20Gi } }
YAML

BACKUP_AS=$(kubectl --context hub -n kanister get actionset -o jsonpath='{.items[-1].metadata.name}')
kanctl --context hub create actionset --namespace kanister --action restore --from $BACKUP_AS \
  --options pvc=og-restore-test
kubectl --context hub -n kanister get actionset -w
When the restore ActionSet is complete, start a pod from the Part 3 image on that claim and count:
kubectl --context hub -n data apply -f - <<YAML
apiVersion: v1
kind: Pod
metadata: { name: og-scratch, labels: { app: og-scratch } }
spec:
  containers:
    - name: opengemini
      image: opengeminidb/opengemini-server:v1.5.2     # the tag from Part 3
      volumeMounts: [{ name: data, mountPath: /var/lib/openGemini }]
  volumes: [{ name: data, persistentVolumeClaim: { claimName: og-restore-test } }]
YAML
kubectl --context hub -n data wait --for=condition=Ready pod/og-scratch --timeout=180s
kubectl --context hub -n data exec og-scratch -- curl -fsS -G http://127.0.0.1:8086/query \
  --data-urlencode "db=telemetry" --data-urlencode 'q=SELECT count(temp_c) FROM "rp400d"."readings"' | jq '.results[0].series[0].values[0][1]'
kubectl --context hub -n kanister get actionset $BACKUP_AS -o jsonpath='{.status.actions[0].artifacts.og.keyValue.points}{"\n"}'
Expected: the two numbers match (the live database may have grown since, but the restored count must equal the count recorded at backup time). If they do not, or the pod will not start, the usual causes are in the troubleshooting table. When done, delete the scratch pod and claim:
kubectl --context hub -n data delete pod og-scratch && kubectl --context hub -n data delete pvc og-restore-testA real recovery of the live database is the same restore action against the live claim with the StatefulSet scaled to zero first (Kanister’s ScaleWorkload function does this and back); add those two phases around recoverIntoPvc once the scratch test passes. Do not add them before, because a failed restore over the live volume is the worst outcome in this part.
Checkpoint: the backup object exists, the restored count equals the recorded count, and the scratch pod and claim are deleted.
5. Kuberhealthy: a check that fails when a vehicle goes silent
The requirement from the overview is “no vehicle silent for 10 minutes”. Kuberhealthy runs a check as a pod on a schedule and records pass or fail. There is no built-in check for a silent vehicle, so you write the small one: it asks openGemini for the newest reading of every device in the last 24 hours and fails if any vehicle’s newest reading is older than ten minutes.
5.1 The check, tested without a cluster
The logic is separate from the network so it can be tested with fake responses. The result is posted to the address Kuberhealthy injects (KH_REPORTING_URL), with the run’s UUID in a header, as the documented external-check protocol describes.
# health/silent_check.py
#!/usr/bin/env python3
"""Kuberhealthy check: fail when any vehicle has been silent longer than MAX_SILENT seconds.
Reads the newest point per device from openGemini (InfluxQL over HTTP) and reports to Kuberhealthy."""
import json, os, sys, time, urllib.parse, urllib.request

HOST = os.environ.get("OG_URL", "http://opengemini.data.svc.cluster.local:8086")
DB = os.environ.get("OG_DB", "telemetry")
RP = os.environ.get("OG_RP", "rp400d")
MAX_SILENT = int(os.environ.get("MAX_SILENT", "600"))
LOOKBACK = os.environ.get("LOOKBACK", "24h")
EXPECTED = int(os.environ.get("EXPECTED_MIN_DEVICES", "1"))

def query(q):
    url = f"{HOST}/query?" + urllib.parse.urlencode({"db": DB, "q": q, "epoch": "s"})
    with urllib.request.urlopen(url, timeout=20) as r:
        return json.load(r)

def newest_per_device(body):
    """Return {device_id: last_seen_epoch_seconds} from a GROUP BY device_id response."""
    out = {}
    for res in body.get("results", []):
        if "error" in res:
            raise RuntimeError(res["error"])
        for s in res.get("series", []) or []:
            dev = (s.get("tags") or {}).get("device_id")
            cols = s["columns"]
            ti = cols.index("time")
            if dev and s["values"]:
                out[dev] = int(s["values"][0][ti])
    return out

def evaluate(last_seen, now, max_silent=MAX_SILENT, expected=EXPECTED):
    """Return a list of failure strings; empty means healthy."""
    fails = []
    vehicles = {d: t for d, t in last_seen.items() if d.startswith("reefer")}
    if len(vehicles) < expected:
        fails.append(f"only {len(vehicles)} vehicles seen in the last {LOOKBACK}, expected at least {expected}")
    silent = sorted((now - t, d) for d, t in vehicles.items() if now - t > max_silent)
    for age, d in silent[-20:]:
        fails.append(f"{d} silent for {age}s (limit {max_silent}s)")
    if len(silent) > 20:
        fails.append(f"... and {len(silent) - 20} more silent vehicles")
    return fails

def main():
    q = (f'SELECT last(temp_c) FROM "{RP}"."readings" WHERE time > now() - {LOOKBACK} GROUP BY device_id')
    try:
        last = newest_per_device(query(q))
    except Exception as e:                       # openGemini unreachable is itself a failure
        report([f"cannot query openGemini: {e}"]); return
    report(evaluate(last, int(time.time())))

def report(fails):
    """Kuberhealthy injects KH_REPORTING_URL and KH_RUN_UUID; the result is a JSON POST with the run UUID in a header."""
    url, uuid = os.environ.get("KH_REPORTING_URL"), os.environ.get("KH_RUN_UUID")
    body = json.dumps({"OK": not fails, "Errors": fails}).encode()
    print("FAIL\n  " + "\n  ".join(fails) if fails else "OK", file=sys.stderr if fails else sys.stdout)
    if not url:                                   # run by hand: the exit code carries the result
        sys.exit(1 if fails else 0)
    req = urllib.request.Request(url, data=body, method="POST",
                                 headers={"Content-Type": "application/json", "kh-run-uuid": uuid or ""})
    urllib.request.urlopen(req, timeout=15).read()

if __name__ == "__main__":
    main()
# health/test_silent.py
import json, sys; sys.path.insert(0, "/tmp/p5/health")
import silent_check as s
body = {"results":[{"series":[
{"name":"readings","tags":{"device_id":"reefer-001"},"columns":["time","last"],"values":[[1000,4.1]]},
{"name":"readings","tags":{"device_id":"reefer-002"},"columns":["time","last"],"values":[[300,4.0]]},
{"name":"readings","tags":{"device_id":"depot-vizag-1"},"columns":["time","last"],"values":[[1,4.0]]}]}]}
last = s.newest_per_device(body); assert last == {"reefer-001":1000,"reefer-002":300,"depot-vizag-1":1}
f = s.evaluate(last, 1100, 600, 1); assert f == ["reefer-002 silent for 800s (limit 600s)"], f
assert s.evaluate(last, 1100, 900, 3)[0].startswith("only 2 vehicles")
assert s.evaluate({}, 1100, 600, 1)[0].startswith("only 0")
try: s.newest_per_device({"results":[{"error":"db not found"}]}); assert False
except RuntimeError: pass
print("silent_check logic OK")cd health && python3 test_silent.pyExpected: silent_check logic OK. The test covers: the newest point per device is read correctly, a vehicle silent for 800 seconds fails and one at 100 seconds passes, a depot sensor is ignored, too few vehicles fails, and an error from openGemini raises instead of passing. A check that cannot reach its data must fail, never pass.
5.2 Install Kuberhealthy and deploy the check
Kuberhealthy v3 is a rewrite; install it from the chart in the project’s repository at the version you chose, and look at what the chart installs before continuing:
git clone --branch $KH_VERSION --depth 1 https://github.com/kuberhealthy/kuberhealthy.git /tmp/kh
helm upgrade --install kuberhealthy /tmp/kh/deploy/helm/kuberhealthy -n kuberhealthy --create-namespace --kube-context hub --wait
kubectl --context hub get crd | grep -i kuberhealthy
The custom resource kind and API version differ between Kuberhealthy releases. The project’s own documentation shows apiVersion: kuberhealthy.github.io/v2 with kind KuberhealthyCheck for external checks, which is what the manifest below uses; the line from the get crd command above is the check. If it lists a different kind (the v3 branch refers to HealthCheck), use that name and keep the podSpec.
Build and push the check image, then apply the manifest:
# health/Dockerfile
FROM python:3.13-slim
COPY silent_check.py /app/silent_check.py
USER 65532
ENTRYPOINT ["python", "/app/silent_check.py"]
aws ecr create-repository --repository-name coldchain/silent-check --image-tag-mutability IMMUTABLE >/dev/null
docker buildx build --platform linux/amd64 -t $ECR/coldchain/silent-check:1 --push health/
sed "s/ACCOUNT/$ACCOUNT/" health/khcheck.yaml > /tmp/khcheck.yaml # health/khcheck.yaml is the manifest below
kubectl --context hub apply -f /tmp/khcheck.yaml# health/khcheck.yaml
apiVersion: kuberhealthy.github.io/v2
kind: KuberhealthyCheck
metadata: { name: vehicles-silent, namespace: kuberhealthy }
spec:
runInterval: 2m
timeout: 90s
podSpec:
containers:
- name: check
image: ACCOUNT.dkr.ecr.ap-south-1.amazonaws.com/coldchain/silent-check:1
env:
- { name: OG_URL, value: "http://opengemini.data.svc.cluster.local:8086" }
- { name: MAX_SILENT, value: "600" }
- { name: EXPECTED_MIN_DEVICES, value: "1" }
resources: { requests: { cpu: 25m, memory: 32Mi }, limits: { memory: 64Mi } }
restartPolicy: NeveropenGemini accepts connections only from named namespaces (Part 3’s NetworkPolicy), so add kuberhealthy to the list in platform/opengemini.yaml and apply it, or the check will report that it cannot query:
sed -i 's/values: \[ingest, react, monitoring, data\]/values: [ingest, react, monitoring, data, kuberhealthy]/' platform/opengemini.yaml
kubectl --context hub apply -f platform/opengemini.yaml
5.3 Make it fail on purpose
With Part 2’s simulator running at least one vehicle, wait for two runs and read the state:
kubectl --context hub -n kuberhealthy get khcheck vehicles-silent -o yaml | sed -n '/status:/,$p'Expected with a live simulator: the check is ok: true. Now stop the vehicle (kill the simulator process for reefer-001), wait more than ten minutes plus one run interval, and read it again: ok: false with an error naming reefer-001. Start the vehicle again and the next run turns healthy.
5.4 Alert on it
Kuberhealthy exposes check results as Prometheus metrics. Add a rule so a failing check reaches the Alertmanager route from Part 3:
# platform/kh-alert.yaml
apiVersion: monitoring.coreos.com/v1
kind: PrometheusRule
metadata: { name: kuberhealthy-silent, namespace: monitoring, labels: { release: kube-prometheus-stack } }
spec:
  groups:
    - name: coldchain-health
      rules:
        - alert: VehiclesSilent
          expr: kuberhealthy_check{check="kuberhealthy/vehicles-silent"} == 0     # confirm the metric name, see the post
          for: 4m
          labels: { severity: critical }
          annotations: { summary: "A vehicle has been silent for more than 10 minutes", runbook: "kubectl -n kuberhealthy get khcheck vehicles-silent -o yaml" }
kubectl --context hub apply -f platform/kh-alert.yaml
kubectl --context hub -n monitoring port-forward svc/kube-prometheus-stack-prometheus 9090:9090 &
curl -s localhost:9090/api/v1/label/__name__/values | jq -r '.data[]' | grep -i kuberhealthyThe expression in the rule uses a metric name from Kuberhealthy v2’s documentation (kuberhealthy_check, value 1 for healthy). The last command lists the names your version actually exposes; if the rule’s name is not among them, change it before trusting the alert. The same forced-failure test from 5.3 should now produce a VehiclesSilent alert after four minutes, in the receivers Part 3 set up.
Note what the check does not do. It sees a vehicle whose data stopped arriving anywhere along the path (vehicle, IoT Core, MSK, Vector, openGemini), which is the point, but it cannot say where the path broke. The Part 3 Kafka lag and Vector metrics narrow that down. And a vehicle that has never reported does not appear in the query, so the EXPECTED_MIN_DEVICES setting is the only guard against an empty fleet; set it to the real number once the fleet is real.
Checkpoint: the offline test passes, the check is healthy with a live vehicle, fails within about twelve minutes of stopping one, and the alert reaches a receiver.
6. Scale: Kube-burner and the simulator, with hypotheses first
The requirement is 400 vehicles, 2,000 containers and 40 depots. Two different things scale, and they need two different loads. Kube-burner creates Kubernetes objects at a controlled rate and measures how the cluster copes: it exercises the API server, the scheduler and the kubelet. It does not send telemetry. The telemetry side (MQTT messages, Kafka, Vector, openGemini writes) is loaded by running many copies of the Part 2 simulator.
6.1 Write the hypotheses down
Before running anything, write what you expect and what each result would mean. These are design arithmetic, not measurements.
| # | Hypothesis | If it holds | If it fails |
|---|---|---|---|
| H1 | 400 vehicles at one reading per 10 seconds is 40 messages a second; 2,000 containers add 200; depots add more. About 250 to 300 messages a second in total | Kafka, Vector and openGemini keep consumer lag near zero | Lag grows steadily: Vector or openGemini is the bottleneck; look at batch size and the single openGemini replica first |
| H2 | The hub’s API server and scheduler handle creating 400 namespaces with a ConfigMap and a pod each at 20 requests a second without errors | Pod start latency stays in the low seconds | Latency climbs or requests are throttled: the control plane or node count is too small for this object churn |
| H3 | While H1 and H2 run, the 60-second alert path still fires | An excursion injected during the load alerts within the target | The alert path shares a bottleneck with the load: find which stage slowed |
| H4 | The Kuberhealthy silent check stays healthy during the load | No vehicle is reported silent | Silent vehicles under load means data is being delayed or dropped somewhere; compare with the lag |
The 2,000 containers and 40 depots are a ratio, not extra work: a container is a message source like a vehicle, a depot is a source with a local broker. Running 400 sources and multiplying by the message rate is how you estimate the rest, and this post says so rather than pretending to have run 2,000.
6.2 The telemetry load
The Part 2 simulator in emqx mode needs no per-device certificate, so one pod can run many of them. This script starts a block of simulated vehicles inside one pod, with the connections staggered so they do not arrive in one burst:
# burner/launch.sh
#!/usr/bin/env bash
# Start N simulated vehicles inside one pod. Usage: launch.sh FIRST COUNT EMQX_HOST
# Each process is the Part 2 simulator in emqx mode, so no per-device certificate is needed.
set -euo pipefail
FIRST=${1:?first index}; COUNT=${2:?count}; HOST=${3:?emqx host}
INTERVAL=${INTERVAL:-10}; DRY=${DRY:-0}
pids=()
trap 'kill "${pids[@]}" 2>/dev/null || true' EXIT
for i in $(seq "$FIRST" $((FIRST + COUNT - 1))); do
  id=$(printf 'reefer-%03d' "$i")
  cmd=(python /sim/fleet.py --device "$id" --mode emqx --host "$HOST" --kind truck --interval "$INTERVAL" --spool "/tmp/$id.db")
  if [ "$DRY" = 1 ]; then echo "${cmd[*]}"; else "${cmd[@]}" & pids+=($!); sleep 0.1; fi   # stagger the connects
done
[ "$DRY" = 1 ] || wait
Dry-run it first; it prints the commands without starting anything:
DRY=1 ./burner/launch.sh 4 3 emqx.sensorsExpected: three lines, for reefer-004, reefer-005 and reefer-006. Run it as a Job with eight pods of 50 vehicles each (400 in total), mounting the simulator from the ConfigMap Part 2 created:
kubectl --context depot -n sensors create configmap launch --from-file=burner/launch.sh --dry-run=client -o yaml | kubectl --context depot apply -f -
kubectl --context depot -n sensors apply -f - <<'YAML'
apiVersion: batch/v1
kind: Job
metadata: { name: fleet-load }
spec:
  completions: 8
  parallelism: 8
  completionMode: Indexed
  backoffLimit: 0
  activeDeadlineSeconds: 1800
  template:
    spec:
      restartPolicy: Never
      containers:
        - name: sim
          image: python:3.13-slim
          command: [bash, -c, "pip install -q paho-mqtt && bash /launch/launch.sh $((100 + JOB_COMPLETION_INDEX * 50)) 50 emqx.sensors.svc.cluster.local"]
          env: [{ name: INTERVAL, value: "10" }]
          volumeMounts: [{ name: fleet, mountPath: /sim }, { name: launch, mountPath: /launch }]
          resources: { requests: { cpu: 100m, memory: 128Mi }, limits: { memory: 512Mi } }
      volumes: [{ name: fleet, configMap: { name: fleet } }, { name: launch, configMap: { name: launch } }]
YAML
The job stops itself after 30 minutes. The pip install line assumes the simulator’s only dependency is the MQTT client library; use the requirements.txt from Part 2 if it lists more. The vehicle numbers start at 100 so they do not collide with the three vehicles from Part 2. The emqx host is Part 2’s depot broker; the telemetry then flows over its bridge to IoT Core as designed. Because 400 sources through one depot broker is a different shape from 40 depots with ten each, treat this as a test of the hub’s side of the pipeline, not of the depot broker.
6.3 The object load
Kube-burner reads a configuration file that says how many iterations to run, at what rate, and which object templates to create each time. The job below creates 400 namespaces (one per simulated vehicle), each with a ConfigMap and a pod that does nothing, at 20 requests a second with a burst of 40, and records pod start latency:
# burner/config.yml
global:
  gc: true                      # delete what the job created when it ends
  measurements:
    - name: podLatency
metricsEndpoints:
  - endpoint: http://localhost:9090      # port-forward to Prometheus, see the post
jobs:
  - name: fleet-objects
    jobType: create
    jobIterations: 400          # one namespace per simulated vehicle
    qps: 20
    burst: 40
    namespacedIterations: true
    namespace: fleet-burn
    podWait: false
    waitWhenFinished: true
    maxWaitTimeout: 15m
    objects:
      - objectTemplate: templates/configmap.yml
        replicas: 1
      - objectTemplate: templates/pod.yml
        replicas: 1
# burner/templates/configmap.yml
apiVersion: v1
kind: ConfigMap
metadata: { name: vehicle-{{ .Iteration }}-{{ .Replica }} }
data: { device_id: "reefer-{{ .Iteration }}" }# burner/templates/pod.yml
apiVersion: v1
kind: Pod
metadata: { name: vehicle-{{ .Iteration }}-{{ .Replica }}, labels: { app: fleet-burn } }
spec:
containers:
- name: idle
image: registry.k8s.io/pause:3.10
resources: { requests: { cpu: 5m, memory: 8Mi } }Install the binary from the release you pinned, port-forward Prometheus so the run can read cluster metrics, and run it against the hub:
curl -fsSL https://github.com/kube-burner/kube-burner/releases/download/v${KB_VERSION}/kube-burner-V${KB_VERSION}-linux-x86_64.tar.gz | tar -xz -C /tmp kube-burner
kubectl --context hub -n monitoring port-forward svc/kube-prometheus-stack-prometheus 9090:9090 &
cd burner && /tmp/kube-burner init -c config.yml --uuid fleet-$(date -u +%H%M) 2>&1 | tee /tmp/kb.log
The release file name pattern above is the one I expect; if the download fails, open the release page and copy the exact asset name. Kube-burner’s own documentation describes the init command, jobIterations, qps, burst and the podLatency measurement; I did not run this configuration, so confirm the field names with kube-burner init --help and its documentation for your version, and treat the numbers in the config as the plan.
6.4 Read the result
Read three things during and after the run: the end of /tmp/kb.log (the pod latency summary and any errors), the Prometheus view of the consumer group lag and API server request duration, and the Kuberhealthy check.
tail -30 /tmp/kb.log
kubectl --context hub -n kuberhealthy get khcheck vehicles-silent -o jsonpath='{.status.ok}{"\n"}'
curl -s 'localhost:9090/api/v1/query' --data-urlencode 'query=histogram_quantile(0.99, sum by (le) (rate(apiserver_request_duration_seconds_bucket{verb!="WATCH"}[5m])))' | jq '.data.result[0].value[1]'
Compare against the hypotheses: for each H, write down pass, fail or not measured, and what you will change. Keep the table. When the run ends the gc: true setting removes the 400 namespaces; confirm with kubectl --context hub get ns | grep -c fleet-burn printing 0, and delete the load job (kubectl --context depot -n sensors delete job fleet-load). The silent check will report the 400 test vehicles silent once they stop, which is correct behaviour and a good reason to run the load in a window you have told the on-call about.
Checkpoint: the hypotheses table is filled in with what happened, the Kube-burner namespaces are gone and the load job is deleted.
7. Cost review
Before tearing down, look at what is still running and what it costs; that is the review. Use the account’s own numbers, not the estimate in Part 1:
# running instances and databases, tagged by project
aws resourcegroupstaggingapi get-resources --tag-filters Key=project,Values=cold-chain \
  --query 'ResourceTagMappingList[].ResourceARN' --output text | tr '\t' '\n' | sed 's/:[^:]*$//' | sort | uniq -c | sort -rn
aws ec2 describe-nat-gateways --filter Name=state,Values=available --query 'NatGateways[].NatGatewayId'
aws kafka list-clusters-v2 --query 'ClusterInfoList[].[ClusterName,State]' --output text
aws rds describe-db-instances --query 'DBInstances[].[DBInstanceIdentifier,DBInstanceClass,DBInstanceStatus]' --output text
aws ce get-cost-and-usage --time-period Start=$(date -u -d '-7 days' +%F),End=$(date -u +%F) --granularity DAILY \
  --metrics UnblendedCost --group-by Type=DIMENSION,Key=SERVICE --filter '{"Tags":{"Key":"project","Values":["cold-chain"]}}' \
  --query 'ResultsByTime[].Groups[].[Keys[0],Metrics.UnblendedCost.Amount]' --output text | sort -k2 -nr | head
Expected: the largest lines are MSK, EC2 (the three EKS nodes and the NAT gateway) and RDS. Cost Explorer must be enabled in the account (it is not on by default, and it lags by up to a day), and it only sees resources carrying the project=cold-chain tag that Part 1’s provider default adds; resources created by Crossplane or by kanctl may need the tag added. The rule of thumb from Part 1 stands: MSK and the nodes are the cost to watch, so build, check and destroy in the same sitting.
8. All fourteen tools: wired, partly, or not
The overview promised that all 14 Sprint 5 tools wire into one project and said how. This is the check, written after the five parts and with the limits stated plainly. “Wired” means a step in a part connects it and a checkpoint proves it; it does not mean a live run, because the build in this series was written from documentation and offline tests, not executed on a cluster.
| # | Tool | Where it is wired | Status and the honest limit |
|---|---|---|---|
| 1 | k0s | Part 1 depot | Wired as a single-node cluster on a virtual machine. Vehicles run the simulator, not k0s |
| 2 | Open Cluster Management | Part 1 hub and depot | Wired; the depot’s agent dials the hub, so the hub API must be reachable from the depot |
| 3 | Vector | Part 3 | Wired as a design: the Kafka source and the InfluxDB-protocol sink are documented separately, and the pair into openGemini is checked in Part 3 for field types, tags and authentication. It replaced the Tremor named in an earlier plan on 12 November |
| 4 | Apache Kafka | Parts 1 to 3 (MSK) | Wired on MSK with SCRAM; IoT Core’s Kafka action needs a VPC destination and does not support MSK Serverless |
| 5 | openGemini | Part 3, backup in this part | Wired; authentication is off in this build and protected by a network policy; its backup copies to S3 through Kanister here |
| 6 | Knative | Parts 3 and 4 | Wired; the alert handler keeps a minimum of one replica so scale-to-zero does not add delay |
| 7 | Microcks | Part 4 | Wired; it brings its own Keycloak and MongoDB, so it does not use Dex. The contract test runs from a workstation through a port-forward |
| 8 | Dex | Part 4 | Wired for partners and the partner API only. It does not sign anyone into Grafana in this build, although the overview’s table once said it would |
| 9 | OpenFGA | Part 4 | Wired, on CloudNativePG; its database now has a backup and a tested restore (section 2) |
| 10 | SOPS | Part 4 | Partly: Argo CD has no built-in SOPS support, so a plugin (KSOPS) decrypts at sync; that path was designed and checked against documentation, not run |
| 11 | Crossplane | Part 1 | Partly: buckets, IoT things, certificates and policies; Location resources, the Kafka rule and the VPC destination stay with OpenTofu |
| 12 | Kanister | Part 5 (this part) | Partly: it runs the openGemini backup call and copies the result; restore into a scratch volume is the tested shape, and a restore over the live volume is documented but not part of the test. Its S3 Profile needs a key pair in this build |
| 13 | Kube-burner | Part 5 (this part) | Partly: it creates Kubernetes objects, not telemetry; the telemetry load comes from the simulator |
| 14 | Kuberhealthy | Part 5 (this part) | Wired through a custom check; no built-in “vehicle silent” check exists. The custom resource kind differs between versions, so the install step says how to confirm it |
Three claims in this series are design targets and not measurements: 400 vehicles, 2,000 containers and 40 depots (section 6 explains the arithmetic and what was and was not run), the 60-second alert target (which holds while the vehicle has a link, because the alert path is in the cloud), and the 10-minute silence rule (a setting in the check). Nothing in the five parts was executed on a live AWS account by the author; each command is taken from official documentation and the offline tests are listed in section 10.
9. Teardown
Order matters. Argo CD must stop putting things back, Crossplane objects must go before the cluster that runs Crossplane, buckets with locked versions must be emptied before OpenTofu can remove them, and the paid items (MSK above all) should go early. This script does the whole sequence in order and asks before it starts. It is the only script in the series that deletes things at scale, so read it once before you run it.
First the helper that empties a versioned, Object Lock bucket. Object Lock in governance mode can be bypassed by an identity that has the s3:BypassGovernanceRetention permission, and the script asks for the bypass; compliance mode cannot be bypassed by anyone, and objects in it fail with AccessDenied until their retention ends (the script stops at the first failure so you can see which). The Part 1 evidence bucket uses governance mode with 30 days.
# ops/empty-bucket.sh
#!/usr/bin/env bash
# Usage: empty-bucket.sh BUCKET
# Deletes every object version and delete marker, bypassing GOVERNANCE retention.
# Compliance-mode locks cannot be bypassed: those objects fail and the script stops.
set -euo pipefail
B="${1:?bucket name}"
while :; do
  page=$(aws s3api list-object-versions --bucket "$B" --max-items 1000 --output json)
  payload=$(jq -c '{Objects: ([(.Versions // [])[], (.DeleteMarkers // [])[]] | map({Key: .Key, VersionId: .VersionId})), Quiet: true}' <<<"$page")
  n=$(jq '.Objects | length' <<<"$payload")
  [ "$n" -eq 0 ] && break
  out=$(aws s3api delete-objects --bucket "$B" --bypass-governance-retention --delete "$payload" --output json)
  errs=$(jq '(.Errors // []) | length' <<<"$out")
  if [ "$errs" -gt 0 ]; then jq -r '.Errors[] | "\(.Key) \(.Code): \(.Message)"' <<<"$out" >&2; exit 1; fi
  echo "deleted $n versions from $B"
done
echo "$B is empty"
I tested the loop against a stub aws that returned 2,500 object versions in three pages of 1,000, 1,000 and 500 (the script printed each page and then is empty) and against a stub that returned an access-denied error (the script printed the error and exited non-zero). I did not run it against S3.
#!/usr/bin/env bash
# ops/teardown.sh
set -euo pipefail
: "${SUFFIX:?}" "${AWS_REGION:?}"
STATE_BUCKET=coldchain-tfstate-$SUFFIX
read -r -p "This destroys the cold-chain build in $AWS_REGION (suffix $SUFFIX). Type the suffix to continue: " ok
[ "$ok" = "$SUFFIX" ] || { echo "not confirmed"; exit 1; }

echo "1/8 stop Argo CD from recreating things"
kubectl --context hub -n argocd delete application root crossplane-providers --ignore-not-found --wait=true --timeout=300s

echo "2/8 remove workloads that hold volumes and load balancers"
kubectl --context hub delete ns react access ingest dashboards monitoring data kanister kuberhealthy --ignore-not-found --wait=true --timeout=600s || true

echo "3/8 remove the Crossplane-managed AWS objects"
kubectl --context hub -n aws-resources delete things.iot.aws.m.upbound.io,policies.iot.aws.m.upbound.io,certificates.iot.aws.m.upbound.io --all --wait=true --timeout=600s || true

echo "4/8 empty the buckets (versions, delete markers, governance-mode locks)"
for b in coldchain-evidence-$SUFFIX coldchain-drill-$SUFFIX coldchain-backup-$SUFFIX; do
  aws s3api head-bucket --bucket "$b" 2>/dev/null && ./ops/empty-bucket.sh "$b" || echo "skip $b"
done

echo "5/8 remove the Kanister IAM user and any leftover RDS test instance and snapshots"
for k in $(aws iam list-access-keys --user-name coldchain-kanister --query 'AccessKeyMetadata[].AccessKeyId' --output text 2>/dev/null); do
  aws iam delete-access-key --user-name coldchain-kanister --access-key-id "$k"
done
aws iam delete-user-policy --user-name coldchain-kanister --policy-name backup-prefix 2>/dev/null || true
aws iam delete-user --user-name coldchain-kanister 2>/dev/null || true
aws rds delete-db-instance --db-instance-identifier coldchain-pg-restore-test --skip-final-snapshot 2>/dev/null || true
for s in $(aws rds describe-db-snapshots --snapshot-type manual --query "DBSnapshots[?starts_with(DBSnapshotIdentifier,'coldchain-pg-test-')].DBSnapshotIdentifier" --output text); do
  aws rds delete-db-snapshot --db-snapshot-identifier "$s"
done

echo "6/8 delete the ECR repositories (a repository with images blocks the destroy), then destroy the foundation"
for r in $(aws ecr describe-repositories --query 'repositories[?starts_with(repositoryName,`coldchain/`)].repositoryName' --output text); do
  aws ecr delete-repository --repository-name "$r" --force >/dev/null
done
export TF_VAR_suffix=$SUFFIX            # the other TF_VAR_ values from Parts 1 to 4 must still be exported
( cd infra/foundation && tofu destroy -auto-approve )

echo "7/8 remove the state bucket last"
./ops/empty-bucket.sh "$STATE_BUCKET" && aws s3api delete-bucket --bucket "$STATE_BUCKET"

echo "8/8 the depot virtual machine"
echo "On the depot VM run:  sudo k0s stop && sudo k0s reset"
echo "Done. Check the bill tomorrow: Cost Explorer lags by a day."
bash -n ops/teardown.sh && echo "syntax ok"Three honest notes. tofu destroy needs every variable the apply needed (domain, your IP range, the version pins), so keep the same TF_VAR_ exports or terraform.tfvars in place; the ECR loop uses --force because Part 1 does not set force_delete on the repositories, and OpenTofu then sees them as already gone. KMS keys are scheduled for deletion (seven days here), not deleted at once, and a key pending deletion still appears in listings.
After the script, verify nothing billable remains:
aws kafka list-clusters-v2 --query 'ClusterInfoList[].ClusterName'
aws eks list-clusters
aws rds describe-db-instances --query 'DBInstances[].DBInstanceIdentifier'
aws ec2 describe-nat-gateways --filter Name=state,Values=available --query 'NatGateways[].NatGatewayId'
aws ec2 describe-addresses --query 'Addresses[?AssociationId==null].PublicIp'
aws s3api list-buckets --query "Buckets[?contains(Name,'$SUFFIX')].Name"
Expected: every list empty (an unattached Elastic IP is billed, which is why that one is there).
Checkpoint: the six lists are empty, the Kanister user is gone, and the depot VM is reset.
10. Troubleshooting, cost, cleanup, design notes and checklist
Troubleshooting
| Symptom | Likely cause | Fix |
|---|---|---|
CloudNativePG Backup stays started or fails |
The pod has no S3 permission, or the Pod Identity association names the wrong service account | kubectl -n access describe backup fga-first; confirm the association is for namespace access, service account fga-pg, and restart the pods after creating it |
x-amz-content-sha256 error on upload |
boto3 data-integrity change against the S3 endpoint | Use the environment-variable workaround on the plugin’s object-store documentation page, in the ObjectStore |
Restore cluster never becomes Ready |
The serverName does not match the name the backups were written under, or WAL was not archived |
kubectl -n access logs fga-pg-restore-1-full-recovery-...; check the prefix in S3 matches serverName: fga-pg |
kanctl create profile or the ActionSet fails on S3 |
The IAM policy does not cover the prefix or the KMS key | Read the ActionSet’s error; test the key with aws s3 cp using it |
Backup phase fails with curl: not found |
The sidecar image is not the tools image | kubectl -n data get pod opengemini-0 -o jsonpath='{.spec.containers[*].image}' |
| Backup call returns an error about the path | The path is not writable by the server process | The folder must be on the shared volume, as in the Blueprint; check ownership with ls -ld in the sidecar |
Restore phase: ts-recover cannot find its config |
The node configuration is not at the path the Blueprint expects | Copy the live file out of the StatefulSet pod, put it in a ConfigMap, mount it in the restore pod, and point -config at it |
| Restore completes but the scratch pod will not start | The recovered meta and data folders need to stay together on one volume, and addresses in the recovered metadata must match the pod | One report describes the server hanging at start when addresses in the restored metadata do not match the configuration; restore the config you used at backup time |
Kuberhealthy check pod stays Pending or ImagePullBackOff |
ECR pull permission or the image tag | Nodes pull from ECR with the node role; confirm the repository and tag |
| Check always fails with “cannot query openGemini” | The NetworkPolicy does not allow the kuberhealthy namespace |
Re-apply platform/opengemini.yaml from section 5.2 |
VehiclesSilent never fires |
The metric name differs in your version | Use the label-values command in section 5.4 and fix the rule |
| Kube-burner: 429 or timeouts | The API server is throttling or the node count is too low | Lower qps and burst; that finding is hypothesis H2 failing, not a bug |
| Teardown: bucket will not empty | Compliance-mode lock, or the identity lacks s3:BypassGovernanceRetention |
Add the permission for governance mode; compliance mode must wait for retention to end |
Teardown: tofu destroy stops at a VPC |
An EKS-created load balancer or network interface remains | Delete the namespaces first (step 2 of the script) and wait; then retry |
Cost note
Costs in this part come from what stays running while you test. An RDS restore instance, an extra CloudNativePG cluster and the load job’s pods are billed until you delete them, and the deletes are in the steps. The 400-namespace Kube-burner run adds API and scheduling load but little compute, because each pod only sleeps and asks for 5 millicores. The scale job’s pods are the larger cost. I did not read Mumbai prices for RDS, EC2, MSK or S3; use the account’s own Cost Explorer (section 7) and the pricing pages for ap-south-1. The Part 1 US East list prices for EKS and MSK are the ones read on 18 November 2026.
Cleanup
Section 9 is the cleanup. Run it in the same sitting as the final checks if you do not need the build, and then check the account the next day, because Cost Explorer lags.
Design notes and version checks
- What could not be tested. Nothing in this post was run on a live AWS account or a live cluster. Offline, I ran: the silent-vehicle logic against fake responses (including its reporting call against a local server), the bucket-emptying loop against a stub, the simulator launcher in dry-run, the shell syntax of the scripts and the YAML parse of each manifest. Not tested: the CloudNativePG plugin install and restore, the RDS snapshot commands, the Kanister Blueprint (the sidecar,
kando,ts-recover, the restore pod), the Kuberhealthy install and its resource kind, the Kube-burner configuration and download name, and the Prometheus rule. - CloudNativePG and the plugin. The plugin requires operator 1.26 or newer and cert-manager, and replaces the older in-tree
barmanObjectStoresection. The resource shapes (ObjectStore,pluginswithbarmanObjectName,ScheduledBackupwithmethod: plugin,externalClusterswith apluginblock andserverName) follow the plugin’s usage page; confirm field names withkubectl explainon your version. S3 access through the pod’s role is documented as one of two routes; the other is access keys. - openGemini. The backup call and
ts-recoverare from the project’s backup and restore page. That page says remote backup is not supported and that restoring to the original cluster needs the processes stopped. The tools image is my addition. - Kanister. The Blueprint uses
KubeExec,PrepareDataandKubeTask,kando location push,kando location deleteandkando output, which appear in the Kanister documentation and the Kanister brief. The Profile’s key pair is a limit I could not remove. Backups are not pruned automatically; run thedeleteaction. - Kuberhealthy. The check follows the documented external-check protocol (a JSON report to the injected URL with the run’s UUID header). The kind and API version, and the metric name, differ between releases; two commands in section 5 confirm them.
- Kube-burner. The config fields are the ones the documentation lists for
createjobs; confirm against your version’s reference. It is a load generator for the Kubernetes API, not for telemetry. - Numbers. The 400, 2,000 and 40 are targets. Section 6 turns them into hypotheses.
- Why RDS appears. It is not a CNCF project; a restore test of it belongs here because the business data lives there.
Setup checklist
- 1. Prerequisites: done when Parts 1 to 4 pass their checkpoints and the Part 5 variables are set
- 2. CloudNativePG backup: done when a Backup is
completed, objects are infga-pg/and the restored cluster’s tuple count matches the live one - 3. RDS snapshot restore: done when the restored instance’s counts match, and the test instance and snapshot are deleted
- 4. Kanister: done when a backup ActionSet is
complete, the object is in S3 and the scratch restore’s count equals the recorded count - 5. Kuberhealthy: done when the offline test passes, the check is healthy with a live vehicle, fails after one is stopped, and the alert reaches a receiver
- 6. Scale test: done when the hypotheses table is filled with what happened and the test namespaces and job are gone
- 7. Cost review: done when you know what is still running and what it costs
- 8. Fourteen tools: done when each row of the table has a status you can defend with a step and a checkpoint
- 9. Teardown: done when the six verification lists are empty, the Kanister user is gone and the depot VM is reset
Tools used
Kanister, Kube-burner, Kuberhealthy, CloudNativePG, openGemini, Prometheus, Argo CD, OpenTofu and Crossplane, plus Amazon RDS for PostgreSQL, Amazon S3, AWS KMS, Amazon ECR and EKS Pod Identity.
What comes next
This is the last part of the Sprint 5 project. The overview’s architecture and its wiring table are the record of how the pieces fit, and the table in section 8 is the record of where they do not fit completely.
Sources:
- Barman Cloud Plugin: introduction and requirements
- Barman Cloud Plugin: usage, backups and restore
- Barman Cloud Plugin: object stores, S3 and the sha256 workaround
- openGemini: backup and restore
- Kanister function reference (KubeTask, outputs)
- Kanister repository
- Kuberhealthy: creating checks
- Kuberhealthy JavaScript client: injected environment and header
- Kube-burner documentation
- Earlier parts of this series: Overview, Part 1, Part 2, Part 3, Part 4